

To compare whether there are differences among hospital and population controls.
MethodsTwo case-control studies were conducted on lung cancer risk factors in the Santiago de Compostela Public Health District. Whereas one used randomly chosen censusbased population controls, the other used consecutive hospital controls that went to the reference hospital for non-smoking-related trivial interventions. The differences were analyzed using logistic regression. The dependent variable was type of control (hospital or population).
ResultsHospital controls had a similar tobacco habit than population controls, but consumed more alcohol. For those consuming more than 50 ml daily, the risk of being a hospital control was 4.83 (95%CI: 2.55-9.14).
ConclusionsThere may be some differences between hospital and population-based controls, which must be taken into account in the design of case-control studies. It is necessary to ascertain whether such differences are reproduced at other geographic locations and whether they can affect estimation of exposure-disease.
Comparar si hay diferencias entre los controles poblacionales y los hospitalarios.
MétodosSe llevaron a cabo dos estudios de casos y controles sobre factores de riesgo de cáncer de pulmón en el Área Sanitaria de Santiago de Compostela. En uno de los estudios los controles fueron seleccionados aleatoriamente entre la población general, y en el otro los controles hospitalarios fueron incluidos de manera consecutiva entre los individuos que acudían al hospital por intervenciones quirúrgicas banales no relacionadas con el consumo de tabaco. Las diferencias fueron analizadas mediante regresión logística. La variable dependiente fue el tipo de control (hospitalario o poblacional).
ResultadosLos controles hospitalarios y los poblacionales tenían un hábito tabáquico similar, pero los controles hospitalarios consumían más alcohol. Para los que consumían más de 50 ml al día, el riesgo de ser un control hospitalario fue de 4,83 (intervalo de confianza del 95%: 2,55-9,14).
ConclusionesPodría haber algunas diferencias entre los controles poblacionales y los hospitalarios que deberían tenerse en cuenta cuando se diseñe un estudio de casos y controles. Es necesario saber si esas diferencias son similares en otras áreas geográficas y si podrían afectar a la estimación de las medidas de efecto entre exposición y enfermedad.
Case-control studies are one of the most fre- quently used designs in epidemiology, having been de- fined as an efficient version of cohort studies1. Part of the validity of case-control studies resides in appropria- te selection of controls. There are two major groups of controls, viz., population and hospital, yet few studies have compared the two. It has been claimed that, if hospital controls are properly selected, there should be no important differences as against population controls in terms of the risks obtained for any given disease2.
This study sought to compare the characteristics of the above two groups of controls (hospital and population) recruited in the same public health district for two case-control studies on risk factors for lung cancer.
MethodsThe two groups of controls were enrolled for two lung cancer studies. The objectives of the respective studies were: in one case, to analyze the effect of radon ex- posure3; and in the other, to analyze the effect of envi- ronmental and genetic risk factors of lung cancer4. In both studies, participation was restricted to subjects over 35 years and the sampling was performed based on sex frequency among cases.
Hospital-based controlsControls attending the Santiago de Compostela Hospital Complex Preoperative Unit for trivial surgery were recruited between May 1999-May 2000 through con- secutive sampling. Subjects with previous neoplasms were excluded. The breakdown of these surgical inter- ventions was as follows: 31%, cataracts; 30%, inguinal hernias; 11%, orthopedic surgery; and the remainder, non-smoking-related interventions. All interviews were conducted by a single interviewer at the hospital. Participation was100%.
Population controlsA total of 500 subjects from the Health Area of the Santiago de Compostela Hospital Complex were initially selected, using the 1991 census. A proportional strati- fied random sampling was carried out, based on dis- tribution by sex among cases and the population weighting of different sub-areas.
The following exclusion criteria were established for controls: less than 5 years uninterrupted residence in the current home and/or residence of any length in any dwelling that had undergone major structural alterations. Individuals suffering respiratory tract diseases or having a clinical history of any type of neoplasm, past or pre- sent, were excluded. Interviews were conducted at home by two interviewers. A total of 391 subjects met the eli- gibility criteria, 241 of whom finally participated as population controls, entailing a participation of 61.6%.
Data-source and definition of variablesThe questionnaires were very similar in both studies, since they sought to measure the same effect (lung cancer) and a series of variables common to both studies (tobacco use, alcohol, occupation, and diet). Both questionnaires had been previously tested on a group of per- sons who had similar characteristics, and all questions poorly drafted or ambiguous were duly amended or eli- minated.
A smoker was defined as any subject who, at some stage in his/her life, had smoked a minimum of one ci- garette per day for at least one year. An ex-smoker was defined as any subject who, at the date of the interview, had refrained from smoking for at least one year. Week- ly alcohol consumption (in grams) was deemed to be the combined intake of different alcoholic beverages, such as wine, beer, and spirits. In addition, educatio- nal level was classified into no formal education, primary education, and secondary or higher education. We ga- thered information on individuals' occupations, and con- sidered those defined as risk occupations for lung cancer5. Subjects were classified dichotomously as exposed or non-exposed, according to whether they had worked for a minimum of one year in an occupation deemed to be a risk for lung cancer.
Statistical analysisData were analyzed using unconditional logistic re- gression, calculating the probability of being a hospital control versus a population control. We conside- red the following independent variables: duration of smoking (classified into non-smokers, 1-30 years, and over 30 years); number of cigarettes smoked per day (classified into non-smokers, 1-20, and over 20), number of cigarette packs smoked over a lifetime (with non- smokers and smokers divided into equal parts, equi- valent to moderate and heavy smokers); educatio- nal level (no formal education, primary education, and secondary or higher education); occupation and daily alcohol consumption (non-drinkers, moderate drinkers [1 to 50 ml per day] and heavy drinkers [> 50 ml per day]).
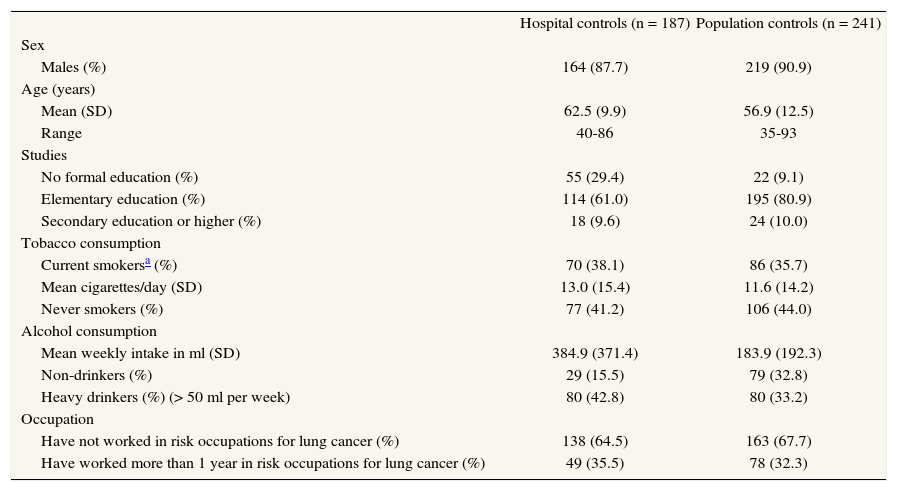
Practice applicationA description of the study sample is shown in table 1. A total of 187 hospital and 241 population controls were included. There was a difference of six years in the mean age of the two groups, though the age range was similar. The percentage of individuals with secondary or higher education was likewise similar, but the percentage of individuals without any formal education was greater among hospital controls. Whereas the percentage of smokers was slightly higher among hospital controls, the number of cigarettes smoked per day and percentage of never-smokers was very much alike in both control groups. Alcohol consumption was higher among hospital controls, as was the percentage of drinkers.
Description of the sample of hospital and population controls
| Hospital controls (n = 187) | Population controls (n = 241) | |
| Sex | ||
| Males (%) | 164 (87.7) | 219 (90.9) |
| Age (years) | ||
| Mean (SD) | 62.5 (9.9) | 56.9 (12.5) |
| Range | 40-86 | 35-93 |
| Studies | ||
| No formal education (%) | 55 (29.4) | 22 (9.1) |
| Elementary education (%) | 114 (61.0) | 195 (80.9) |
| Secondary education or higher (%) | 18 (9.6) | 24 (10.0) |
| Tobacco consumption | ||
| Current smokersa (%) | 70 (38.1) | 86 (35.7) |
| Mean cigarettes/day (SD) | 13.0 (15.4) | 11.6 (14.2) |
| Never smokers (%) | 77 (41.2) | 106 (44.0) |
| Alcohol consumption | ||
| Mean weekly intake in ml (SD) | 384.9 (371.4) | 183.9 (192.3) |
| Non-drinkers (%) | 29 (15.5) | 79 (32.8) |
| Heavy drinkers (%) (> 50 ml per week) | 80 (42.8) | 80 (33.2) |
| Occupation | ||
| Have not worked in risk occupations for lung cancer (%) | 138 (64.5) | 163 (67.7) |
| Have worked more than 1 year in risk occupations for lung cancer (%) | 49 (35.5) | 78 (32.3) |
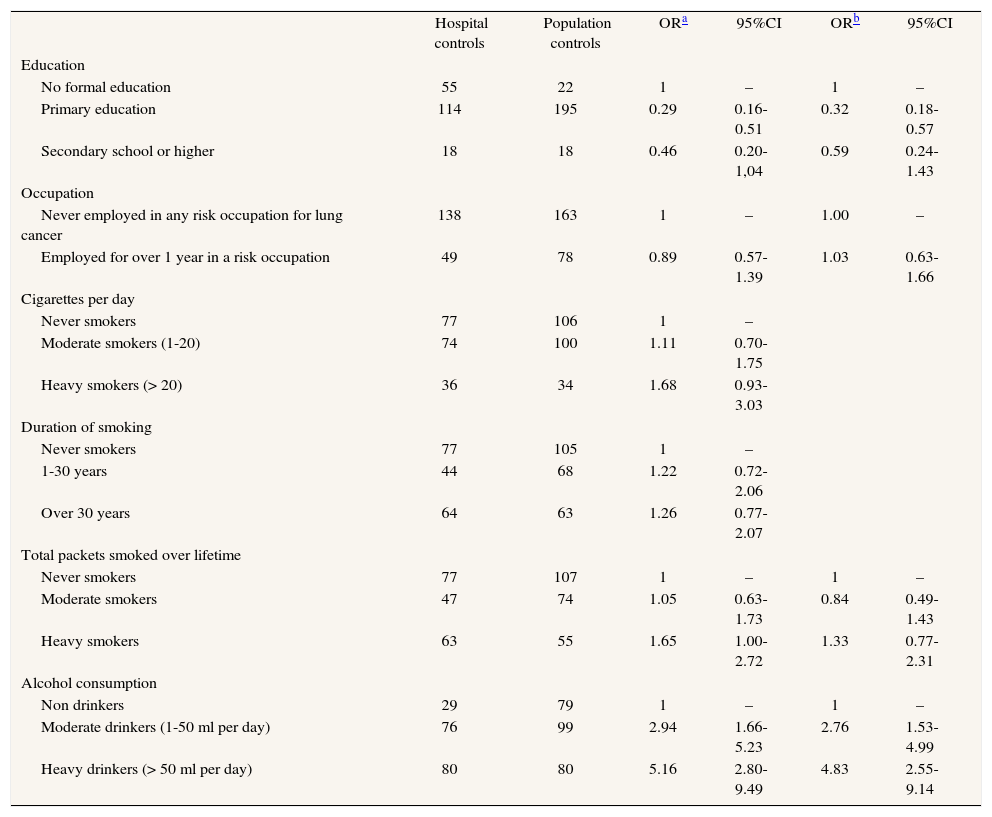
Table 2 shows the probability of being a hospital control versus a population control. No important differen- ces were observed between both in smoking habit and occupational exposure to carcinogens. Important diffe- rences appeared for alcohol consumption. The risk of being a hospital control was 2.76-fold higher for moderate drinkers, rising to 4.83-fold for heavy drinkers, which means that the higher the alcohol consumption, the higher the likelihood of being selected as a hospital control.
Probability of being a hospital control
| Hospital controls | Population controls | ORa | 95%CI | ORb | 95%CI | |
| Education | ||||||
| No formal education | 55 | 22 | 1 | – | 1 | – |
| Primary education | 114 | 195 | 0.29 | 0.16-0.51 | 0.32 | 0.18-0.57 |
| Secondary school or higher | 18 | 18 | 0.46 | 0.20-1,04 | 0.59 | 0.24-1.43 |
| Occupation | ||||||
| Never employed in any risk occupation for lung cancer | 138 | 163 | 1 | – | 1.00 | – |
| Employed for over 1 year in a risk occupation | 49 | 78 | 0.89 | 0.57-1.39 | 1.03 | 0.63-1.66 |
| Cigarettes per day | ||||||
| Never smokers | 77 | 106 | 1 | – | ||
| Moderate smokers (1-20) | 74 | 100 | 1.11 | 0.70-1.75 | ||
| Heavy smokers (> 20) | 36 | 34 | 1.68 | 0.93-3.03 | ||
| Duration of smoking | ||||||
| Never smokers | 77 | 105 | 1 | – | ||
| 1-30 years | 44 | 68 | 1.22 | 0.72-2.06 | ||
| Over 30 years | 64 | 63 | 1.26 | 0.77-2.07 | ||
| Total packets smoked over lifetime | ||||||
| Never smokers | 77 | 107 | 1 | – | 1 | – |
| Moderate smokers | 47 | 74 | 1.05 | 0.63-1.73 | 0.84 | 0.49-1.43 |
| Heavy smokers | 63 | 55 | 1.65 | 1.00-2.72 | 1.33 | 0.77-2.31 |
| Alcohol consumption | ||||||
| Non drinkers | 29 | 79 | 1 | – | 1 | – |
| Moderate drinkers (1-50 ml per day) | 76 | 99 | 2.94 | 1.66-5.23 | 2.76 | 1.53-4.99 |
| Heavy drinkers (> 50 ml per day) | 80 | 80 | 5.16 | 2.80-9.49 | 4.83 | 2.55-9.14 |
OR: odds ratio; CI: confidence interval.
Few studies have compared directly hospital and po- pulation controls, despite the amount of theoretical li- terature on the topic. These results indicate that both control types are comparable in terms of factors viewed as potential confounding variables in many epidemio- logic studies, e.g., educational level, number of cigarettes smoked per day, duration of smoking habit, and even risk occupations for lung cancer. The results also indicate, however, that there are important differences be- tween hospital and population controls regarding alcohol consumption, with hospital controls having a greater likelihood of being drinkers.
The use of population controls is acknowledged as being more appropriate than that of hospital controls for reasons of representativeness. Nevertheless, both have their advantages and their drawbacks. In the study region, public coverage covers approximately 95% of the population. The population controls were randomly selected on the basis of the census. There may be cer- tain differential characteristics between the 5% that makes no use of public health and the remaining 95%, in aspects such as economic level (educational level), tobacco use (the lower classes tend to smoke more than the higher classes), and perhaps employment in occupations posing a risk for lung cancer.
The basic problem of using hospital or population controls is that of comparability. In the present study, both control types were comparable except in alcohol consumption (and educational level). It might be thought that this is due to the medical profiles in res- pect of which hospital controls were selected. How- ever, none of these disorders (inguinal hernia, cataracts and orthopedic surgery in over 95% of controls) is, in principle, associated with alcohol consumption, so that they could not account for the differences observed. Another possible explanation might be non-response or participation bias. In general, participation by hospital controls tends to be higher than that of popula- tion controls. Hospital setting may increase participation, while the fact of being a healthy (and in many cases, a working) person reduces participation among popu- lation controls. Participation among hospital controls was 100%, whereas it was only 61.6% of the population controls. It may be that a higher proportion of heavier drinkers decline to participate among population than among hospital controls, which could account for the results obtained. Insofar as memory bias is concerned, hospital controls are reported to have as much time as cases do to think about the causes of their disease, thus preventing any possible differential information bias6. Drinkers may be more reluctant to participate when they are approached in their home environ- ment or because they are more difficult to locate in this setting.
Our study possesses a series of advantages; the two studies from which the controls were taken were de- signed to study the same disease. Consequently, the questionnaires used were essentially similar. Accordingly, it can be said that, in this particular instance of a case- control study -one in which the «cases» were hospital controls- the principle of comparable measures has been fulfilled7. A further advantage resides in the fact that, from the very outset, both studies were undertaken in the same public health district, a factor that would, a prio- ri, make both groups of controls highly comparable7. This means that the distribution of the different study expo- sures (and of other variables that have not been eva- luated) is exactly the same in the population base from which the two groups of controls were drawn. Both studies used the same inclusion and exclusion criteria (save for exclusion of individuals with previous respiratory di- seases in the population-based study).
The most important limitation is the lower participation of population controls, a finding in line with most previous studies. Controls were not recruited simul- taneously; instead, the population controls were en- rolled from 1992 through 1995, and the hospital controls from 1999 through 2000. We feel, however, that the habits studied hardly varied in the interval betwe- en the two studies.
ConclusionsThe ideal control group rarely exists in epidemio- logic studies. In addition to theoretical work, empirical studies are needed to measure the impact of the dif- ferent biases that can appear, so that these can be pre- vented and corrected. However, even though appropriate selection of controls is problematic, the most serious limitations can be avoided by bearing a series of basic principles in mind8. Hospital controls are usually suit- able where hospital cases are used, but could not re- present the general population. Population controls, though generally preferable for reasons of validity, are expensive and difficult to obtain. Furthermore, for reasons of convenience, there is an important reason for not recruiting population controls, the need to ensure that the information bias that affects cases is similar9. In this study, while the characteristics of population and hospital controls were generally similar, differences were nevertheless observed in respect of alcohol consumption. Further studies are called for to ascertain whether there are differences between population or hospital controls, and for which diseases and popula- tions it would be more appropriate to use one or the other.
Competing interestsThe authors declare no conflict of interests.
FundingThis work has been partly funded by two investigation grants, one from the Fondo de Investigaciones Sanitarias (FIS) (Health Research Fund) (grant FIS 92/0176) and the Galician Regional Health Authority (grant XUGA 91010).


