

To analyze time trends in the prevalence of leisure time (LTPA) and work-related (WRPA) physical activity between 1987 and 2006 in the Spanish working population.
MethodsWe analyzed data taken from the Spanish National Health Surveys for 1987 (n = 29,647), 1993 (n = 20,707), 1995-1997 (n = 12,800), 2001 (n = 21,058), 2003 (n = 21,650), and 2006 (n = 29,478). The main variables were LTPA and WRPA in working adults aged 18-64 years old. We analyzed sociodemographic characteristics, self-perceived health status, lifestyle habits and associated comorbidities using multivariate logistic regression models.
ResultsThe prevalences of LTPA and WRPA were lower in women than in men (p < 0.05). The practice of LTPA (OR: 1.54, 95%CI: 1.32-1.80 for women; OR = 1.15, 95%CI: 1.02-1.31 for men) and WRPA (OR = 1.73, 95%CI: 1.38-2.19 for women; OR = 1.55, 95%CI: 1.44-1.91 for men) significantly increased from 1987 to 2006. In both genders, the variables associated with a higher likelihood of practicing LTPA were greater age, higher educational level and being an ex- or non-smoker, while negative predictors included being married, worse self-perceived health, and obesity. Factors that increased the probability of reporting WRPA were being married, worse self-rated health status, and sleeping > 8h per day. The only factor that reduced the probability of reporting WRPA was being an ex- or non-smoker.
ConclusionsWe found an increase in LTPA and WRPA in the last 20 years in the Spanish working population. Several factors were associated with a higher or lower likelihood of practicing LTPA or WRPA in this population.
Analizar la tendencia en la práctica de actividad física en el tiempo libre (AFTL) y de actividad física en el tiempo de trabajo (AFTT) entre 1987 y 2006 en la población trabajadora española.
MétodosSe analizaron datos procedentes de la Encuesta Nacional de Salud realizada por el Instituto Nacional de Estadística en 1987 (n = 29.647), 1993 (n = 20.707), 1995-1997 (n = 12.800), 2001 (n = 21.058), 2003 (n = 21.650) y 2006 (n = 29.478). Se analizaron la AFTL y la AFTT en la población trabajadora de 18 a 64 años de edad como variables principales. Se investigaron características sociodemográficas, percepción del estado de salud, hábitos de vida y enfermedades asociadas mediante análisis multivariados.
ResultadosLas mujeres mostraron una menor prevalencia de AFTL y AFTT en comparación con los hombres (p <0,05). La práctica de AFTL (odds ratio [OR] = 1,54, intervalo de confianza del 95% [IC95%]: 1,32-1,80 para las mujeres; OR = 1,15, IC95%: 1,02-1,31 para los hombres) y de AFTT (OR = 1,73; IC95%: 1,38-2,19 mujeres; OR = 1,55, IC95%: 1,44-1,91 hombres) aumentó significativamente entre 1987 y 2006. Edad más adulta, nivel educacional más alto y ser ex fumador se asociaron con una mayor práctica de AFTL tanto en hombres como en mujeres, mientras que estar casado, percepción negativa de salud y obesidad se asociaron con una menor práctica de AFTL. Estar casado, percepción negativa de salud y dormir > 8h al día se asociaron a mayor práctica de AFTT, mientras que ser ex fumador se asoció a menor práctica de AFTT.
ConclusionesLa práctica de AFTL y AFTT ha aumentado significativamente en los últimos 20 años en la población trabajadora española. Diferentes factores se asocian a una mayor o menor práctica de AFTL y AFTT en esta población.
Physical activity is reported to play an important role in the prevention of some chronic diseases.1–3 Physical activity is a broad term that encompasses both leisure time activity and activities associated with daily life. Leisure time physical activity (LTPA) refers to recreational exercise or sports that are not related to regular work, housework, or transport activities, while work-related physical activity (WRPA) refers to activities and/or physical demands related to regular work.4 LTPA and WRPA appear to have distinct effects on health. For instance, high physical demands during WRPA are associated with a higher risk of cardiovascular diseases, whereas participating in LTPA is associated with lower risk.5,6 In view of these findings, LTPA and WRPA should be investigated together.
Several studies have analyzed the point prevalence of both LTPA and WRPA in various countries.7–9 While the level of LTPA may have increased in recent years, information on temporal trends at the population level is still sparse. A recent review identified only 25 articles on temporal trends in the adult population.10 Although this review did not identify any studies investigating temporal trends within the national Spanish population, some studies have been conducted in Catalonia, a region in the northeast of Spain.11–13 In addition, a study with data from Madrid has recently been published.14
One study found that WRPA in Catalonia decreased from 1992 to 200311 while another found that Catalonian adults became less inactive during their leisure time from 1993 to 2001;12 however, a third study found that this change was not clearly evident in Cornella, a city of Catalonia.13 Trends in LTPA and WRPA between 1995 and 2008 were recently investigated in the region of Madrid and LPTA was found to have declined, mainly in light and moderate activities, accompanied by greater occupational physical inactivity.14
Information on temporal trends in physical activity can help to identify population subgroups at risk for inactivity, evaluate public health interventions, and develop specific physical activity interventions adapted to each country.15 A national analysis of temporal trends in LTPA and WRPA within Spain is warranted to identify potential factors associated with physical activity in the working population. To the best of the authors’ knowledge, no published study has previously determined time trends in physical activity in the working population within the last 20 years in Spain.
The main objectives of this study were: (i) to describe time trends in the prevalence of LTPA and WRPA among Spanish working adults from 1987 to 2006; and (ii) to determine the association of socio-demographic factors, self-rated health status, comorbidity and lifestyle behaviors with LTPA and WRPA.
MethodsThe Spanish National Health Interview SurveyA repeated cross-sectional study was conducted using individualized data taken from the Spanish National Health Interview Survey (SNHIS) for 1987, 1993, 1995, 1997, 2001, 2003 and 2006. The SNHIS is a home-based, face-to-face interview examining a representative national sample of the non-institutionalized population residing in family dwellings (households) in Spain and is conducted by the Ministry of Health and Consumer Affairs (National Statistics Institute). The SNHIS uses multistage cluster sampling with proportional random selection of primary and secondary sampling units (towns and sections, respectively), with final units (participants) being randomly selected by gender and age. The response rate for all surveys was 65% ± 4% for both men and women, with the highest response rate achieved in the last survey (2006).
Prior to collecting data, surveyors were trained in basic communication skills, survey procedures and questionnaire contents. To meet the survey's stated aim of being able to furnish estimates with a certain degree of reliability at the national and regional levels, the following samples of adults (>18 years) were selected: 29,647 in 1987 (48% men, 52% women), 20,707 in 1993 (49% men, 51% women), 21,067 in 2001 (49% men, 51% women), 21,650 in 2003 (46% men, 54% women), and 29,478 in 2006 (40% men, 60% women). The surveys conducted in 1995 and 1997 were based on smaller sample sizes (N = 6,400) and were therefore analyzed together (N = 12,791; 49% men, 51% women). This study was approved by the human research committee of the (URJC-FUHA) and was conducted following the declaration of Helsinki. Informed consent was signed by all the participants prior to participation in the survey. Details of SNHIS methods have previously been well-described.16,17
For the purpose of this study, we selected all adults aged 18-64 years old who reported being employed (excluding housework) at the time the survey was conducted. The variables included were created on the basis of a series of items in the questionnaires, which were identical in all the SNHIS. The dependent variables were as follows: (i) LTPA, collected using the following question: “Do you practice any physical activity during your leisure time?” with two possible answers: “none” or “once a month or more”; (ii) WRPA, collected using the question: “How would you best describe the physical activity you do at your work site?” with four possible responses: “sitting most of the time”, “standing still most of the time without loading weight”, “walking most of the time and frequently loading weight” or “doing vigorous physical activities”. We considered participants who chose any of the first two answers as “negative WRPA”, and those who chose the last two as “positive WRPA”.
We also analyzed sociodemographic data such as age, marital status (single, married/cohabiting, widowed, divorced), and educational level (no schooling, elementary, high school, college/university). Self-rated health status was assessed by the following question: “How do you perceive your own health status over the last 12 months?” The answer was dichotomized into very good/good or fair/poor/very poor self-rated health.
We also collected the number of physician diagnoses of comorbid chronic conditions, and the number of medications prescribed for any of these conditions as none, one, two, and more than two from participants’ medical histories. Body mass index (BMI) was calculated on the basis of self-reported body weight and height (BMI ≥ 30 obese, BMI = 25-30 overweight, BMI < 25 normal weight). For lifestyle habits, smoking was classified into current smokers, non-smokers and ex-smokers. Finally, sleep habits were divided into participants sleeping ≥ 8hours/day and those sleeping < 8hours/day.
Statistical analysisIn the current study, we analyzed WRPA and LTPA separately for men and women and excluded respondents with missing data for any of these outcomes. We first calculated descriptive measures for all the variables of interest by age group and SNHIS. Secondly, we compared the reported prevalence for the dependent variables and age groups according to the SNHIS. To perform the bivariate comparisons, we used two-sided independent t-tests or ANOVA for continuous variables and chi-square statistics for categorical variables. Thirdly, for each dependent study variable, we fitted logistic regression models for each gender to assess the factors independently associated and the time trend (i.e., by comparing the reported prevalence in 1987 with that in 2006). Models were initially adjusted by age and by those variables that yielded significant associations in the previous bivariate analysis. We then assessed significant interaction terms in fully adjusted models; for significant effects, we stratified the fully adjusted models by the relevant factor. The results of the logistic models are shown as adjusted odds ratios (OR) with 95% confidence intervals (95%CI).
The estimates were made using the “svy” (survey command) functions of the STATA program, which allowed us to incorporate the study design and weights in all the statistical calculations. Survey command includes sampling weights, cluster sampling, and stratification of the data to reduce the possibility of error in the analysis. Statistical significance was established at p < 0.05 (two-tailed p values).
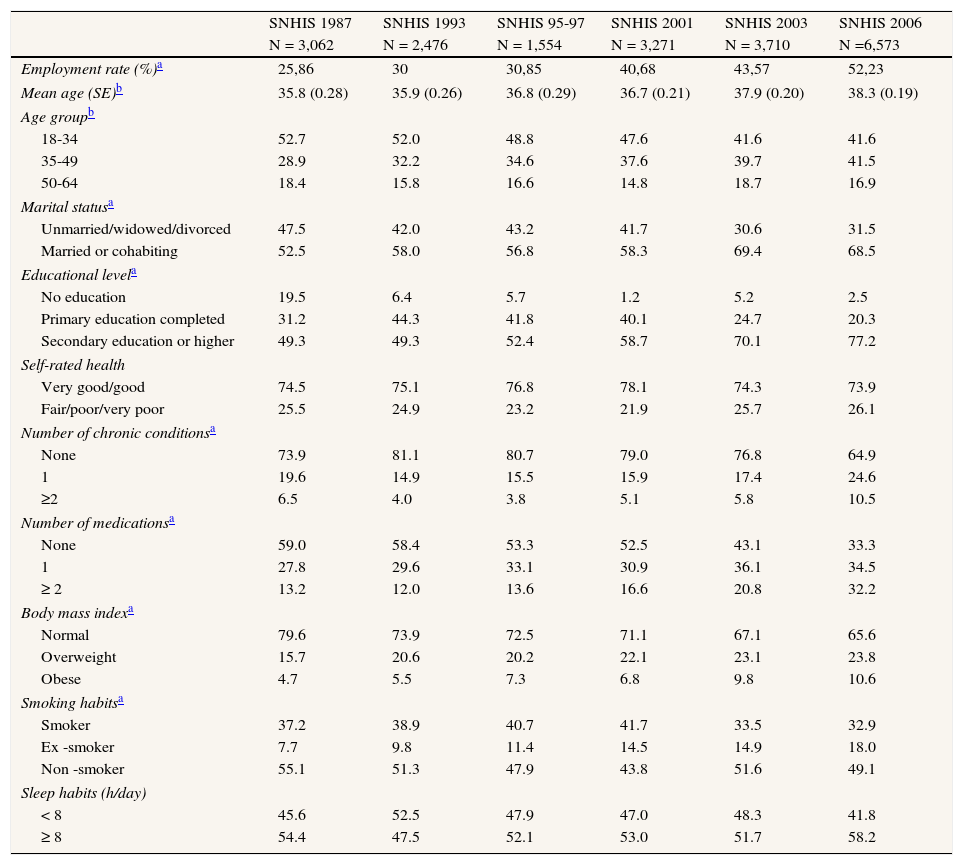
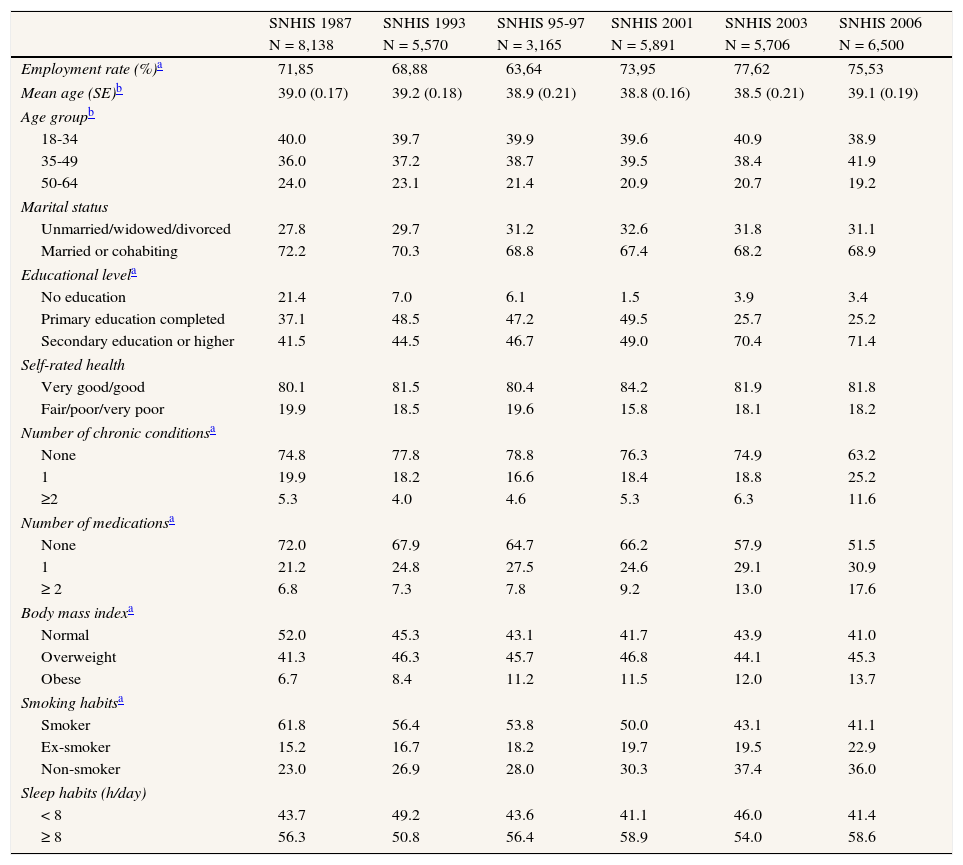
ResultsThe total number of participants aged 18-64 years who reported working at the time of the surveys during the entire period was 57,016 (22,046 women and 34,970 men). The employment rate significantly increased for women from 25.9% in 1987 to 52.2% in 2006 (p <0.001) and only slightly for men (71.8% to 75.3%). The mean age significantly increased from 35.8 to 38.3 years for women (p <0.05) but remained unchanged for men. In all surveys, women were significantly younger than men (p <0.05). The distribution of sociodemographic factors and health-related variables of the participants included according to the SNHIS conducted between 1987 and 2006 is shown in Tables 1 and 2.
Descriptive statistics for working women: Spanish National Health Surveys (SNHIS) 1987, 1993, 1995-97, 2001, 2003 and 2006.
| SNHIS 1987 | SNHIS 1993 | SNHIS 95-97 | SNHIS 2001 | SNHIS 2003 | SNHIS 2006 | |
| N = 3,062 | N = 2,476 | N = 1,554 | N = 3,271 | N = 3,710 | N =6,573 | |
| Employment rate (%)a | 25,86 | 30 | 30,85 | 40,68 | 43,57 | 52,23 |
| Mean age (SE)b | 35.8 (0.28) | 35.9 (0.26) | 36.8 (0.29) | 36.7 (0.21) | 37.9 (0.20) | 38.3 (0.19) |
| Age groupb | ||||||
| 18-34 | 52.7 | 52.0 | 48.8 | 47.6 | 41.6 | 41.6 |
| 35-49 | 28.9 | 32.2 | 34.6 | 37.6 | 39.7 | 41.5 |
| 50-64 | 18.4 | 15.8 | 16.6 | 14.8 | 18.7 | 16.9 |
| Marital statusa | ||||||
| Unmarried/widowed/divorced | 47.5 | 42.0 | 43.2 | 41.7 | 30.6 | 31.5 |
| Married or cohabiting | 52.5 | 58.0 | 56.8 | 58.3 | 69.4 | 68.5 |
| Educational levela | ||||||
| No education | 19.5 | 6.4 | 5.7 | 1.2 | 5.2 | 2.5 |
| Primary education completed | 31.2 | 44.3 | 41.8 | 40.1 | 24.7 | 20.3 |
| Secondary education or higher | 49.3 | 49.3 | 52.4 | 58.7 | 70.1 | 77.2 |
| Self-rated health | ||||||
| Very good/good | 74.5 | 75.1 | 76.8 | 78.1 | 74.3 | 73.9 |
| Fair/poor/very poor | 25.5 | 24.9 | 23.2 | 21.9 | 25.7 | 26.1 |
| Number of chronic conditionsa | ||||||
| None | 73.9 | 81.1 | 80.7 | 79.0 | 76.8 | 64.9 |
| 1 | 19.6 | 14.9 | 15.5 | 15.9 | 17.4 | 24.6 |
| ≥2 | 6.5 | 4.0 | 3.8 | 5.1 | 5.8 | 10.5 |
| Number of medicationsa | ||||||
| None | 59.0 | 58.4 | 53.3 | 52.5 | 43.1 | 33.3 |
| 1 | 27.8 | 29.6 | 33.1 | 30.9 | 36.1 | 34.5 |
| ≥ 2 | 13.2 | 12.0 | 13.6 | 16.6 | 20.8 | 32.2 |
| Body mass indexa | ||||||
| Normal | 79.6 | 73.9 | 72.5 | 71.1 | 67.1 | 65.6 |
| Overweight | 15.7 | 20.6 | 20.2 | 22.1 | 23.1 | 23.8 |
| Obese | 4.7 | 5.5 | 7.3 | 6.8 | 9.8 | 10.6 |
| Smoking habitsa | ||||||
| Smoker | 37.2 | 38.9 | 40.7 | 41.7 | 33.5 | 32.9 |
| Ex -smoker | 7.7 | 9.8 | 11.4 | 14.5 | 14.9 | 18.0 |
| Non -smoker | 55.1 | 51.3 | 47.9 | 43.8 | 51.6 | 49.1 |
| Sleep habits (h/day) | ||||||
| < 8 | 45.6 | 52.5 | 47.9 | 47.0 | 48.3 | 41.8 |
| ≥ 8 | 54.4 | 47.5 | 52.1 | 53.0 | 51.7 | 58.2 |
Descriptive statistics for working men: Spanish National Health Surveys (SNHIS) 1987, 1993, 1995-97, 2001, 2003 and 2006.
| SNHIS 1987 | SNHIS 1993 | SNHIS 95-97 | SNHIS 2001 | SNHIS 2003 | SNHIS 2006 | |
| N = 8,138 | N = 5,570 | N = 3,165 | N = 5,891 | N = 5,706 | N = 6,500 | |
| Employment rate (%)a | 71,85 | 68,88 | 63,64 | 73,95 | 77,62 | 75,53 |
| Mean age (SE)b | 39.0 (0.17) | 39.2 (0.18) | 38.9 (0.21) | 38.8 (0.16) | 38.5 (0.21) | 39.1 (0.19) |
| Age groupb | ||||||
| 18-34 | 40.0 | 39.7 | 39.9 | 39.6 | 40.9 | 38.9 |
| 35-49 | 36.0 | 37.2 | 38.7 | 39.5 | 38.4 | 41.9 |
| 50-64 | 24.0 | 23.1 | 21.4 | 20.9 | 20.7 | 19.2 |
| Marital status | ||||||
| Unmarried/widowed/divorced | 27.8 | 29.7 | 31.2 | 32.6 | 31.8 | 31.1 |
| Married or cohabiting | 72.2 | 70.3 | 68.8 | 67.4 | 68.2 | 68.9 |
| Educational levela | ||||||
| No education | 21.4 | 7.0 | 6.1 | 1.5 | 3.9 | 3.4 |
| Primary education completed | 37.1 | 48.5 | 47.2 | 49.5 | 25.7 | 25.2 |
| Secondary education or higher | 41.5 | 44.5 | 46.7 | 49.0 | 70.4 | 71.4 |
| Self-rated health | ||||||
| Very good/good | 80.1 | 81.5 | 80.4 | 84.2 | 81.9 | 81.8 |
| Fair/poor/very poor | 19.9 | 18.5 | 19.6 | 15.8 | 18.1 | 18.2 |
| Number of chronic conditionsa | ||||||
| None | 74.8 | 77.8 | 78.8 | 76.3 | 74.9 | 63.2 |
| 1 | 19.9 | 18.2 | 16.6 | 18.4 | 18.8 | 25.2 |
| ≥2 | 5.3 | 4.0 | 4.6 | 5.3 | 6.3 | 11.6 |
| Number of medicationsa | ||||||
| None | 72.0 | 67.9 | 64.7 | 66.2 | 57.9 | 51.5 |
| 1 | 21.2 | 24.8 | 27.5 | 24.6 | 29.1 | 30.9 |
| ≥ 2 | 6.8 | 7.3 | 7.8 | 9.2 | 13.0 | 17.6 |
| Body mass indexa | ||||||
| Normal | 52.0 | 45.3 | 43.1 | 41.7 | 43.9 | 41.0 |
| Overweight | 41.3 | 46.3 | 45.7 | 46.8 | 44.1 | 45.3 |
| Obese | 6.7 | 8.4 | 11.2 | 11.5 | 12.0 | 13.7 |
| Smoking habitsa | ||||||
| Smoker | 61.8 | 56.4 | 53.8 | 50.0 | 43.1 | 41.1 |
| Ex-smoker | 15.2 | 16.7 | 18.2 | 19.7 | 19.5 | 22.9 |
| Non-smoker | 23.0 | 26.9 | 28.0 | 30.3 | 37.4 | 36.0 |
| Sleep habits (h/day) | ||||||
| < 8 | 43.7 | 49.2 | 43.6 | 41.1 | 46.0 | 41.4 |
| ≥ 8 | 56.3 | 50.8 | 56.4 | 58.9 | 54.0 | 58.6 |
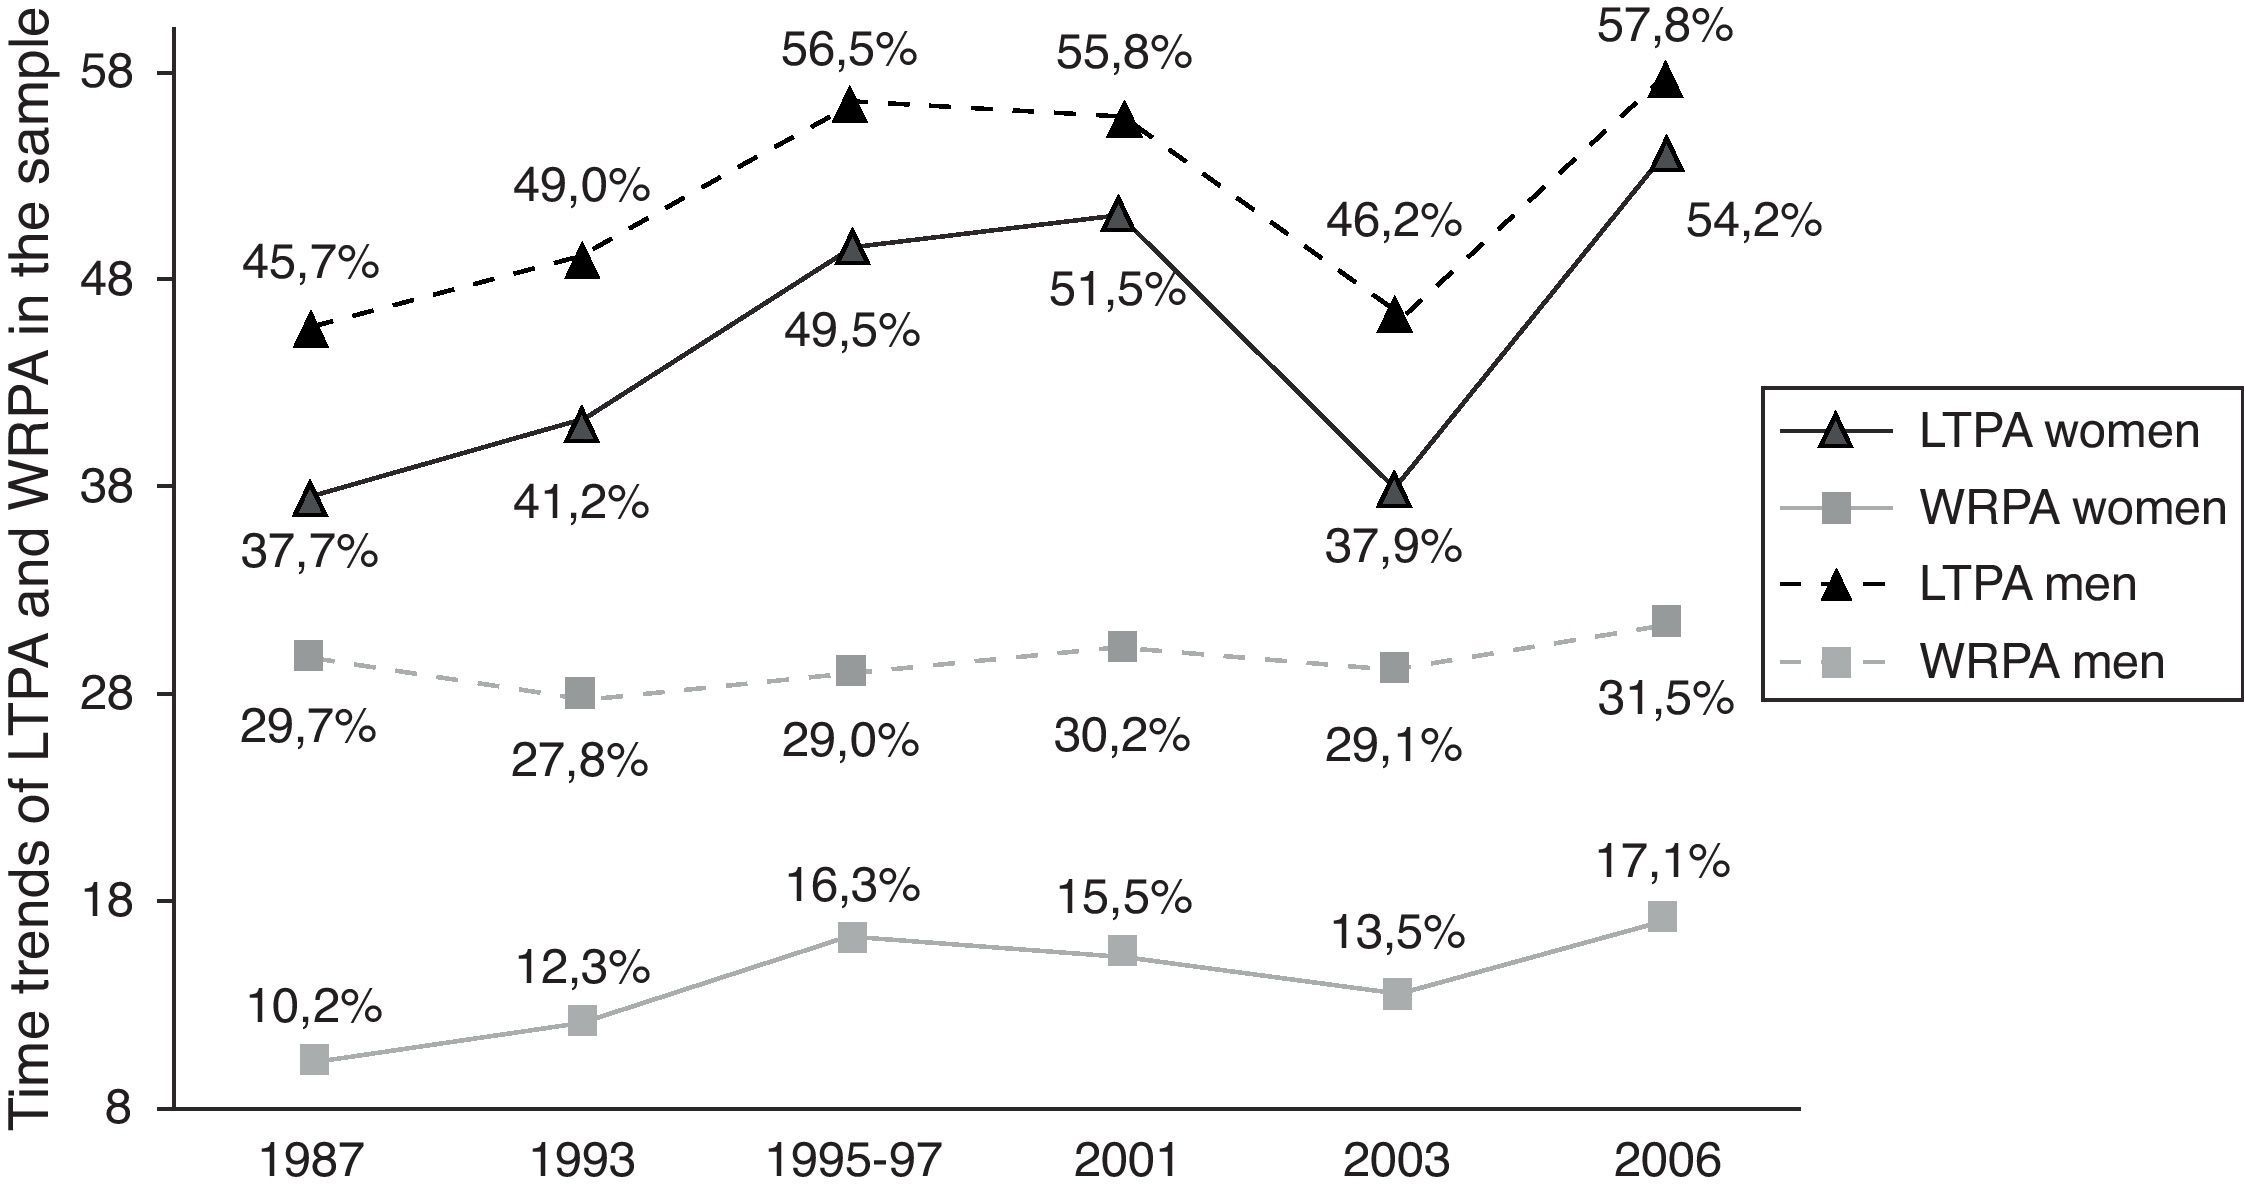
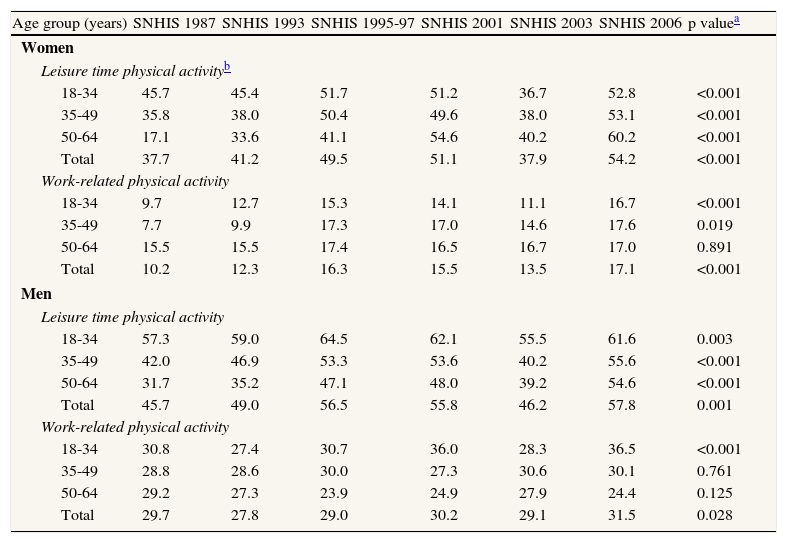
Time trends for LTPA and WRPA by age group and gender are summarized in Table 3. Overall, women showed a lower prevalence of LTPA and WRPA than men (p <0.05, fig. 1). For both genders, the prevalence of all dependent variables was consistently higher in the youngest age group. Crude time trends analysis by age group and gender showed that the prevalence of LTPA increased in all age groups in both genders (p <0.001). Women showed significant increases in LTPA, particularly in the subgroups aged 18-34 and 50-64 years (p <0.001), whereas the increases for men were greater in the youngest group (p <0.001). The highest prevalences of LTPA and WRPA were found in the 2006 SNHIS for both genders, with values of 54.2% and 17.1% for women, and 57.8% and 31.5% for men, respectively (fig. 1).
Time trends by sex and age group among Spanish National Health Interview Surveys (SNHIS) in 1987, 1993, 1995-97, 2001, 2003 and 2006 in the prevalence of leisure time physical activity and work/related physical activity among the working population.
| Age group (years) | SNHIS 1987 | SNHIS 1993 | SNHIS 1995-97 | SNHIS 2001 | SNHIS 2003 | SNHIS 2006 | p valuea |
| Women | |||||||
| Leisure time physical activityb | |||||||
| 18-34 | 45.7 | 45.4 | 51.7 | 51.2 | 36.7 | 52.8 | <0.001 |
| 35-49 | 35.8 | 38.0 | 50.4 | 49.6 | 38.0 | 53.1 | <0.001 |
| 50-64 | 17.1 | 33.6 | 41.1 | 54.6 | 40.2 | 60.2 | <0.001 |
| Total | 37.7 | 41.2 | 49.5 | 51.1 | 37.9 | 54.2 | <0.001 |
| Work-related physical activity | |||||||
| 18-34 | 9.7 | 12.7 | 15.3 | 14.1 | 11.1 | 16.7 | <0.001 |
| 35-49 | 7.7 | 9.9 | 17.3 | 17.0 | 14.6 | 17.6 | 0.019 |
| 50-64 | 15.5 | 15.5 | 17.4 | 16.5 | 16.7 | 17.0 | 0.891 |
| Total | 10.2 | 12.3 | 16.3 | 15.5 | 13.5 | 17.1 | <0.001 |
| Men | |||||||
| Leisure time physical activity | |||||||
| 18-34 | 57.3 | 59.0 | 64.5 | 62.1 | 55.5 | 61.6 | 0.003 |
| 35-49 | 42.0 | 46.9 | 53.3 | 53.6 | 40.2 | 55.6 | <0.001 |
| 50-64 | 31.7 | 35.2 | 47.1 | 48.0 | 39.2 | 54.6 | <0.001 |
| Total | 45.7 | 49.0 | 56.5 | 55.8 | 46.2 | 57.8 | 0.001 |
| Work-related physical activity | |||||||
| 18-34 | 30.8 | 27.4 | 30.7 | 36.0 | 28.3 | 36.5 | <0.001 |
| 35-49 | 28.8 | 28.6 | 30.0 | 27.3 | 30.6 | 30.1 | 0.761 |
| 50-64 | 29.2 | 27.3 | 23.9 | 24.9 | 27.9 | 24.4 | 0.125 |
| Total | 29.7 | 27.8 | 29.0 | 30.2 | 29.1 | 31.5 | 0.028 |
 and work-related physical activity (WRPA). Values are from the Spanish National Health Interview Survey and are expressed as percentages.")
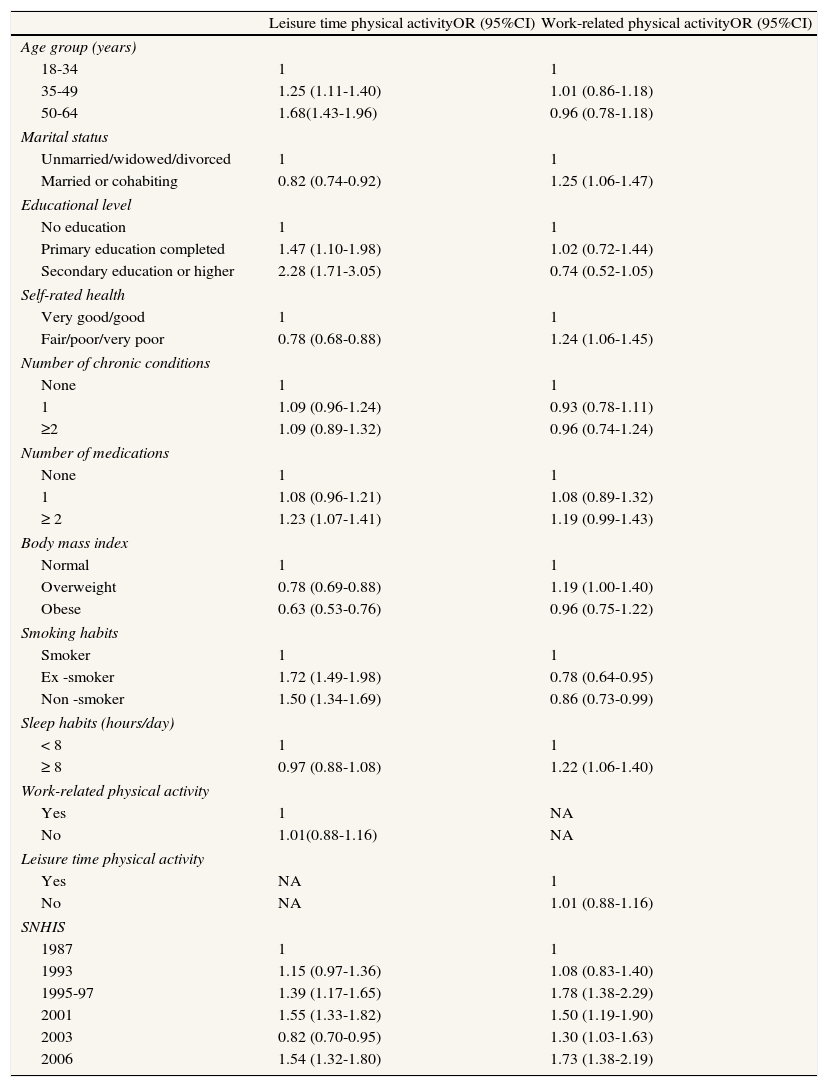
The multivariate analysis for women revealed that LTPA significantly increased from 1987 to 2006 (adjusted OR = 1.54; 95%CI: 1.32-1.80). The trends for WRPA also significantly increased (OR = 1.73; 95%CI: 1.38-2.19) in women. The results of the multivariate analysis to estimate trends and associated factors in women are shown in Table 4. The variables significantly associated with a higher likelihood of reporting LTPA among women were greater age, higher educational level and being an ex- or non-smoker. The factors associated with lower LTPA were being married, having worse self-perceived health, and obesity. The factors associated with higher reporting of WRPA included being married, having worse self-rated health status, and sleep ≥ 8hours/day, whereas the only factor that reduced the probability of reporting WRPA was being an ex- or non-smoker (Table 4).
Logistic regression models for working women. Results for leisure time physical activity and work-related physical activity adjusted by sociodemographic characteristics, health status, health behaviors and time trends. Data from the Spanish National Health Interview Survey, 1987-2006.
| Leisure time physical activityOR (95%CI) | Work-related physical activityOR (95%CI) | |
| Age group (years) | ||
| 18-34 | 1 | 1 |
| 35-49 | 1.25 (1.11-1.40) | 1.01 (0.86-1.18) |
| 50-64 | 1.68(1.43-1.96) | 0.96 (0.78-1.18) |
| Marital status | ||
| Unmarried/widowed/divorced | 1 | 1 |
| Married or cohabiting | 0.82 (0.74-0.92) | 1.25 (1.06-1.47) |
| Educational level | ||
| No education | 1 | 1 |
| Primary education completed | 1.47 (1.10-1.98) | 1.02 (0.72-1.44) |
| Secondary education or higher | 2.28 (1.71-3.05) | 0.74 (0.52-1.05) |
| Self-rated health | ||
| Very good/good | 1 | 1 |
| Fair/poor/very poor | 0.78 (0.68-0.88) | 1.24 (1.06-1.45) |
| Number of chronic conditions | ||
| None | 1 | 1 |
| 1 | 1.09 (0.96-1.24) | 0.93 (0.78-1.11) |
| ≥2 | 1.09 (0.89-1.32) | 0.96 (0.74-1.24) |
| Number of medications | ||
| None | 1 | 1 |
| 1 | 1.08 (0.96-1.21) | 1.08 (0.89-1.32) |
| ≥ 2 | 1.23 (1.07-1.41) | 1.19 (0.99-1.43) |
| Body mass index | ||
| Normal | 1 | 1 |
| Overweight | 0.78 (0.69-0.88) | 1.19 (1.00-1.40) |
| Obese | 0.63 (0.53-0.76) | 0.96 (0.75-1.22) |
| Smoking habits | ||
| Smoker | 1 | 1 |
| Ex -smoker | 1.72 (1.49-1.98) | 0.78 (0.64-0.95) |
| Non -smoker | 1.50 (1.34-1.69) | 0.86 (0.73-0.99) |
| Sleep habits (hours/day) | ||
| < 8 | 1 | 1 |
| ≥ 8 | 0.97 (0.88-1.08) | 1.22 (1.06-1.40) |
| Work-related physical activity | ||
| Yes | 1 | NA |
| No | 1.01(0.88-1.16) | NA |
| Leisure time physical activity | ||
| Yes | NA | 1 |
| No | NA | 1.01 (0.88-1.16) |
| SNHIS | ||
| 1987 | 1 | 1 |
| 1993 | 1.15 (0.97-1.36) | 1.08 (0.83-1.40) |
| 1995-97 | 1.39 (1.17-1.65) | 1.78 (1.38-2.29) |
| 2001 | 1.55 (1.33-1.82) | 1.50 (1.19-1.90) |
| 2003 | 0.82 (0.70-0.95) | 1.30 (1.03-1.63) |
| 2006 | 1.54 (1.32-1.80) | 1.73 (1.38-2.19) |
NA: not applicable.
The results of the logistic models are shown as adjusted odds ratios (OR) with 95% confidence intervals (95%CI). Models adjusted by all variables shown in the table include all the information from 1987 to 2006 regardless of the year in which the survey was performed.
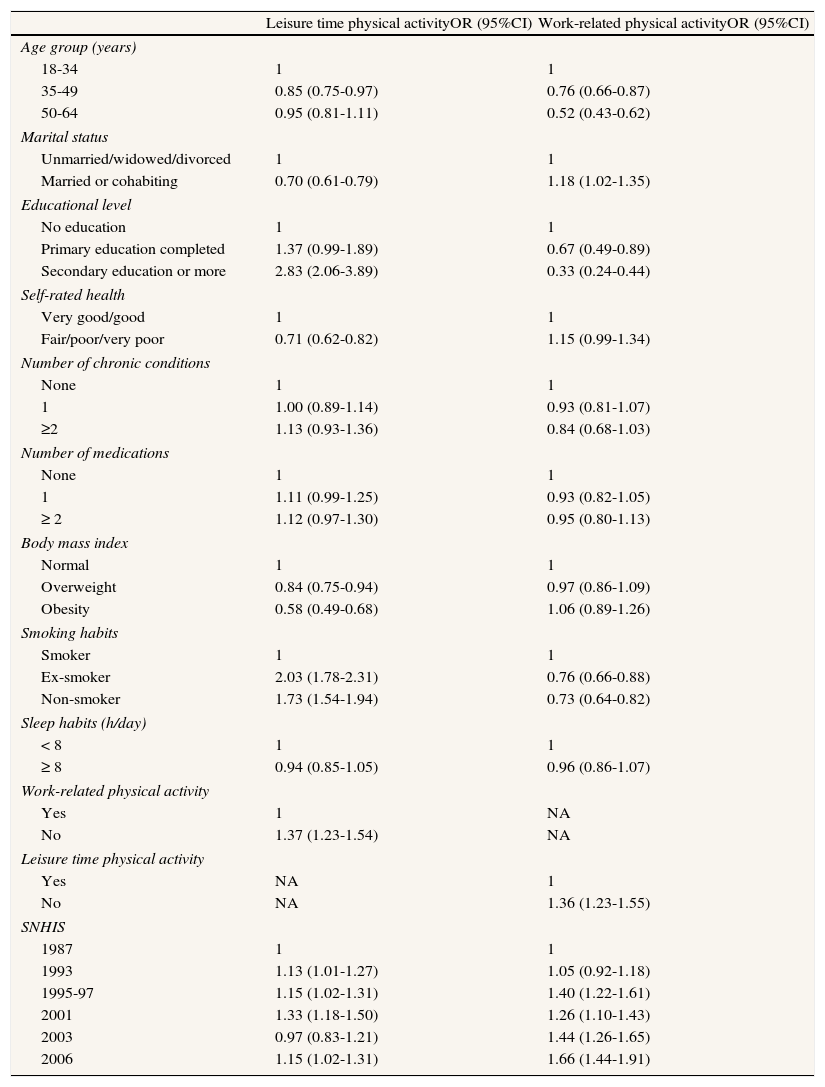
Among men, LTPA and WRPA also increased significantly from 1987 to 2006 (OR = 1.15, 95%CI: 1.02-1.31, and OR = 1.55, 95%CI: 1.44-1.91). The multivariate analysis to estimate time trends and associated factors in working men is shown in Table 5. The factors associated with higher and lower levels of LTPA were the same as for women, with the following exception: among working men, the lowest probability of reporting LTPA was found in the group aged 35-49 years, whereas not reporting WRPA increased the probability of practicing LTPA at a rate of 37%. The factors associated with lower WRPA in men were greater age, higher educational level, and being an ex- or non-smoker, whereas being married or not taking any LTPA increased the probability of reporting WRPA (Table 5).
Logistic regression models for working men. Results for leisure time physical activity and work-related physical activity adjusted by socio-demographic characteristics, health status, health behaviors and time trends. Data from the Spanish National Health Interview Survey, 1987-2006.
| Leisure time physical activityOR (95%CI) | Work-related physical activityOR (95%CI) | |
| Age group (years) | ||
| 18-34 | 1 | 1 |
| 35-49 | 0.85 (0.75-0.97) | 0.76 (0.66-0.87) |
| 50-64 | 0.95 (0.81-1.11) | 0.52 (0.43-0.62) |
| Marital status | ||
| Unmarried/widowed/divorced | 1 | 1 |
| Married or cohabiting | 0.70 (0.61-0.79) | 1.18 (1.02-1.35) |
| Educational level | ||
| No education | 1 | 1 |
| Primary education completed | 1.37 (0.99-1.89) | 0.67 (0.49-0.89) |
| Secondary education or more | 2.83 (2.06-3.89) | 0.33 (0.24-0.44) |
| Self-rated health | ||
| Very good/good | 1 | 1 |
| Fair/poor/very poor | 0.71 (0.62-0.82) | 1.15 (0.99-1.34) |
| Number of chronic conditions | ||
| None | 1 | 1 |
| 1 | 1.00 (0.89-1.14) | 0.93 (0.81-1.07) |
| ≥2 | 1.13 (0.93-1.36) | 0.84 (0.68-1.03) |
| Number of medications | ||
| None | 1 | 1 |
| 1 | 1.11 (0.99-1.25) | 0.93 (0.82-1.05) |
| ≥ 2 | 1.12 (0.97-1.30) | 0.95 (0.80-1.13) |
| Body mass index | ||
| Normal | 1 | 1 |
| Overweight | 0.84 (0.75-0.94) | 0.97 (0.86-1.09) |
| Obesity | 0.58 (0.49-0.68) | 1.06 (0.89-1.26) |
| Smoking habits | ||
| Smoker | 1 | 1 |
| Ex-smoker | 2.03 (1.78-2.31) | 0.76 (0.66-0.88) |
| Non-smoker | 1.73 (1.54-1.94) | 0.73 (0.64-0.82) |
| Sleep habits (h/day) | ||
| < 8 | 1 | 1 |
| ≥ 8 | 0.94 (0.85-1.05) | 0.96 (0.86-1.07) |
| Work-related physical activity | ||
| Yes | 1 | NA |
| No | 1.37 (1.23-1.54) | NA |
| Leisure time physical activity | ||
| Yes | NA | 1 |
| No | NA | 1.36 (1.23-1.55) |
| SNHIS | ||
| 1987 | 1 | 1 |
| 1993 | 1.13 (1.01-1.27) | 1.05 (0.92-1.18) |
| 1995-97 | 1.15 (1.02-1.31) | 1.40 (1.22-1.61) |
| 2001 | 1.33 (1.18-1.50) | 1.26 (1.10-1.43) |
| 2003 | 0.97 (0.83-1.21) | 1.44 (1.26-1.65) |
| 2006 | 1.15 (1.02-1.31) | 1.66 (1.44-1.91) |
NA: not applicable.
The results of the logistic models are shown as adjusted odds ratios (OR) with 95% confidence intervals (95%CI). The models adjusted by all the variables shown in the table include all the information from 1987 to 2006 regardless of the year in which survey was performed.
This study found an increase in LTPA and WRPA over the last two decades (1987-2006) among the Spanish working population. Younger age, higher educational level, and being a non-smoker were associated with a higher likelihood of reporting LTPA, whereas being married, having worse self-perceived health status, and sleeping ≥ 8hours/day were associated with an increased probability of reporting WRPA. In contrast, being married, worse self-perceived health, and obesity were associated with lower LTPA, while being an ex- or non-smoker was associated with a reduced probability of reporting WRPA.
This is the first study to include national data over a 20-year period from the Spanish working population, as previous studies have been conducted in Catalonia11–13 or Madrid.14 We found an increase in LTPA over the last two decades in the Spanish working population, which concurs with studies from Canada,18 Sweden,19 England,20 USA,21 Finland,22 and Denmark,23 where an increase in LTPA over the last 15 years has also been found.
Analyzing data from the Behavioral Risk Factor Surveillance System from 1994 to 2004, the Centers for Disease Control reported that the prevalence of LTPA increased from 1994 to 2007.24 A systematic review including 25 studies on temporal trends among adults found that 17 studies (68%) detected that physical activity levels increased over time, three (12%) concluded that physical activity decreased, and the remaining five (20%) reported unchanged physical activity levels.9 A recent study conducted in Madrid found decreased LTPA; however, the data were collected from an urban, not a national, population.14 Comparisons across studies is challenging as the definitions of LTPA vary considerably, ranging from physical activity data based on questionnaires to physical fitness data based on aerobic tests.10 In addition, our study focused on LTPA and WRPA in the working population, whereas most studies have been performed in the general population.
In their review, Knuth and Hallal10 found that although LTPA increased, WRPA seemed to decrease. A study conducted in Finland showed an increase in LTPA and a decrease in WRPA.22 Furthermore, two previous studies conducted in Catalonia also reported a decrease in WRPA11 and an increase in LTPA12 from 1993 to 2001. These results conflict with those of the present study, as we also found an increase in WRPA in Spanish adults. These differences may be explained by the inclusion of only working people in this study. In any country, historical, cultural, and social factors may influence the prevalence of physical activity.25 In addition, because a self-reported measure of LTPA was used in our surveys, social desirability may have affected the participants’ attitudes due to an increased focus on physical activity in society over time.In agreement with other studies,20,26 the present study also found that women had a lower prevalence of LTPA and WRPA than men. Similar to our findings, gender differences in LTPA have been reported by Cornelio et al.13 One reason why women might report less LTPA than men could be a lower adherence to exercise.27
We found that younger age, higher educational level, and being an ex- or non-smokers were associated with a higher likelihood of practicing LTPA, a finding that concurs with prior research.19,22,28–30 Younger, non-smoking people can be expected to participate more in LTPA. Additionally, being married, having worse self-perceived health, and obesity were associated with a lower likelihood of LTPA. Self-reported health status has been found to be a good predictor of physical activity,31 and poor self-rated health is associated with lower physical activity.32
Interestingly, we found that worse self-perceived health status was associated with lower participation in LTPA but with higher participation in WRPA. One explanation may be that both people with no time to participate in physical activity during their leisure time may and those with higher physical activity demands at work might perceive their health as worse. This finding was more evident in men, because not participating in LTPA increased the probability of reporting WRPA, and could be expected as individuals with higher levels of WRPA may have less time or may be too tired after work to participate in LTPA. Additionally, persons included in the surveys may have been a selected population with higher demands at work.
Finally, being married, worse self-rated health status, and sleep ≥ 8hours/day were associated with increased WRPA, whereas older age, higher educational level, and being an ex- or non-smoker were associated with a lower probability of reporting WRPA. Our results are in agreement with those of previous studies that found that education was the most important determinant of WRPA, with higher rates of WRPA among persons with less education.33–35 Artazcoz et al36 found that higher WRPA was associated with being married, poor health status and lack of participation in LTPA.
In a European study, Vaz de Almeida et al37 identified the following risk groups for physical inactivity: women, persons with lower education, older people, and the overweight or obese. Therefore, programs to promote physical activity should focus on and adapt to the different groups identified in each country in order to increase participation and to maintain participation in those already engaged in activities.
The strengths of this study include its large sample size, a randomly selected population, use of a standardized survey (SNHIS) spanning 20 years, and pre-training of data collectors. However, this study also presents some limitations. Firstly, we used a self-reported measure of LTPA and WRPA and there was potential for recall and respondent bias when answering the questions. In addition, the validity of the questions included in the surveys related to LTPA and WRPA has not been analyzed, which limits the results of the study. The use of objective measures of LTPA and WRPA can complement self-reported measurements to avoid bias (i.e., quantification of physical activity levels by calculating MET); however, this is not generally feasible in large-scale population-based surveys due to extensive costs. Additionally, objective measurements for assessing physical activity only began to used fairly recently and obtaining data covering a time span of 20 years is difficult. In this scenario, questionnaires remain the most cost-effective methods for assessing physical activity in large-scale population-based studies. Even though individuals tend to overestimate their possible participation in exercise and underestimate sedentary behaviors, questionnaires are extremely useful for assessing patterns, frequency and time trends.38 Indeed, the use of the same national population-based survey for 20 years supports the generalization of our results because this survey allows representative population-based sample sizes to be included. Nevertheless, the use of self-reported questions on physical activity in the current study remains a drawback.
Despite these limitations, our findings provide additional insight into demographic aspects of LTPA and WRTA in Spanish working adults, for which there is little information nationwide. Therefore the data found in the current study constitute a valuable tool for examining trends in the Spanish working population and the effectiveness of campaigns to promote physical activity among this population, although caution should be exercised at this stage. Future studies that investigate the possible reasons why people do not practice physical activity, whether LTPA or WRPA, are required. Indeed, analysis of preferred activities could aid the promotion of physical activity in the working and general populations. We suggest that future surveys should include these questions to improve the information on LTPA and WRPA with the aim of enhancing healthcare promotion services.
In conclusion, we found an increase in LTPA and WRPA over the last two decades among the Spanish working population. Distinct factors were associated with a higher or lower likelihood of practicing LTPA and/or WRPA in women and men. Identifying these factors may lead to improvements in targeting at-risk groups, which could in turn reduce the prevalence of inactivity in this population.
Analysis of trends in physical activity allows risk factors for inactivity to be identified. In the last few years, trends in leisure time physical activity have been analyzed in several countries, showing a clear increasing trend, but no studies have been performed in Spain. Consequently, trends in the active population in Spain should be determined.
What does the study add to the literature?This is the first epidemiological study to analyze trends in leisure-time and work-related physical activity in the last few years. Both types of physical activity significantly increased from 1987 to 2006 in the Spanish population. Identifying the factors associated with a higher or lower likelihood of partaking in physical activity is clearly relevant for future preventive and health promotion programs.
All the authors contributed equally to the conception and design of the study, analysis and interpretation of the data, and drafting and critical review of the manuscript. All the authors have approved the final version for publication.
FundingNone.
Conflict of interestsNone.


