

To analyze whether for an equal health problem there are gender differences in the drugs used in an adult population attended in the Health Care Centers of the Valencian Community (Spain).
MethodsA cross-sectional analytical study was carried out between February-August 1997. The independent variables were: socio-economic parameters, frequency of visits, and self-perceived or diagnosed health problems, and the dependent one the number of drugs consumed.
ResultsOf the 812 patients considered, 801 consumed medication. Eighty percent of the health problems for which drugs were used involved 5 apparatuses and systems (mean: 3.3 health problems/patient). The 5 most consumed therapeutic groups accounted for 81% of the total (mean: 4.5 drugs/patient). Significant differences were recorded, with greater female consumption in the central nervous system and genitourinary tract therapeutic groups, and with greater male consumption in relation to the respiratory system and systemic anti-infectious therapy. Drug use increased with age, lowest educational level, lowest professional categories, and with the highest frequency of visits to the physician. Significant differences were also recorded in drug use by occupational status, marital status and family structure. The multivariate analysis showed the number of health problems and the frequency of visits accounted for 82.2% of the variability of the variable «number of drugs consumed». The variability accounted for by gender was explained by the variable health problems, the main factor underlying drug consumption among women and men.
ConclusionThe main finding is probably that women do not use larger numbers of drugs than men if health problems and frequency of visits are controlled.
Analizar si para el mismo problema de salud hay diferencias de género en los medicamentos utilizados en una población adulta atendida en centros de salud de la Comunidad Valenciana.
MétodosEstudio observacional transversal analítico realizado entre febrero y agosto de 1997. Variables independientes: parámetros socioeconómicos, frecuentación de los servicios de salud y problemas de salud autopercibidos o diagnosticados. Variable independiente: número de medicamentos consumidos.
ResultadosDe los 812 pacientes, 801 tomaban medicamentos. El 80% de los problemas de salud por los que se medicaban pertenece a 5 aparatos y sistemas (media: 3,3 problemas de salud por paciente). Los 5 grupos terapéuticos más consumidos suponen el 81% del total (media: 4,5 medicamentos por paciente). Se evidenció un mayor consumo significativo por la mujer de medicamentos de los grupos terapéuticos del sistema nervioso central e infecciones genitourinarias, y mayor consumo por los varones de medicamentos de los grupos terapéuticos del sistema respiratorio y terapia antiinfecciosa sistémica. El uso de los medicamentos incrementó con la edad, el menor nivel educativo, menor categoría profesional y con la mayor frecuencia de visitas. También se encontraron diferencias significativas en el uso de medicamentos según la situación laboral, estado marital y la estructura familiar. El análisis multivariante mostró que el número de problemas de salud y la frecuencia de visitas explicaban el 82,2% de la variabilidad de la variable «número de medicamentos consumidos ». La variabilidad representada por el género se explicó por la variable de problemas de salud, el principal factor subyacente del consumo de medicamentos entre mujeres y hombres.
ConclusionesEl hallazgo principal es, probablemente, que las mujeres no utilizan mayor número de medicamentos que los hombres al ajustar por problemas de salud y la frecuencia de las visitas.
Several studies have associated the female gender with increased drug consumption. Poorer selfperceived health, self-medication practices and a greater use of the available health services on the part of women have been some of the causes suggested to explain the differences found. The increased consumption of medication has also been related to educational level, occupational and marital status, and health problems1-10.
One of the foremost aims of the World Health Organization (WHO) has been to reduce health inequalities among different social groups 25% by the year 2000. In this context, the WHO considers health care itself, among other causes, as one of the factors favoring inequalities in terms of health11,12. Under conditions of equal patient demands or complaints, such inequalities can manifest as differences in access to health care, variable diagnostic and/or treatment efforts or access to the benefits afforded by technological advances, which are fundamentally concentrated in hospitals13-15. Such differences in relation to patient gender would be the consequence of what Dreachslin16 has termed «patient gender bias», and Healy17 described as the «Yentl syndrome», in reference to the presumed need for women to disguise themselves as males to secure the same quality access to health care as males.
The increased accessibility, the high frequency of consultations for banal problems, and other characteristics typical of the primary care setting could lead to increased utilization of the first level of health care by women, and to an increased tendency towards symptomatic pharmacological treatment. It has also been suggested that professionals may be more prone to prescribe medication to women than to men for the same health problems14,18.
In a previous paper, we suggested the influence of gender upon the quality of medicine, by pointing to the greater likelihood for women between 45 and 64 years of age to take lower quality medication. In addition, it showed the effect of where the prescription was issued and of health problems in explaining this difference in consumption19.
The aim of the present study is to analyze whether for an equal health problem there are gender differences in the profile of drugs used in an adult population attended in a primary care setting.
MethodsA cross-sectional analytical study was made involving patients selected for an evaluation of the quality of drug use, taking into consideration the percentage distribution of the population in the three provinces that conform the Valencian Community (Spain) (total population: approximately four million), between February and August 1997.
The selection of Health Care Centers was made taking into account their accessibility, feasibility and geographical distribution. Thirteen primary care centers were included, pertaining to 11 health areas, with an approximate population of 274,000 inhabitants; of these, 98.5% belonged to urban nuclei. The patients were recruited by consecutive sampling of both sexes equally when visiting the Health Care Center. A total of 431 individuals of each sex was calculated for the comparison of proportions to detect a difference of ≥ 10% (α = 0.05, β = 0.20 in bilateral contrasting, estimating a loss rate of 10%). This size suffices to detect a difference in the number of drugs between sexes of 0.65 or higher, assuming a standard deviation (SD) of 3, a risk α = 0.05, β = 0.20, and a loss rate of 10%.
The inclusion criteria were patient age over 14 years and the obtainment of informed consent. The exclusion criterion was the presence of cognitive impairment not allowing a normal patient interview.
The following data sources were used: a structured questionnaire in which the items explored socioeconomic aspects, the frequency of health care visits (measured in terms of the time elapsed since the last visit to the family physician: never before; more than 12 months before; between 2 and 12 months before; in the last 2 months), information on drugs used at the time of the visit (both prescribed medication and self-medication), linked to the indication for which the drugs were used. For this latter purpose data were collected on the use of drugs for health related problems at the time of the visit (structured according to the common disorders self-perceived by the population, and according to pharmaceutical forms)20. The drugs recorded (including prescribed medication and self-medication) were grouped according to the International Anatomical Classification of the Pharmaceutical Specialities Catalogue21, considering any pharmaceutical specialities not contemplated in the catalogue as representing non-catalogued medication. Data collection was carried out by three interviewers. Patients were aware that this questionnaire formed part of research work, but as a study on the use of medication and traffic accidents.
Data were completed and confirmed using medical records and the long-term treatment card, this being a document widely used in Spanish primary care, reflecting the medication authorized for prolonged treatment (i.e., with a duration of more than one month) in patients with chronic illnesses. In order to assess the reliability of the questionnaire, an analysis was made of 30 surveys involving the same users with a separating interval of two weeks; the general concordance index (po) was 96.7%.
The descriptive analysis was based on the chi-square test for the comparison of proportions, while the Student t-test and analysis of variance (ANOVA) were used for the comparison of means. The main results are specified with the corresponding 95% confidence intervals (95%CI). A multivariate analysis involving multiple linear regression was made to investigate the effect of gender upon the number of drugs, and to control for the behavior of the rest of variables as confounding factors; the variables included were grouped in accordance to the results of the stratified analysis. The interaction term «number of health problems * gender» was controlled for. An analysis was made of the application postulates of the multiple linear regression model, i.e., goodness of fit and the presence of outliers. Emphasis of choice was placed on the model that yielded the most precise estimation of the association – stressing validness over precision. Two models were generated: Model 1 comprising all the predictive variables and the interaction term «number of health problems * gender», the latter term being excluded from the model due to a lack of significance in the chunk test. In turn, Model 2 comprised the significant predictive variables number of health problems and frequency of visits.
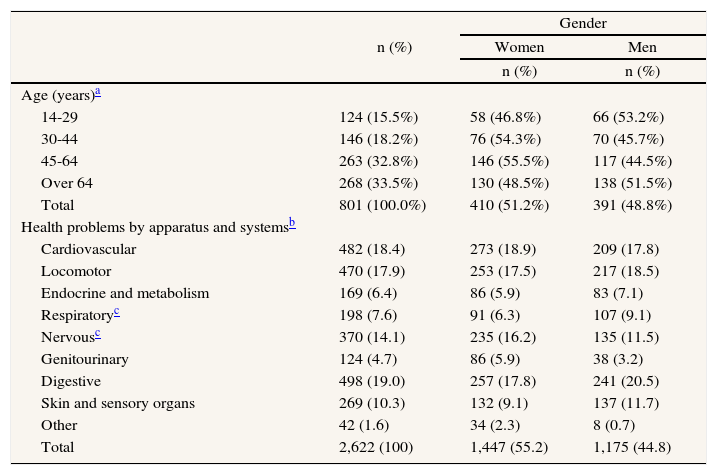
ResultsOf the 862 questionnaires, 50 (5.8%) were excluded on the grounds that they were illegible and/or incomplete. The loss rate was therefore lower than expected (10%). Nobody refused to particípate in the study. A total of 812 patients were finally included in the study; of these, 801 (98.6%) were taking medication. Table 1 shows the age and gender characteristics of these patients.
Patient distribution by age health and gender
| n (%) | Gender | ||
| Women | Men | ||
| n (%) | n (%) | ||
| Age (years)a | |||
| 14-29 | 124 (15.5%) | 58 (46.8%) | 66 (53.2%) |
| 30-44 | 146 (18.2%) | 76 (54.3%) | 70 (45.7%) |
| 45-64 | 263 (32.8%) | 146 (55.5%) | 117 (44.5%) |
| Over 64 | 268 (33.5%) | 130 (48.5%) | 138 (51.5%) |
| Total | 801 (100.0%) | 410 (51.2%) | 391 (48.8%) |
| Health problems by apparatus and systemsb | |||
| Cardiovascular | 482 (18.4) | 273 (18.9) | 209 (17.8) |
| Locomotor | 470 (17.9) | 253 (17.5) | 217 (18.5) |
| Endocrine and metabolism | 169 (6.4) | 86 (5.9) | 83 (7.1) |
| Respiratoryc | 198 (7.6) | 91 (6.3) | 107 (9.1) |
| Nervousc | 370 (14.1) | 235 (16.2) | 135 (11.5) |
| Genitourinary | 124 (4.7) | 86 (5.9) | 38 (3.2) |
| Digestive | 498 (19.0) | 257 (17.8) | 241 (20.5) |
| Skin and sensory organs | 269 (10.3) | 132 (9.1) | 137 (11.7) |
| Other | 42 (1.6) | 34 (2.3) | 8 (0.7) |
| Total | 2,622 (100) | 1,447 (55.2) | 1,175 (44.8) |
The 801 patients referred a total of 2.622 health problems, with an average of 3.27 (SD 2.22) problems per patient. Females reported 1447 (55.2%) health problems, versus 1.175 among the men. The analysis revealed significant differences in terms of gender (p < 0.001), with a female predominance in pathology of the nervous system and genitourinary tract. A non-significant male predominance in respiratory, skin and sensory organ diseases was observed (table 1).
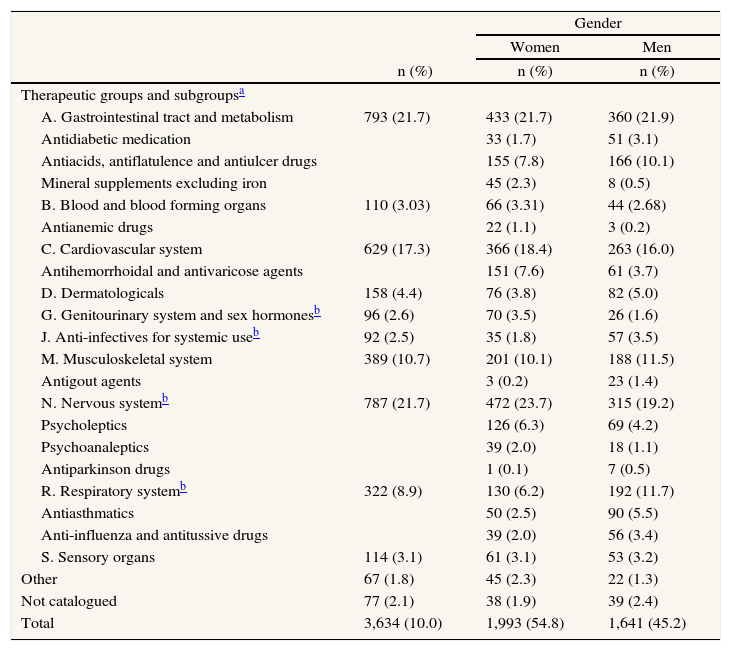
The 3.634 different drugs consumed by the 801 users were distributed into 12 therapeutic groups. The 5 most consumed groups accounted for 81% of the total, and comprised the digestive apparatus and metabolism, nervous system, cardiovascular system, locomotor apparatus and respiratory system. A total of 54.8% of the drugs were consumed by the 410 females in the sample. Significant differences (p < 0.001) were observed in drug consumption by therapeutic groups and patient gender. These differences were recorded in the therapeutic groups central nervous system and genitourinary tract – with greater female consumption (percentage difference 4.5; 95%CI, 1.8-7.2 and 1.9; 95%CI, 0.9-2.9, respectively), and in respiratory system and systemic anti-infectious therapy, with greater male consumption (percentage difference 5.2; 95%CI 3.3-7.1 and 1.7; 95% CI 0.7-2.8, respectively) (table 2).
Patient distribution by therapeutic groups subgroups and gender
| n (%) | Gender | ||
| Women | Men | ||
| n (%) | n (%) | ||
| Therapeutic groups and subgroupsa | |||
| A. Gastrointestinal tract and metabolism | 793 (21.7) | 433 (21.7) | 360 (21.9) |
| Antidiabetic medication | 33 (1.7) | 51 (3.1) | |
| Antiacids, antiflatulence and antiulcer drugs | 155 (7.8) | 166 (10.1) | |
| Mineral supplements excluding iron | 45 (2.3) | 8 (0.5) | |
| B. Blood and blood forming organs | 110 (3.03) | 66 (3.31) | 44 (2.68) |
| Antianemic drugs | 22 (1.1) | 3 (0.2) | |
| C. Cardiovascular system | 629 (17.3) | 366 (18.4) | 263 (16.0) |
| Antihemorrhoidal and antivaricose agents | 151 (7.6) | 61 (3.7) | |
| D. Dermatologicals | 158 (4.4) | 76 (3.8) | 82 (5.0) |
| G. Genitourinary system and sex hormonesb | 96 (2.6) | 70 (3.5) | 26 (1.6) |
| J. Anti-infectives for systemic useb | 92 (2.5) | 35 (1.8) | 57 (3.5) |
| M. Musculoskeletal system | 389 (10.7) | 201 (10.1) | 188 (11.5) |
| Antigout agents | 3 (0.2) | 23 (1.4) | |
| N. Nervous systemb | 787 (21.7) | 472 (23.7) | 315 (19.2) |
| Psycholeptics | 126 (6.3) | 69 (4.2) | |
| Psychoanaleptics | 39 (2.0) | 18 (1.1) | |
| Antiparkinson drugs | 1 (0.1) | 7 (0.5) | |
| R. Respiratory systemb | 322 (8.9) | 130 (6.2) | 192 (11.7) |
| Antiasthmatics | 50 (2.5) | 90 (5.5) | |
| Anti-influenza and antitussive drugs | 39 (2.0) | 56 (3.4) | |
| S. Sensory organs | 114 (3.1) | 61 (3.1) | 53 (3.2) |
| Other | 67 (1.8) | 45 (2.3) | 22 (1.3) |
| Not catalogued | 77 (2.1) | 38 (1.9) | 39 (2.4) |
| Total | 3,634 (10.0) | 1,993 (54.8) | 1,641 (45.2) |
By therapeutic subgroups, women showed a greater use of mineral supplements (excluding iron), antianemic agents, antihemorrhoidal and antivaricose drugs, psycholeptics and psychoanaleptics. In comparison, men showed a greater consumption of antacids, antiflatulence and antiulcer drugs, antidiabetic, antigout, and antiparkinson drugs, as well as antiasthmatic, anti-influenza and antitussive medication (table 2).
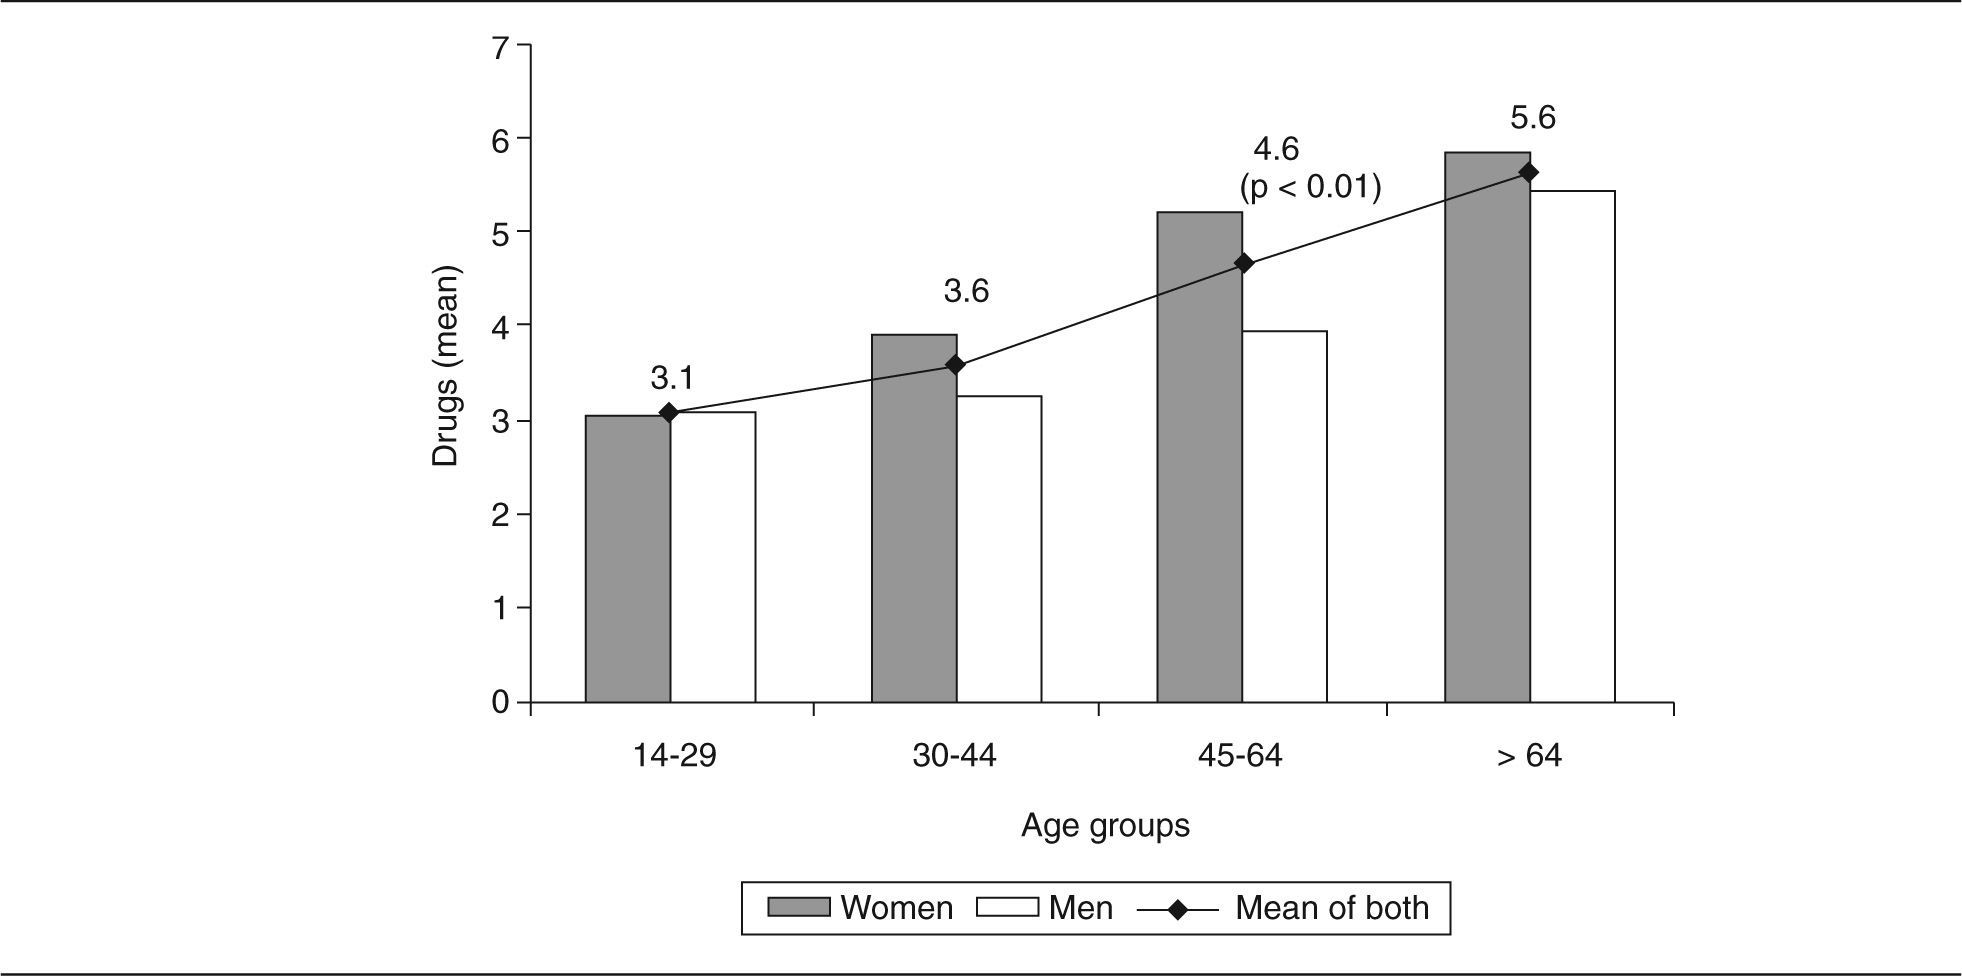
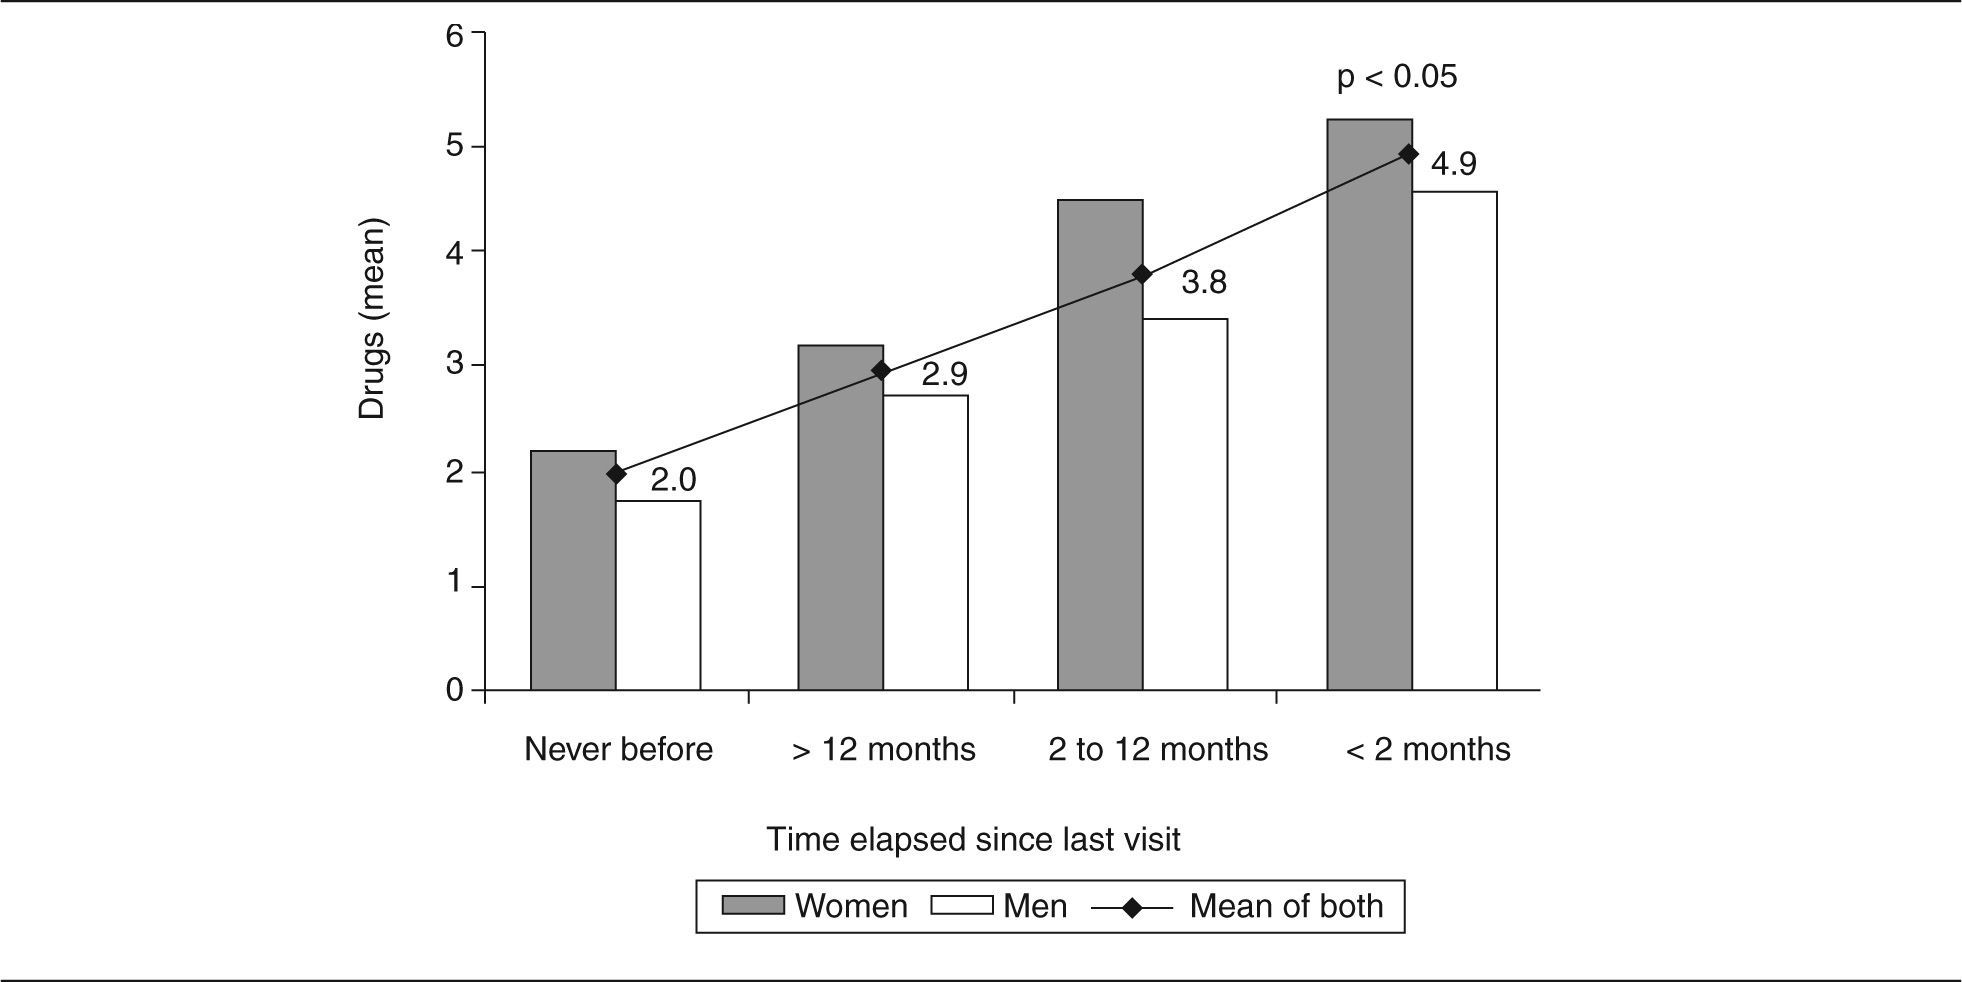
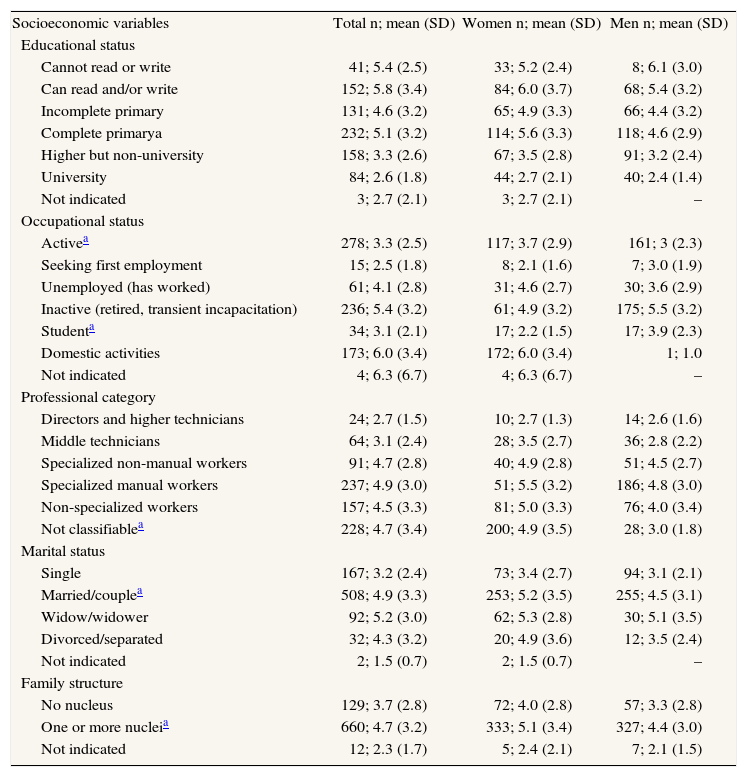
Variables associated to drug use by genderThe mean number of drugs consumed per person was 4.5 (SD 3.2); 54.6% (95%CI, 51.1-58.8) of the patients consumed more than 3 drugs. Drug use increased with age and the female sex (p < 0.001). The relationship was significantly higher in women aged 45-64 years (fig. 1). Significant differences (p < 0.001) were also seen in drug use by educational level, and professional, occupational and marital status. Table 3 shows the mean drug consumptions distributed by predictive variables and gender groups. The number of drugs used was found to decrease with increasing educational level and professional categories. The analysis of differences by gender showed that –with the exception of the illiterate subjects– women consumed more drugs. These differences was statistically significant at the complete primary education level (difference of the means 1.0; 95%CI, 0.2-1.8) and in the lowest professional category, where 76% were involved in domestic activities (difference of the means 2.0; 95%CI, 1.1-2.8). Housewives and inactive subjects were those who consumed most medication. Moreover, widowers were found to consume most drugs, and either married or divorced individuals used more drugs than single subjects (difference of the means 2.0; 95%CI, 0.8-3.2). Married women or widows consumed more drugs than men (difference of the means 0.7; 95%CI, 0.1-1.2). Grouping of the family structure into 2 categories showed significant differences (p < 0.01) in the sense of increased drug use in nucleated families (difference of the means 1.0; 95% CI, 0.5-1.7), and also an increased use of medication among women belonging to a nucleated family (difference of the means 0.7; 95%CI, 0.2-1.2). In turn, significant differences were recorded in drug consumption according to the time elapsed since the last visit to the primary care center (p < 0.001). In effect, drug use was found to increase with the frequency of visits. The analysis of the 4 visiting frequency levels and their distribution by gender revealed increased drug consumption among women, with significant differences in the highest frequency (fig. 2).

Number of patients and mean drug consumption. Distribution by predictive variables and gender
| Socioeconomic variables | Total n; mean (SD) | Women n; mean (SD) | Men n; mean (SD) |
| Educational status | |||
| Cannot read or write | 41; 5.4 (2.5) | 33; 5.2 (2.4) | 8; 6.1 (3.0) |
| Can read and/or write | 152; 5.8 (3.4) | 84; 6.0 (3.7) | 68; 5.4 (3.2) |
| Incomplete primary | 131; 4.6 (3.2) | 65; 4.9 (3.3) | 66; 4.4 (3.2) |
| Complete primarya | 232; 5.1 (3.2) | 114; 5.6 (3.3) | 118; 4.6 (2.9) |
| Higher but non-university | 158; 3.3 (2.6) | 67; 3.5 (2.8) | 91; 3.2 (2.4) |
| University | 84; 2.6 (1.8) | 44; 2.7 (2.1) | 40; 2.4 (1.4) |
| Not indicated | 3; 2.7 (2.1) | 3; 2.7 (2.1) | – |
| Occupational status | |||
| Activea | 278; 3.3 (2.5) | 117; 3.7 (2.9) | 161; 3 (2.3) |
| Seeking first employment | 15; 2.5 (1.8) | 8; 2.1 (1.6) | 7; 3.0 (1.9) |
| Unemployed (has worked) | 61; 4.1 (2.8) | 31; 4.6 (2.7) | 30; 3.6 (2.9) |
| Inactive (retired, transient incapacitation) | 236; 5.4 (3.2) | 61; 4.9 (3.2) | 175; 5.5 (3.2) |
| Studenta | 34; 3.1 (2.1) | 17; 2.2 (1.5) | 17; 3.9 (2.3) |
| Domestic activities | 173; 6.0 (3.4) | 172; 6.0 (3.4) | 1; 1.0 |
| Not indicated | 4; 6.3 (6.7) | 4; 6.3 (6.7) | – |
| Professional category | |||
| Directors and higher technicians | 24; 2.7 (1.5) | 10; 2.7 (1.3) | 14; 2.6 (1.6) |
| Middle technicians | 64; 3.1 (2.4) | 28; 3.5 (2.7) | 36; 2.8 (2.2) |
| Specialized non-manual workers | 91; 4.7 (2.8) | 40; 4.9 (2.8) | 51; 4.5 (2.7) |
| Specialized manual workers | 237; 4.9 (3.0) | 51; 5.5 (3.2) | 186; 4.8 (3.0) |
| Non-specialized workers | 157; 4.5 (3.3) | 81; 5.0 (3.3) | 76; 4.0 (3.4) |
| Not classifiablea | 228; 4.7 (3.4) | 200; 4.9 (3.5) | 28; 3.0 (1.8) |
| Marital status | |||
| Single | 167; 3.2 (2.4) | 73; 3.4 (2.7) | 94; 3.1 (2.1) |
| Married/couplea | 508; 4.9 (3.3) | 253; 5.2 (3.5) | 255; 4.5 (3.1) |
| Widow/widower | 92; 5.2 (3.0) | 62; 5.3 (2.8) | 30; 5.1 (3.5) |
| Divorced/separated | 32; 4.3 (3.2) | 20; 4.9 (3.6) | 12; 3.5 (2.4) |
| Not indicated | 2; 1.5 (0.7) | 2; 1.5 (0.7) | – |
| Family structure | |||
| No nucleus | 129; 3.7 (2.8) | 72; 4.0 (2.8) | 57; 3.3 (2.8) |
| One or more nucleia | 660; 4.7 (3.2) | 333; 5.1 (3.4) | 327; 4.4 (3.0) |
| Not indicated | 12; 2.3 (1.7) | 5; 2.4 (2.1) | 7; 2.1 (1.5) |
n: number of patients; mean: mean of drugs consumed by patient; SD: standard deviation.
 and gender.")
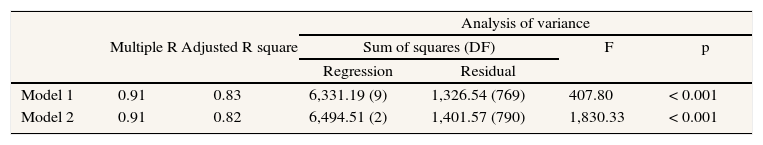
Table 4 shows the results of the application of the two models described under Methods' section, where the value of the F-test was found to be significant in both. As a result, the variability accounted for by the equations was significant in the two models. Analysis of Model 1 showed the variability accounted for by the model to be 0.8, and the regression coefficients of the variables «health problems» and «frequency of visits» were significant. In Model 2, the value of the residuals, that of the fitted determination coefficient and the regression coefficients of the variables «health problems» and «frequency of visits» were similar to those of Model 1 (nonconfounding with the rest of variables). The optimum model for explaining the value of gender was Model 1, since it takes into account all the predictive variables studied, without losing valuable accuracy. These data show that: a) the number of health problems and the frequency of visits explain 82.2% of the variability of the variable «number of drugs consumed», and b) for each health problem 1.3 drugs are consumed, fitted for all the predictive variables studied.
Model summaries explaining the number of drugs consumed
| Multiple R | Adjusted R square | Analysis of variance | ||||
| Sum of squares (DF) | F | p | ||||
| Regression | Residual | |||||
| Model 1 | 0.91 | 0.83 | 6,331.19 (9) | 1,326.54 (769) | 407.80 | < 0.001 |
| Model 2 | 0.91 | 0.82 | 6,494.51 (2) | 1,401.57 (790) | 1,830.33 | < 0.001 |
| Variables | β (standard error) | Confidence interval | Beta | T | p | |
| Model 1 | Constant | 0.03 (0.215) | −0.391-0.451 | 0.139 | 0.890 | |
| Gender | −0.043 (0.097) | −0.233-0.147 | −0.007 | −0.441 | 0.659 | |
| Age | 0.002 (0.004) | −0.005-0.009 | 0.013 | 0.595 | 0.552 | |
| Family structure | 0.04 (0.143) | −0.243-0.318 | 0.004 | 0.264 | 0.792 | |
| Occupational status | 0.151 (0.118) | −0.079-0.382 | 0.023 | 1.29 | 0.198 | |
| Frequency of visits | 0.252 (0.113) | 0.031-0.473 | 0.035 | 2.24 | 0.026 | |
| Marital status | 0.007 (0.152) | −0.291-0.305 | 0.001 | 0.046 | 0.963 | |
| Educational status | −0.023 (0.118) | −0.254-0.208 | −0.004 | −0.194 | 0.846 | |
| Professional category | −0.058 (0.124) | −0.302-0.186 | −0.008 | −0.467 | 0.641 | |
| Health problems | 1.261 (0.023) | 1.216-1.306 | 0.894 | 54.5 | 0.000 | |
| Model 2 | Constant | 0.137 (0.110) | −0.079-0.352 | 1.247 | 0.213 | |
| Health problems | 1.277 (0.022) | 1.235-1.320 | 0.899 | 59.1 | 0.000 | |
| Frequency of visits | 0.286 (0.110) | 0.070-0.502 | 0.039 | 2.597 | 0.010 |
Model 1: includes all the predictive variables; Model 2: includes the variables n.° of health problems and frequency of visits; dependent variable: n.° of drugs consumed; R: correlation coefficient; DF: degrees of freedom; F: F test for comparison of variances; T: statistic; CI: 95% confidence interval for B; recoding multivariate analysis: gender: 0. male, 1. female; age: years; family structure: 0. no nucleus, 1. one or more nuclei; occupational status: 0. active, 1. seeking first employment, unemployed, inactive, student or domestic activities; frequency of visits: 0.> 2 months 1.< 2 months; marital status: 0. single 1. married/couple, widow/widower or divorced/separated; educational status: 0. high educational level (complete primary, higher but non-university and university studies), 1. low educational level (cannot read or write, can read and/or write and incomplete primary); professional category: 0. high professional category (directors and higher technicians, middle technicians, specialized non-manual workers), 1. low professional category (specialized manual workers, non-specialized workers, not classifiable); health problems: number. DF: degrees of freedom.
The main finding of this study is probably that women do not use larger numbers of drugs than men if health problems and frequency of visits are controlled in the multivariate analysis. Although many studies have investigated the use of drugs and the role of different variables as predictors of drug consumption, it is not easy to establish comparisons among studies, since different populations, information sources and methods are involved1,2,6-10,20,22,23.
This work has the usual limitations of a cross-sectional survey. The aim of the study was to compare the use of drugs by patient gender, and in this sense there are no reasons to believe that the selection of patients, centers and seasonal pathology may have influenced comparison of the groups. The behavior of some of the predictive variables as confounding factors was controlled in the analytical stage by means of multivariate analysis and through stratification in the bivariate analysis. The strategies used for the collection of data based on prescription and self-medication data related to the health problems leading to consumption allowed us to control information bias and secure improved quality information.
Drug use by therapeutic groupsOur results show 80% of the medication consumed to correspond to five therapeutic groups. Although the order may vary, the most frequently consumed therapeutic groups reported in the literature essentially coincide with our own findings1,10,20,22-25. By therapeutic subgroups, our observation that women consume more psycholeptics and psychoanaleptics coincides with the published reports1,6,18,20,23-25. Our results agree with those reporting female consumption to be greater in relation to psychotherapeutic agents, with no gender differences in relation to cardiovascular drugs and diuretics1,24. However, other studies have reported differences in relation to these last therapeutics groups, central nervous system, nutritional or hematological medication23,25.
In the descriptive analysis, the present results show that women in global terms consume more medication than men, and that drug use increases with age. These findings coincide with the literature, though in our case significant differences by gender were only observed for the 45-64 years age group2-4,6,8,10,16,20,26,27. In contrast, Kotzan et al2, in a study of the Medicaid population, found no gender differences in the number of drugs prescribed per patient. These authors explain this result in terms of a poor health status among the males of the study population involved. Our results coincide in reflecting increased drug use at the lower educational and social levels6,8,22,26,27, and are consistent with those of Payne et al10, who found education to be a predictor of medication use. Moreover, women were seen to consume more drugs at all social levels, though the differences only reached statistical significance in the category fundamentally comprising housewives. The higher drug use observed among inactive individuals and housewives was probably related to patient age, since 91% of the housewives were over age 45, and 76% of the inactive individuals were over 65 years old. However, housewives consumed more drugs than the inactive users despite being younger – an observation that could be related to gender (99% of the users engaged in domestic activities corresponding to women, while 74% of the inactive subjects were males), the social role of women involved in domestic activities, and to morbidity. These considerations would be in line with the results of Rohlfs et al28, indicating that both young and mature housewives consume more medication than women who are either actively employed or unemployed. In agreement with other studies6,22, widows and widowers consume most drugs, though we believe this could be linked to both patient age (80% over age 65) and morbidity (more health problems than in the average population).
The frequency of visits to primary care centers has been associated to increased drug use both in our study and elsewhere in the literature6,7,10,22,26. The fact that women make use of health services more often than men has already been documented6,10,20,26,28. However, in coincidence with the description of Payne et al10 regarding the proportion of Canadian women reporting medication use increments with the number of physician visits, on analyzing consumption in our series by fitting to the frequency of visits, we found that women continue to use more drugs than males in all frequency categories. Drug consumption is obviously related to the existence of health problems. The mean number of problems for which our patients consumed drugs was again greater among women than in men – in agreement with other authors6,10,20,22. In our case, the number of health problems recorded was higher than in the study by López-Torres et al22, who only considered chronic health problems in elderly patients, and not perceived morbidity as in both our case and in the Health Survey of the Valencian Community20.
Results of the multivariate analysisIn the study by Roe et al23 using a database with pharmacy claim and eligibility information, gender differences in medication are reported in several classes of medications, including antidepressants and antianxiety and pain medication. However, the authors did not investigate the possible causes of such differences, and moreover claimed that future research should be conducted to afford better understanding of the role of socioeconomic status, ethnicity and geographic region. In this sense, the increased drug consumption associated with the female gender, advanced age, a low educational level, lower professional categories or housewife status, and inactivity or unemployment –documented both in our study and elsewhere in the literature– fails to sustain statistical significance when taking into account the number of health problems and the frequency of visits in the multivariate analysis. In this way, the Women's Health Surveillance Report from the Canadian Institute for Health Information reported that medication use increases with a greater number of chronic diseases, physician visits, and age10. In contrast, Van der Waals et al29 concluded that the gender difference among benzodiazepine users seems to be due to general practitioners being less stringent when prescribing these drugs for women. We agree with Eggen6, who considered that health problems (in terms of number) are the best predictor of drug use. Only the more frequent utilization of health services, controlling for the rest of variables (including the number of health problems), conditions increased drug consumption. If as suggested by our results and those of Payne et al10, health problems are effectively the main factor underlying increased drug consumption among women, then historical factors (e.g., social discrimination) could cause women to become ill more often or feel more ill – thus leading to increased drug consumption28. If this were not the case, then patient gender bias could manifest through the tendency of physicians to overdiagnose women and/or underdiagnose males –thereby prescribing more drugs among the former– but not through a greater or lesser accessibility to medication on the part of women29. The gender of patients and/or doctors may condition the diagnosis of illness, though once the patients are diagnosed, health problems are the main factor underlying drug consumption among both women and men.
AcknowledgementsThis study was supported by grant 96/023 from the Conselleria de Sanidad y Consumo, Generalitat Valenciana. We thank the physicians who contributed to make the present study possible.


