


To assess the amount of employment generated from the effective development of the Dependency Act in 2012, by evaluating the number of jobs depending on whether in-kind services or cash benefits were applied.
MethodsThe level and total costs of dependency were obtained by using the Survey on Disability, Personal Autonomy and Dependency Situations of 2008. The consumption of dependent households was collected from the Household Budget Survey of 2012 carried out by the Spanish Statistics Institute. The impact on employment was estimated using an extended Input-Output model based on Symmetric Input-Output Tables and labour data from the Spanish National Accounts Base.
ResultsThe total estimated costs of dependency in 2012 were 4,545 million Euros for in-kind services and 2,662 for cash benefits. One hundred and ninety-five thousand, six hundred and sixty-eight jobs were generated in 2012 from dependency costs, and132,997 were linked to in-kind services and 62,671 to cash benefits. Every million Euros allocated for dependency by the Government returned 53.33 jobs linked to in-kind services and 46.21 to cash benefits. Furthermore, 341,505 jobs would have been created if dependency benefits had been exclusively offered via in-kind services.
ConclusionsDependency benefits were equally distributed between in-kind services and cash benefits in 2012. Given that two out of three job positions generated from dependency benefits are linked to in-kind services, while the remaining third is generated by cash benefits, we conclude that around 146 thousand more jobs would have been generated if benefits had been offered as in-kind services instead of overusing cash benefits.
Estimar la creación de empleo generada por la implantación de la Ley de Dependencia en 2012, evaluando el número de puestos de trabajo vinculados a servicios y a prestaciones económicas.
MétodosLos grados y los costes totales de la dependencia se han obtenido de la Encuesta sobre Discapacidades, Autonomía Personal y Situaciones de Dependencia de 2008. El consumo de los hogares dependientes proviene de la Encuesta de Presupuestos Familiares realizada por el Instituto Nacional de Estadística en 2012. La creación de empleo se ha estimado con un modelo ampliado input-output basado en las tablas simétricas input-output y en datos de empleo de la Contabilidad Nacional de España.
ResultadosLos costes totales de dependencia estimados en 2012 fueron de 4545 millones de euros en servicios y 2662 millones de euros en prestaciones económicas. Se generaron 195.668 empleos vinculados a prestaciones de dependencia en 2012, 132.997 asociados a servicios y 62.671 a prestaciones económicas. Cada millón de euros asignados a prestaciones de dependencia por la Administración generó 53,33 empleos vinculados a servicios y 46,21 a prestaciones económicas. Además, se habrían creado 341.505 empleos si las prestaciones de dependencia hubieran sido asignadas únicamente como servicios.
ConclusionesLos costes de dependencia se distribuyeron por igual entre servicios y prestaciones económicas en 2012. Dado que dos de cada tres empleos generados por las prestaciones de dependencia están vinculados a servicios, mientras que el tercio restante a prestaciones económicas, se habrían generado 146.000 empleos más si todas las prestaciones hubieran sido asignadas como servicios en lugar de la masiva utilización de prestaciones económicas.
The age structure of the population is currently turning increasingly grey. Different trends among age-groups will cause the old-age dependency ratio to increase worldwide from 10.9% in 2000 to 24.7% in 2050,1 and in the European Union (EU) from 27.8% in 2013 to 50.1% in 2060.2 Spain holds the highest life expectancy at birth in Europe (86.1 for women and 80.2 for men) followed by France and Italy,3 and well above the EU averages of 83.3 for women and 77.8 for men in 2013. Moreover, healthy life years in Spain (63.9 for women and 64.7 for men) also stands above-average in EU countries (61.5 for women and 61.4 form men).4 Hence, the demand for social and health care services is becoming increasingly relevant. In Spain, such relevance could be explained by a more diversified user profile resulting from new processes of chronicity and pluripathology of the elderly5 where morbimortality is shifting to a predominance of non-communicable diseases and injuries, by the disappearance of traditional informal care, and by changes in family structures and rural-urban migration patterns.6 To face this challenge, Act 39/2006 of 14th December on Promotion of Personal Autonomy and Assistance for Persons in a Situation of Dependency7 (known as Dependency Act, henceforth DA) was passed in 2006. Nowadays, 2.6% of the total Spanish population is dependent (1,2 million individuals),3 seven out of every ten dependent individuals are over the age of 65, and more than half are beyond the age of 80.8
The DA assistance was originally conceived to be provided via in-kind services and cash benefits. Initially, extensive use was conferred to the former, while the latter remained in a residual role. However, the exception became the rule, which meant that cash benefits turned to regularly account for 50% of the total nationwide assistance9 and even reached 80% of the total dependency costs in several of the Spanish regions.10
The DA initially reported a macroeconomic impact of 262,735 new jobs (scenario 2010), 190,000 induced jobs and the potential incorporation of 115,000 workers from the informal care sector.11 Only two studies have contrasted such results. The first one focused on the economic effect of the National System of Dependence (NSD) implementation and its capacity for job creation.12 This study estimated the impact caused by current spending and investment in construction, considering both public initiative and 50% public/private initiative. The results were obtained by using the Input-Output framework (174,464 jobs), the Hermin model (169,855 jobs) and microeconomic methodology (160,314 jobs). Subsequently, a second study lowered the employment forecasts to 154,523 jobs by using also input-output analysis and the Hermin model,13 with an annual average of 137,000 jobs between 2007 and 2011, which led to a fiscal return of 27% via taxes and payroll contributions.
The outbreak of the 2008 financial crisis meant that a fiscal consolidation program was introduced in Spain. The first measures implemented by 2010 hardly affected the development of the DA, just by minor amendments in the retroactivity of benefits and the assessment periods.14 Such adjustments promptly proved insufficient due to the persistence of serious fiscal imbalances and two structural reforms were therefore implemented.15,16 Suppressing dependency levels, delaying the incorporation to the system of individuals assessed as level I until July 2015, reducing cash benefits, and changing the co-payment rule –which led to user contributions rising to almost 50% of the shared costs– were the main measures thereby introduced.17,18 When social protection plans experience such reduction, the flow of income to beneficiaries decreases and so do the stabilising effects of their spending.19 In allowing the dependent households to meet their consumption needs, dependency benefits can be considered a source of additional demand able to stimulate production and employment. Moreover, given that such demand is very much oriented to basic goods and services, they usually cause a significant impact on employment.20
To the best of our knowledge, none of the existing studies has estimated the effects that the DA has produced on employment after the structural reform of 2012. Hence, based on the estimated cost of dependency for 2012,15,16 this work aims at assessing the number of jobs depending on the effective development of the DA in 2012, once the reforms were undertaken. Furthermore, an underlying objective involves evaluating the differences in such employment whether the dependency assistance is provided via in-kind services or via cash benefits.
Material and methodsFirst, we draw upon the Survey on Disability, Personal Autonomy and Dependency Situations for 2008 conducted by the Spanish National Statistics Institute.21 The methodology used to estimate the total costs, which are divided into public Administration and beneficiary contributions, was developed in a recent paper.17 However, it is necessary to note an important modification: the cash benefits for informal care have been considered according to legislation,15 instead of applying the substitution method described in the above mentioned method.
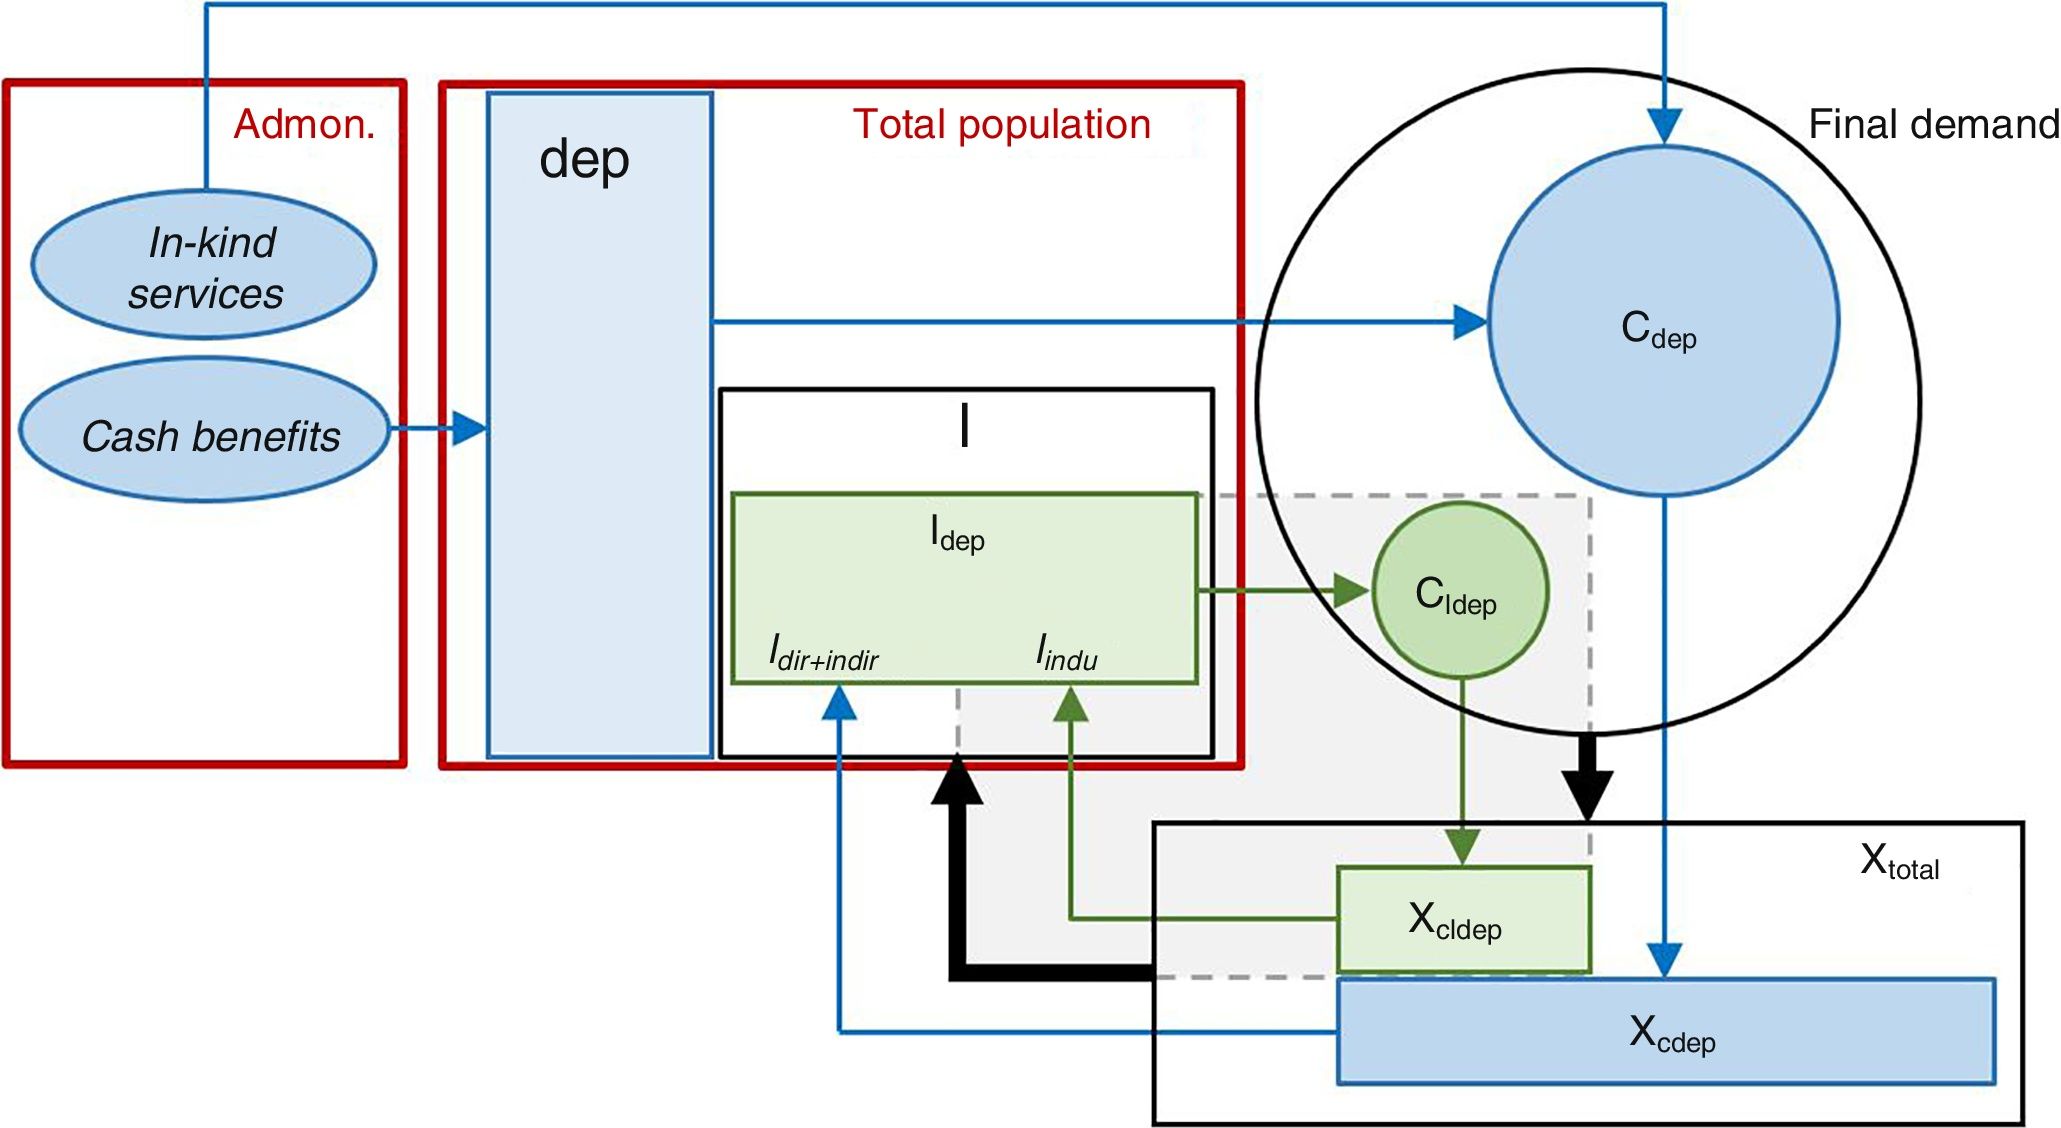
Our investigation grounds on the symmetric input-output framework and the Household Budget Survey, which are further described in Appendix 1 online. To determine the employment required to meet the consumption of both Administration and dependent households an extended input-output model was constructed (Fig. 1). This model is based on previous input-output approaches,22–24 where the equilibrium solution is found by making the household sector endogenous.25 To attain this, households are shifted to the inter-industry transaction matrix, so they behave like any other industrial sector but, in this case, their input is consumption and their output is labour. Following this criterion, workers’ consumption is transferred in our model from the final demand to an extended Leontief inverse matrix. By doing so, an increase in industrial activity will also increase income to workers, which in turn will be reflected in higher levels of inter-industry consumption.

Figure 1 describes the distinction between the exogenous and endogenous components embodied in our model. First, the exogenous circuit (in blue) shows the employment Idir+indir required to obtain the output linked to dependents’ consumption cdep, which includes the direct jobs in the sector under study plus indirect jobs in the rest of the sectors. Secondly, the endogenous circuit (in green) shows the induced employment Iindu resulting from the consumption cIdep by the workers required to meet dependents’ consumption.
Following traditional input-output techniques,26 the equilibrium output solution for the model is:
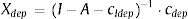
Where I−A−cIdep−1 is the extended inverse matrix to capture the total effects on output Xdep as a result of a particular change in the exogenous consumption (column) vector cdep.27 Such total effects are based on the inter-industry structure given by the technical coefficients in matrix A and the induced consumption cIdep above explained.
In a further step, the total number of jobs (direct, indirect and induced) required to get Xdep is given by:

Where
This section contains the main results obtained from the model described above. First, the sectoral and aggregated employment that returns from the dependency costs is presented. Subsequently, the results from a sensitive analysis will shed some light on the effectiveness of in-kind services and cash benefits in terms of job creation.
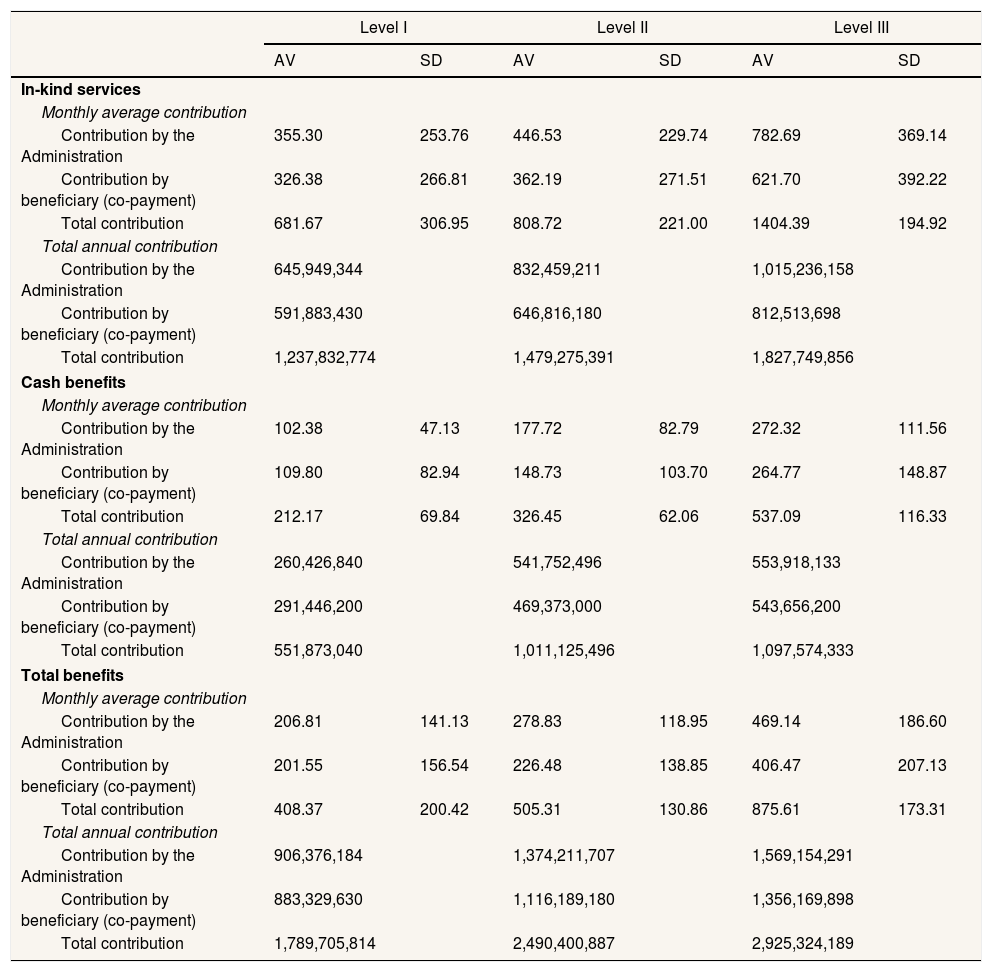
Table 1 presents the estimation for the dependency costs. In describing this, it is useful to make a distinction between the contributions from public Administration and from beneficiaries. The average monthly total cost per person for dependency levels I, II and III amounts to 408.37€, 505.31€ and 875.61€, respectively. Such average costs are different depending on whether in-kind services or cash benefits are considered. Therefore, 681.67€, 808.72€ and 1,404.39€ are the average costs when in-kind services are offered, while the average costs drop to 212.17€, 326.45€ and 537.49€ when cash benefits are applied. The average monthly costs in Table 1 appear to be rather equally distributed between the public Administration and beneficiaries. However, the annual total cost is almost 71% larger when in-kind services are offered (4,544,858,021€) instead of cash benefits (2,660,572,869€).
Dependency contributions by Administration and beneficiaries. Total and monthly contributions by level and type of benefit (Euros 2012).
| Level I | Level II | Level III | ||||
|---|---|---|---|---|---|---|
| AV | SD | AV | SD | AV | SD | |
| In-kind services | ||||||
| Monthly average contribution | ||||||
| Contribution by the Administration | 355.30 | 253.76 | 446.53 | 229.74 | 782.69 | 369.14 |
| Contribution by beneficiary (co-payment) | 326.38 | 266.81 | 362.19 | 271.51 | 621.70 | 392.22 |
| Total contribution | 681.67 | 306.95 | 808.72 | 221.00 | 1404.39 | 194.92 |
| Total annual contribution | ||||||
| Contribution by the Administration | 645,949,344 | 832,459,211 | 1,015,236,158 | |||
| Contribution by beneficiary (co-payment) | 591,883,430 | 646,816,180 | 812,513,698 | |||
| Total contribution | 1,237,832,774 | 1,479,275,391 | 1,827,749,856 | |||
| Cash benefits | ||||||
| Monthly average contribution | ||||||
| Contribution by the Administration | 102.38 | 47.13 | 177.72 | 82.79 | 272.32 | 111.56 |
| Contribution by beneficiary (co-payment) | 109.80 | 82.94 | 148.73 | 103.70 | 264.77 | 148.87 |
| Total contribution | 212.17 | 69.84 | 326.45 | 62.06 | 537.09 | 116.33 |
| Total annual contribution | ||||||
| Contribution by the Administration | 260,426,840 | 541,752,496 | 553,918,133 | |||
| Contribution by beneficiary (co-payment) | 291,446,200 | 469,373,000 | 543,656,200 | |||
| Total contribution | 551,873,040 | 1,011,125,496 | 1,097,574,333 | |||
| Total benefits | ||||||
| Monthly average contribution | ||||||
| Contribution by the Administration | 206.81 | 141.13 | 278.83 | 118.95 | 469.14 | 186.60 |
| Contribution by beneficiary (co-payment) | 201.55 | 156.54 | 226.48 | 138.85 | 406.47 | 207.13 |
| Total contribution | 408.37 | 200.42 | 505.31 | 130.86 | 875.61 | 173.31 |
| Total annual contribution | ||||||
| Contribution by the Administration | 906,376,184 | 1,374,211,707 | 1,569,154,291 | |||
| Contribution by beneficiary (co-payment) | 883,329,630 | 1,116,189,180 | 1,356,169,898 | |||
| Total contribution | 1,789,705,814 | 2,490,400,887 | 2,925,324,189 | |||
AV: average; SD: standard deviation.
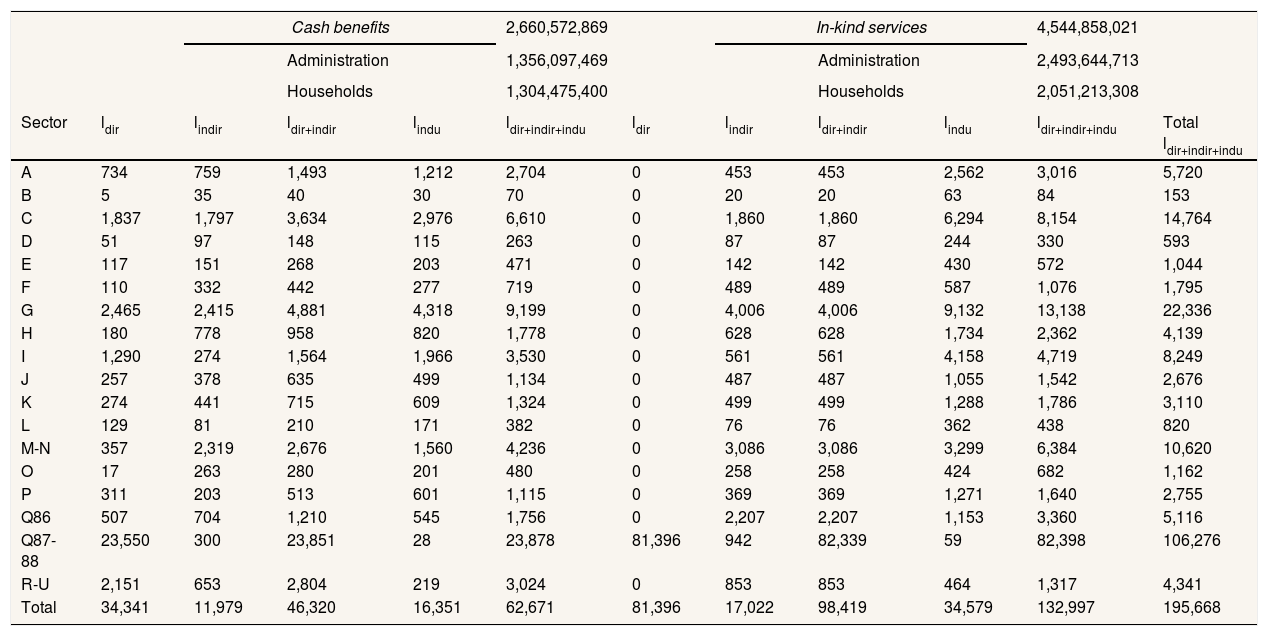
In a second stage, we estimate the household consumption funded with the above costs of dependency. Such level of consumption, under the Keynesian principle of effective demand, will lead to a higher level of production through the multiplier effect.28Appendix 2 online includes the consumption and production outcomes at the aggregated and sectoral levels, as well as the procedure to be calculated. Finally, equation (2) provides the number of jobs Idep required to obtain Xdep (Table 2).
Number of jobs linked to the consumption of dependent households (2012).
| Cash benefits | 2,660,572,869 | In-kind services | 4,544,858,021 | ||||||||
|---|---|---|---|---|---|---|---|---|---|---|---|
| Administration | 1,356,097,469 | Administration | 2,493,644,713 | ||||||||
| Households | 1,304,475,400 | Households | 2,051,213,308 | ||||||||
| Sector | ldir | lindir | ldir+indir | lindu | ldir+indir+indu | ldir | lindir | ldir+indir | lindu | ldir+indir+indu | Total ldir+indir+indu |
| A | 734 | 759 | 1,493 | 1,212 | 2,704 | 0 | 453 | 453 | 2,562 | 3,016 | 5,720 |
| B | 5 | 35 | 40 | 30 | 70 | 0 | 20 | 20 | 63 | 84 | 153 |
| C | 1,837 | 1,797 | 3,634 | 2,976 | 6,610 | 0 | 1,860 | 1,860 | 6,294 | 8,154 | 14,764 |
| D | 51 | 97 | 148 | 115 | 263 | 0 | 87 | 87 | 244 | 330 | 593 |
| E | 117 | 151 | 268 | 203 | 471 | 0 | 142 | 142 | 430 | 572 | 1,044 |
| F | 110 | 332 | 442 | 277 | 719 | 0 | 489 | 489 | 587 | 1,076 | 1,795 |
| G | 2,465 | 2,415 | 4,881 | 4,318 | 9,199 | 0 | 4,006 | 4,006 | 9,132 | 13,138 | 22,336 |
| H | 180 | 778 | 958 | 820 | 1,778 | 0 | 628 | 628 | 1,734 | 2,362 | 4,139 |
| I | 1,290 | 274 | 1,564 | 1,966 | 3,530 | 0 | 561 | 561 | 4,158 | 4,719 | 8,249 |
| J | 257 | 378 | 635 | 499 | 1,134 | 0 | 487 | 487 | 1,055 | 1,542 | 2,676 |
| K | 274 | 441 | 715 | 609 | 1,324 | 0 | 499 | 499 | 1,288 | 1,786 | 3,110 |
| L | 129 | 81 | 210 | 171 | 382 | 0 | 76 | 76 | 362 | 438 | 820 |
| M-N | 357 | 2,319 | 2,676 | 1,560 | 4,236 | 0 | 3,086 | 3,086 | 3,299 | 6,384 | 10,620 |
| O | 17 | 263 | 280 | 201 | 480 | 0 | 258 | 258 | 424 | 682 | 1,162 |
| P | 311 | 203 | 513 | 601 | 1,115 | 0 | 369 | 369 | 1,271 | 1,640 | 2,755 |
| Q86 | 507 | 704 | 1,210 | 545 | 1,756 | 0 | 2,207 | 2,207 | 1,153 | 3,360 | 5,116 |
| Q87-88 | 23,550 | 300 | 23,851 | 28 | 23,878 | 81,396 | 942 | 82,339 | 59 | 82,398 | 106,276 |
| R-U | 2,151 | 653 | 2,804 | 219 | 3,024 | 0 | 853 | 853 | 464 | 1,317 | 4,341 |
| Total | 34,341 | 11,979 | 46,320 | 16,351 | 62,671 | 81,396 | 17,022 | 98,419 | 34,579 | 132,997 | 195,668 |
A: agriculture, forestry and fishing; B: mining and quarrying; C: manufacture; D: electricity, gas, steam and air conditioning supply; E: water collection, treatment and supply and waste collection; F: construction; G: wholesale and retail trade; H: transport; I: accommodation and food service activities; J: information and communication; K: financial and insurance activities; L: real estate activities; M-N: professional, scientific and technical activities, administrative and support service activities; O: public Administration, defence; P: education; Q86: health services; Q87-88: social work activities; R-U: arts, entertainment and recreation, other service activities, activities of household and extra-territorial organizations and bodies.
The results of aggregated and sectoral employment are presented under two scenarios based on the total cost Yc that funds the exogenous consumption. Firstly, we consider that cash benefits cover dependency needs (left side in Table 2). In such case, the Administration provides the eligible households with an amount of money (1,356.10 million euros) which is added to the share of income that households allocate for social work activities (1,304.48 million euros). While cash benefits are provided to meet the dependency, needs addressed by the DA, the ultimate effect is an increase in the total income of dependent households. Such rise in income eases the budget constraint of households, allowing them to spend, based on their propensities of consumption, a larger amount of money not only on social work activities (1,314.94 million euros) but also on the rest of goods and services. Consequently, the exogenous consumption by dependent households (2,660.57 million euros in total) generates 46,320 jobs (34,341 direct and 11,979 indirect). The consumption of these workers (1,090.30 million euros in total) put in motion 16,351 induced jobs, resulting in 62,671 total jobs depending on cash benefits.
The right side of Table 2 shows the results considering that in-kind services cover dependency needs. In this case, both the Administration (2,493.64 million euros) and the dependent households (2,051.21 million euros) pay directly for the social work services demanded according to the DA. Considering this, the consumption basket of the dependent households includes exclusively the expenditure in social work activities, which generates 98,419 jobs (81,396 direct and 17,022 indirect). The consumption of these workers (2,316.60 million euros in total) put in motion 34,579 induced jobs. Therefore, the total number of jobs linked to in-kind services reached 132,997 jobs. Finally, the last column in Table 2 accumulates the corresponding jobs resulting from the two considered scenarios (195,668 jobs in total).
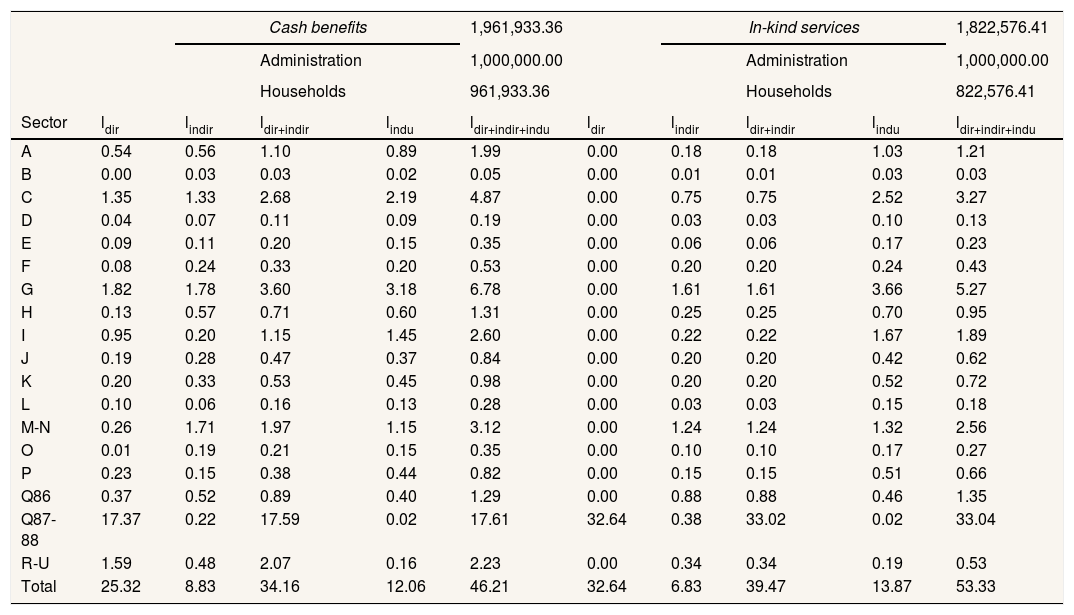
Table 3 describes the impact on employment of every million euros allocated for dependency, making a distinction between in-kind services and cash benefits. Such results provide a better insight into the efficiency of the DA during its period of enforcement. When in-kind services are offered, benefit costs are shared between public Administration and beneficiaries following the same pattern observed for the 4,544.86 million euros spent on dependency benefits in 2012 (that is, 54.87% public Administration vs 45.13% beneficiaries). The results at the aggregate level show that in-kind services created 53.33 jobs, while the number of jobs decreased to 46.21 when cash benefits were applied. In sum, the return of employment from every million euros allocated to in-kind services is 15.41% larger than using cash benefits.
Sensitivity analysis. Number of jobs linked 1 million € allocated for dependency by the Administration (2012).
| Cash benefits | 1,961,933.36 | In-kind services | 1,822,576.41 | |||||||
|---|---|---|---|---|---|---|---|---|---|---|
| Administration | 1,000,000.00 | Administration | 1,000,000.00 | |||||||
| Households | 961,933.36 | Households | 822,576.41 | |||||||
| Sector | ldir | lindir | ldir+indir | lindu | ldir+indir+indu | ldir | lindir | ldir+indir | lindu | ldir+indir+indu |
| A | 0.54 | 0.56 | 1.10 | 0.89 | 1.99 | 0.00 | 0.18 | 0.18 | 1.03 | 1.21 |
| B | 0.00 | 0.03 | 0.03 | 0.02 | 0.05 | 0.00 | 0.01 | 0.01 | 0.03 | 0.03 |
| C | 1.35 | 1.33 | 2.68 | 2.19 | 4.87 | 0.00 | 0.75 | 0.75 | 2.52 | 3.27 |
| D | 0.04 | 0.07 | 0.11 | 0.09 | 0.19 | 0.00 | 0.03 | 0.03 | 0.10 | 0.13 |
| E | 0.09 | 0.11 | 0.20 | 0.15 | 0.35 | 0.00 | 0.06 | 0.06 | 0.17 | 0.23 |
| F | 0.08 | 0.24 | 0.33 | 0.20 | 0.53 | 0.00 | 0.20 | 0.20 | 0.24 | 0.43 |
| G | 1.82 | 1.78 | 3.60 | 3.18 | 6.78 | 0.00 | 1.61 | 1.61 | 3.66 | 5.27 |
| H | 0.13 | 0.57 | 0.71 | 0.60 | 1.31 | 0.00 | 0.25 | 0.25 | 0.70 | 0.95 |
| I | 0.95 | 0.20 | 1.15 | 1.45 | 2.60 | 0.00 | 0.22 | 0.22 | 1.67 | 1.89 |
| J | 0.19 | 0.28 | 0.47 | 0.37 | 0.84 | 0.00 | 0.20 | 0.20 | 0.42 | 0.62 |
| K | 0.20 | 0.33 | 0.53 | 0.45 | 0.98 | 0.00 | 0.20 | 0.20 | 0.52 | 0.72 |
| L | 0.10 | 0.06 | 0.16 | 0.13 | 0.28 | 0.00 | 0.03 | 0.03 | 0.15 | 0.18 |
| M-N | 0.26 | 1.71 | 1.97 | 1.15 | 3.12 | 0.00 | 1.24 | 1.24 | 1.32 | 2.56 |
| O | 0.01 | 0.19 | 0.21 | 0.15 | 0.35 | 0.00 | 0.10 | 0.10 | 0.17 | 0.27 |
| P | 0.23 | 0.15 | 0.38 | 0.44 | 0.82 | 0.00 | 0.15 | 0.15 | 0.51 | 0.66 |
| Q86 | 0.37 | 0.52 | 0.89 | 0.40 | 1.29 | 0.00 | 0.88 | 0.88 | 0.46 | 1.35 |
| Q87-88 | 17.37 | 0.22 | 17.59 | 0.02 | 17.61 | 32.64 | 0.38 | 33.02 | 0.02 | 33.04 |
| R-U | 1.59 | 0.48 | 2.07 | 0.16 | 2.23 | 0.00 | 0.34 | 0.34 | 0.19 | 0.53 |
| Total | 25.32 | 8.83 | 34.16 | 12.06 | 46.21 | 32.64 | 6.83 | 39.47 | 13.87 | 53.33 |
A: agriculture, forestry and fishing; B: mining and quarrying; C: manufacture; D: electricity, gas, steam and air conditioning supply; E: water collection, treatment and supply and waste collection; F: construction; G: wholesale and retail trade; H: transport; I: accommodation and food service activities; J: information and communication; K: financial and insurance activities; L: real estate activities; M-N: professional, scientific and technical activities, administrative and support service activities; O: public Administration, defence; P: education; Q86: health services; Q87-88: social work activities; R-U: arts, entertainment and recreation, other service activities, activities of household and extra-territorial organizations and bodies.
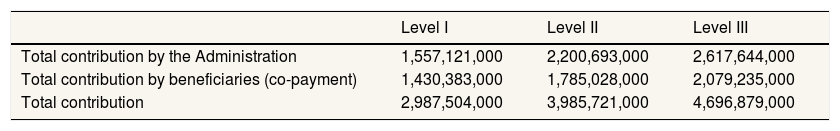
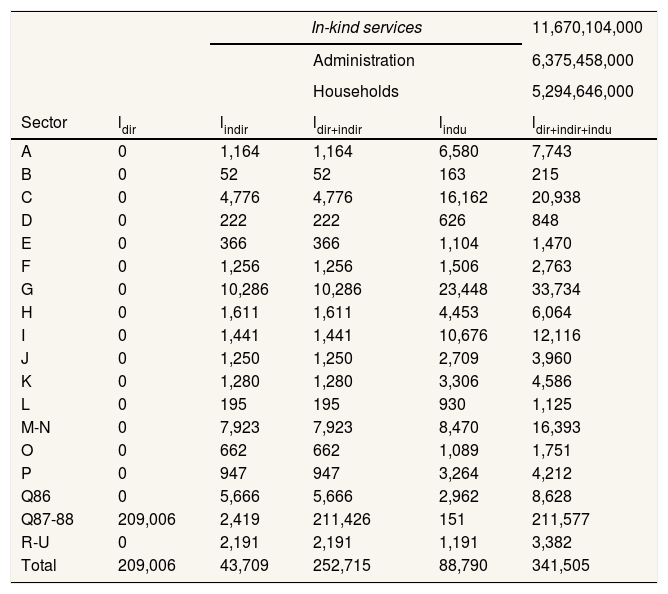
Table 4 shows the distribution of costs between the public Administration and beneficiaries assuming that the dependency assistance was exclusively in-kind services and no cash benefits were applied. The total dependency cost results in 11,670,104,000€ by adding the last row for dependency levels I, II and III, which means increasing the total cost in Table 1 (7,205,430,890€) by almost 62%. Based on such rising, Table 5 shows the employment considering that dependency benefits were exclusively offered via in-kind services. Both the Administration (6,375.46 million euros) and the dependent households (5,294.65 million euros) would therefore pay for the social work services demanded. As mentioned above, the consumption basket of the dependent households would include exclusively the expenditure in social work services, which would generate 341,505 jobs (209,006 direct, 43,709 indirect and 88,790 induced), this is, an increase of 74.53% in the number of jobs presented in Table 2.
Contributions by dependency level (euros 2012).
| Level I | Level II | Level III | |
|---|---|---|---|
| Total contribution by the Administration | 1,557,121,000 | 2,200,693,000 | 2,617,644,000 |
| Total contribution by beneficiaries (co-payment) | 1,430,383,000 | 1,785,028,000 | 2,079,235,000 |
| Total contribution | 2,987,504,000 | 3,985,721,000 | 4,696,879,000 |
Sensitivity analysis. Employment linked to dependent households (2012).
| In-kind services | 11,670,104,000 | ||||
|---|---|---|---|---|---|
| Administration | 6,375,458,000 | ||||
| Households | 5,294,646,000 | ||||
| Sector | ldir | lindir | ldir+indir | lindu | ldir+indir+indu |
| A | 0 | 1,164 | 1,164 | 6,580 | 7,743 |
| B | 0 | 52 | 52 | 163 | 215 |
| C | 0 | 4,776 | 4,776 | 16,162 | 20,938 |
| D | 0 | 222 | 222 | 626 | 848 |
| E | 0 | 366 | 366 | 1,104 | 1,470 |
| F | 0 | 1,256 | 1,256 | 1,506 | 2,763 |
| G | 0 | 10,286 | 10,286 | 23,448 | 33,734 |
| H | 0 | 1,611 | 1,611 | 4,453 | 6,064 |
| I | 0 | 1,441 | 1,441 | 10,676 | 12,116 |
| J | 0 | 1,250 | 1,250 | 2,709 | 3,960 |
| K | 0 | 1,280 | 1,280 | 3,306 | 4,586 |
| L | 0 | 195 | 195 | 930 | 1,125 |
| M-N | 0 | 7,923 | 7,923 | 8,470 | 16,393 |
| O | 0 | 662 | 662 | 1,089 | 1,751 |
| P | 0 | 947 | 947 | 3,264 | 4,212 |
| Q86 | 0 | 5,666 | 5,666 | 2,962 | 8,628 |
| Q87-88 | 209,006 | 2,419 | 211,426 | 151 | 211,577 |
| R-U | 0 | 2,191 | 2,191 | 1,191 | 3,382 |
| Total | 209,006 | 43,709 | 252,715 | 88,790 | 341,505 |
A: agriculture, forestry and fishing; B: mining and quarrying; C: manufacture; D: electricity, gas, steam and air conditioning supply; E: water collection, treatment and supply and waste collection; F: construction; G: wholesale and retail trade; H: transport; I: accommodation and food service activities; J: information and communication; K: financial and insurance activities; L: real estate activities; M-N: professional, scientific and technical activities, administrative and support service activities; O: public Administration, defence; P: education; Q86: health services; Q87-88: social work activities; R-U: arts, entertainment and recreation, other service activities, activities of household and extra-territorial organizations and bodies.
To our knowledge, this is the first study using input-output techniques to assess the impact on employment of the DA in 2012 after the structural reform also introduced in 2012. As mentioned before, the input-output framework had previously been applied to estimate the return of employment from the services provided by the NSD.12 In that approach, the demand shock was caused by current expenditures on services and by construction investment, giving results at the aggregated level and for a 6-sector classification. Alternatively, our model deals with a demand shock produced by the household expenditure on consumption funded with the dependency costs from the public Administration and the dependent households. The results are also presented both at the aggregated and sectoral levels, but in our paper, a more detailed classification of 18 sectors is used. Moreover, the extended model presented allows capturing the distinction between the two types of benefits included in the DA. The final effect on direct, indirect and induced employment that is caused by increases in income (due here to cash benefits) differs significantly from the one that is produced by a higher expenditure on a specific sector (social work activities, in this case). Thus, our results reveal that the impact on employment of every million euros allocated for in-kind services is 15.41% larger than using cash benefits.
According to our study, the DA is estimated to have created 195,668 net jobs in Spain (direct, indirect and induced) in 2012. This amount of employment exceeds by 46% those 137,000 jobs on average estimated by previous investigations.9,29 However, it is far below those 452,753 jobs appearing on the economic report by NSD, which included the direct jobs (262,735), the induced jobs in construction and new equipment (20,000), the indirect jobs created in service supplying activities (40,000), the legalization of illicit work (80,000) and other uncategorized jobs (50,000), but left aside 115,000 jobs related to the informal care sector.11
Two-third of the 195,668 jobs created in 2012 are linked to the expenditure on in-kind services, while the other third returns from cash benefits, which reached 51.32% of total benefits (44.6% for informal care).9 The ratio between in-kind services and cash benefits is similar to the ratio between direct and induced jobs, while the indirect employment depending on cash benefits accounts for 40% of the total employment. In addition, the labour composition has shifted from permanent to part-time contracts since the 2012 reforms, causing the permanent contracts to drop by 6%. As a consequence of this, part-time contracts currently account for 30% of the total contracts, with an 80% degree of feminisation.13,30
The initial development of the DA included a monthly benefit of 400€ on average for all the dependency levels, plus the payment of the caregiver payroll contribution on the part of the public Administration.10 This measure meant, as regards informal care legalisation purposes, increasing contributors to Social Security by more than 170,000 (90% female) as part of the special contribution program for professional careers. However, as 2012 reforms included rescinding the public Administration payment of the caregiver Social Security contributions, roughly 146,000 carers left the contribution program mentioned above,9 turning the initial increase in Social Security contributors into a mere register of professional careers.13
As stated in the results, cash benefits prove less efficient than in-kind services regarding job creation. Nevertheless, unequal access to dependency services explains the widespread application of the former.31 In essence, uneven probabilities to enter the system12 together with long waiting times to be qualified,32 which is commonly referred in the DA as the “dependency limbo”,9,33 constitute the main barriers of entry that give rise to such inequality.
While the strength of our analysis lies in presenting significant results of the aggregated and sectoral employment linked to dependency costs, two limitations should be noted. Firstly, the estimation of costs was obtained from previous research to allow contrasting the impact results as regards the type of benefits. Secondly, income elasticities of consumption have not been considered in our model, which means that the consumption propensities of dependent households are unaffected by the rise in income caused by cash benefits.
The DA was implemented during the most outstanding prosperity phase of the Spanish economy, which helped to create a substantial supply of services that led to heightened expectations not only in the assistance of the dependent population but also in terms of employment and fiscal returns from the investment in social services.10 However, the real situation is far from what it was expected, leaving a significant percentage of potential dependents and workers in the so-called “dependency limbo”. Furthermore, even if all DA benefits had been provided exclusively via in-kind services, total dependency costs would have reached 1.12% of GDP, which is still far from the 3% of GDP that pioneering countries in healthcare such as Sweden, Norway and the Netherlands allocate for long-term care.34 Interestingly, despite the significant spending gap with those countries, most health services in Spain are currently providing chronic disease care for elderly patients.3 Although the lack of public information hinders notably accurate analysis, nowadays it is widely perceived that cash benefits, which were originally implemented to replace in-kind services, have failed in legalising informal care employment and in job creation. All these factors combined have given rise to the so-called “low-cost DA”,30 which denotes the need for synergies that allow meeting dependents’ requirements in such a way as to further result in positive externalities for the Spanish economy.3
In summary, dependency costs are supposed to maintain a positive relation to employment, since the former funds a growing demand for consumption and, in turn, more jobs improve the government budget via taxes and payroll contributions. Hence, a broader development of social and healthcare services may undoubtedly become a prime factor in job creation.3 Nevertheless, more updated information and research would be needed to redress a dependency legislation that has proven inefficient, mainly due to the consequences of the financial crisis of 2008. Thus, an increasing demand for social and healthcare services urges the DA to be reinstated to meet the high expectations created a decade ago.
Different studies have evaluated the effect in terms of employment and fiscal return derived from the adoption of the Dependency Act. However, none of the previous investigations has assessed the impact on employment when considering both the effective development of the Dependency Act and the reforms introduced in 2012.
What does this study add to the literature?Our study offers insight into the number of direct, indirect and induced jobs resultant from the effective development of the Dependency Act, depending on whether cash benefits or in-kind services are applied. Given that cash benefits prove less efficient than in-kind services for job creation, we introduce a further debate about the loss of potential jobs due to overusing cash benefits, contrary to what was envisaged in the Dependency Act.
David Cantarero.
Transparency declarationThe corresponding author on behalf of the other authors guarantee the accuracy, transparency and honesty of the data and information contained in the study, that no relevant information has been omitted and that all discrepancies between authors have been adequately resolved and described.
Authorship contributionsF. Bermejo Patón and R. Del Pozo Rubio have conceived this study. R. Del Pozo Rubio has conducted the literature review and F. Bermejo Patón has carried out the estimates. F. Bermejo Patón and R. Del Pozo Rubio have written the first version of the manuscript, reviewed the different versions of it and accepted the final version. F. Bermejo Patón and R. Del Pozo Rubio are responsible for the overall content of the manuscript.
FundingThis study has been funded by the XXXIII Edition Grant Spanish Association of Health Economics and Bayer Health Care and the Spanish State Programme of R+D+I (ECO2013-48217-C2-2-R).
Conflicts of interestsNone.


