

To describe the recent trends in Parkinson's disease mortality in Mexico during 2000-2020.
MethodThe adjusted mortality rate per 100,000 inhabitants was calculated using the direct method and the world standard population. Trend analysis was performed with the Joinpoint software.
ResultsThe average mortality rate was 1.26/100,000 inhabitants (SD: 0.09), and males showed higher mortality than females (M/F ratio=1.60). Older individuals ≥70 years old showed higher mortality rates than the rest of the age groups. During the period of study, a significant increase in mortality was observed from 2000 to 2005, while from 2005 to 2020 no significant trend was observed in all the studied groups.
ConclusionsIn Mexico, males and older individuals showed the highest mortality rates. The socioeconomic regions with high levels of wellness showed the highest mortality rates levels. Parkinson's mortality rate has remained constant since 2005 in Mexico.
Describir las tendencias recientes de la mortalidad por enfermedad de Parkinson en México durante 2000-2020.
MétodoLa tasa de mortalidad ajustada por 100.000 habitantes se calculó mediante el método directo y usando población estándar mundial. El análisis de tendencias se realizó con el programa Joinpoint.
ResultadosLa tasa de mortalidad promedio fue de 1,26/100.000 habitantes (DE: 0,09) y los hombres presentaron mayor mortalidad que las mujeres (relación H/M=1,60). Los individuos ≥70 años presentaron las mayores tasas de mortalidad que el resto de los grupos de edad. Durante el periodo de estudio se observó un aumento significativo de la mortalidad de 2000 a 2005, mientras que de 2005 a 2020 no se observó una tendencia significativa.
ConclusionesLos hombres y de mayor edad mostraron las tasas más altas de mortalidad. Las regiones socioeconómicas con mayor nivel de bienestar presentaron las tasas más altas de mortalidad. La tasa de mortalidad por enfermedad de Parkinson se mantuvo constante desde 2005 en México.
Nowadays, neurological disorders are the leading source of disability in the world, and Parkinson's disease (PD) is the fastest-growing of these disorders.1 This disease is characterized by a progressive neurodegeneration that produces movement alterations such as tremor, rigidity, bradykinesia, and postural instability, in addition, it produces other non-motor alterations such as eye movement sleep disorder, anosmia, constipation, and depression.2
When PD was described for the first time, it was a rare disease, however, through the years has increased considerably. The recent Global Burden of Disease Study has found that age-standardized prevalence rates of PD have increased in each region of the world in the last few years. Other studies have estimated that the number of PD cases will double, from 7 million approximately in 2015 to 13 million in 2040 some authors consider that this data resembles a pandemic.3–5 This disease produces considerable psychological distress to the patients and familial caregivers, which reduces significantly quality of life in all dimensions, especially in physical function and mental health domains.6 On the other hand, the economic costs associated are considerably high, only in USA the estimated cost was of 51.9 billion (direct medical costs of $25.4 billion and $26.5 billion in indirect and non-medical costs).7 Unfortunately, estimations of economic cost in developing countries are scarce but it is possible that also implies high costs like in the developed countries.
Mexico is considered a developing country that is facing a demographic transition, it is expected that the adult population of 60 years and older will triple, going from 6.3% in 2010 to almost 23% by 2050.8 The consequences of this transition probably will be an increase in prevalence and mortality due to some diseases such as PD. Concerning the prevalence of PD in Mexico, previous studies had reported an overall incidence rate of 37.92/100,000 (incidence density of 9.48/100,000 person-years) for the 2014-2017 period, but when stratified by age, in the ≥65 population it was 313.94/100,000. The incidence rate was higher in men than in women (42.22 vs. 34.78/100,000, respectively).9
Considering that PD is more frequent in older age, and due to the scarcity of mortality studies of PD, the objective of this study is to describe PD related mortality according to gender, different age groups, and socioeconomic regions (SR) in Mexico from 2000 to 2020.
MethodDataAnnual PD deaths from 2000 to 2020 were obtained from the official web of the National Institute of Statistical and Geography (INEGI in Spanish) which is freely available.10 The code used for the selection of PD deaths for all years was G20 (Parkinson's disease) of the International Classification of Disease 10 (ICD-10). The population data were obtained from the population census of the years 2000, 2005, 2010, 2015, and 2020, published also by the INEGI, for the rest of the years there are not data about the population in the INEGI, so they were estimated for linear interpolation.
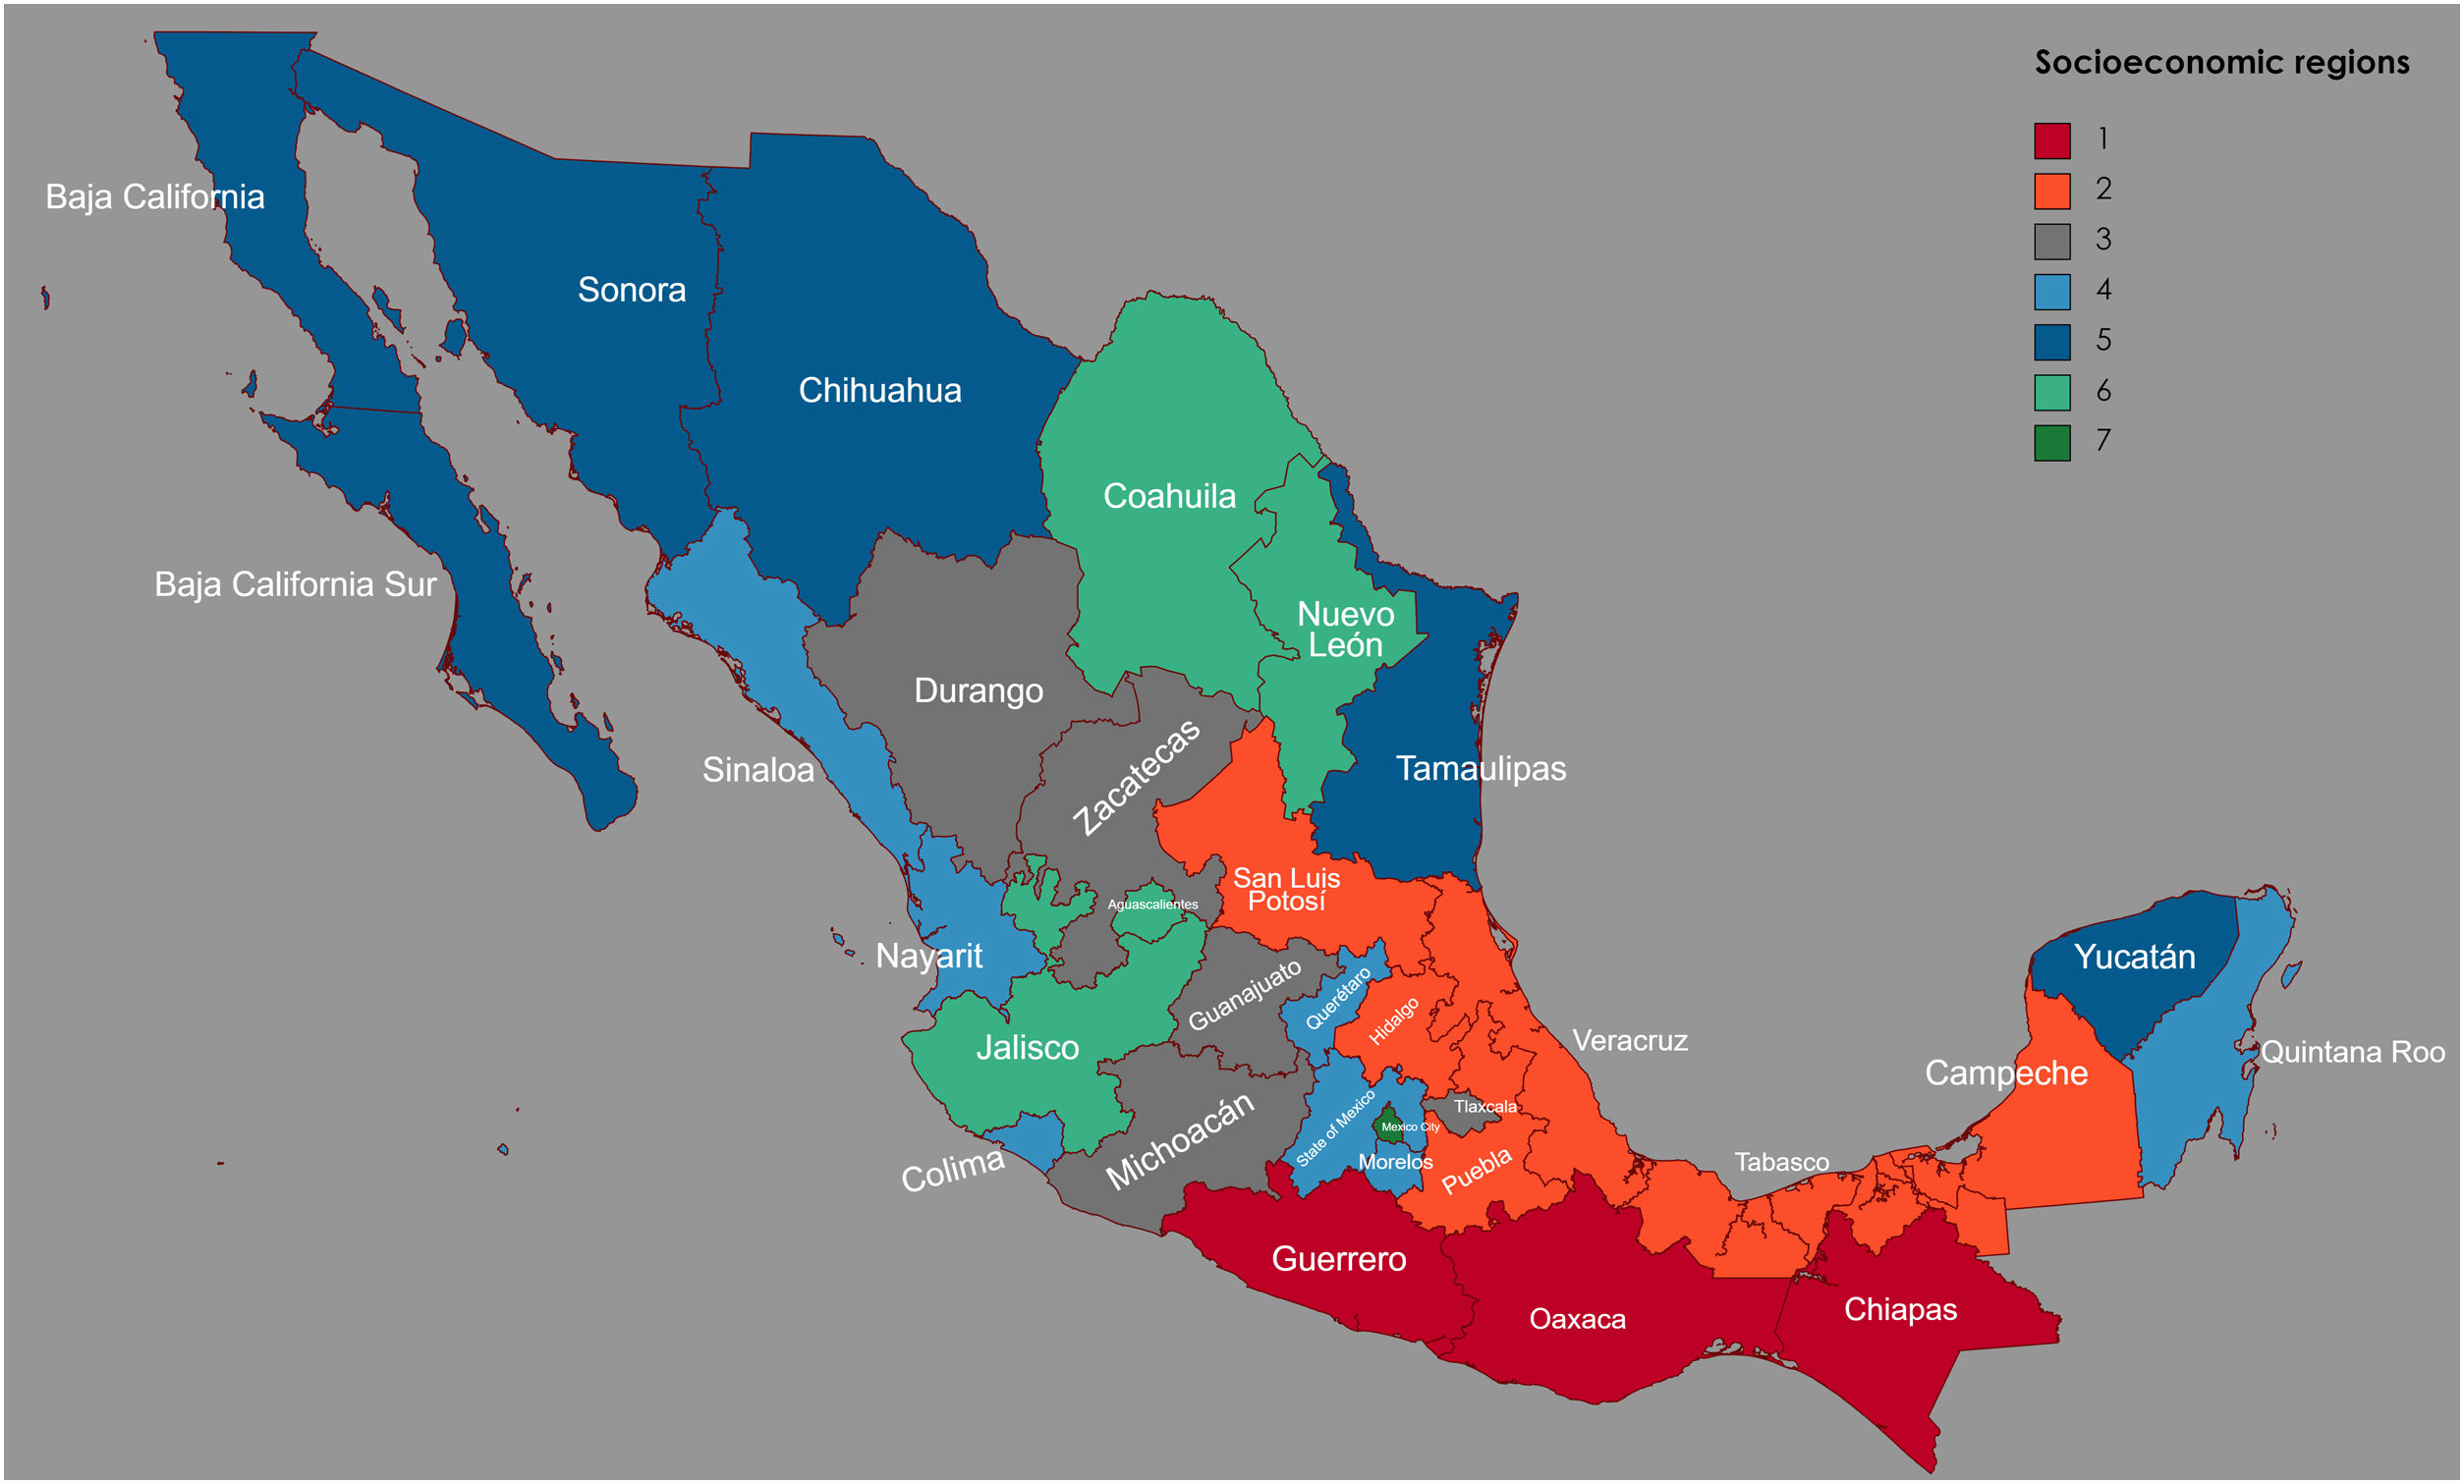
Annual mortality rateThis was calculated by the direct method using the world standard population and expressed per 100,000 inhabitants. Mortality rates were grouped by gender, five age groups (all ages, ≥40, 50-59, 60-69, and ≥70 years old), and SR. These SR have been classified by the INEGI considering the following criteria: infrastructure, housing quality, housing equipment, overcrowding, health, education, and employment. The states that comprise each region have similar socioeconomic characteristics, so that, the level of well-being increases with the level of the region which ranges from 1 to 7. The geographical location and the states that comprise each region in Mexico are presented in Figure 1. The differences among the groups were tested with student-t test and ANOVA as appropriate.

Trend analysis for studied groups was performed with Joinpoint regression, also known as segmented regression. For this, the Joinpoint program version 4.9.1.0, which is available through the Surveillance Research Program of the United States National Cancer Institute,11 was used. This technique detects points where a statistically significant change (p<0.05) in PD death trends occurred, using a series of permutation tests, with Bonferroni adjustment for multiple comparisons. The process starts with the minimum number of Joinpoint (e.g., 0 Joinpoint, which is a straight line) and tests whether more Joinpoint are statistically significant and must be added to the model. In addition, annual percentage change (APC), it means, the increase or decrease in the percentage of adjusted mortality rates with its significance (the p-value) also was calculated by this same software. In this study, first, the trend in mortality was estimated for all studied period, thereafter, changes from 2000 to 2020 was determined. The maximum number of points established in the software was three.
Ethical considerationsThis is a retrospective study that uses public domain data, so the ethical committee approbation was not requested.
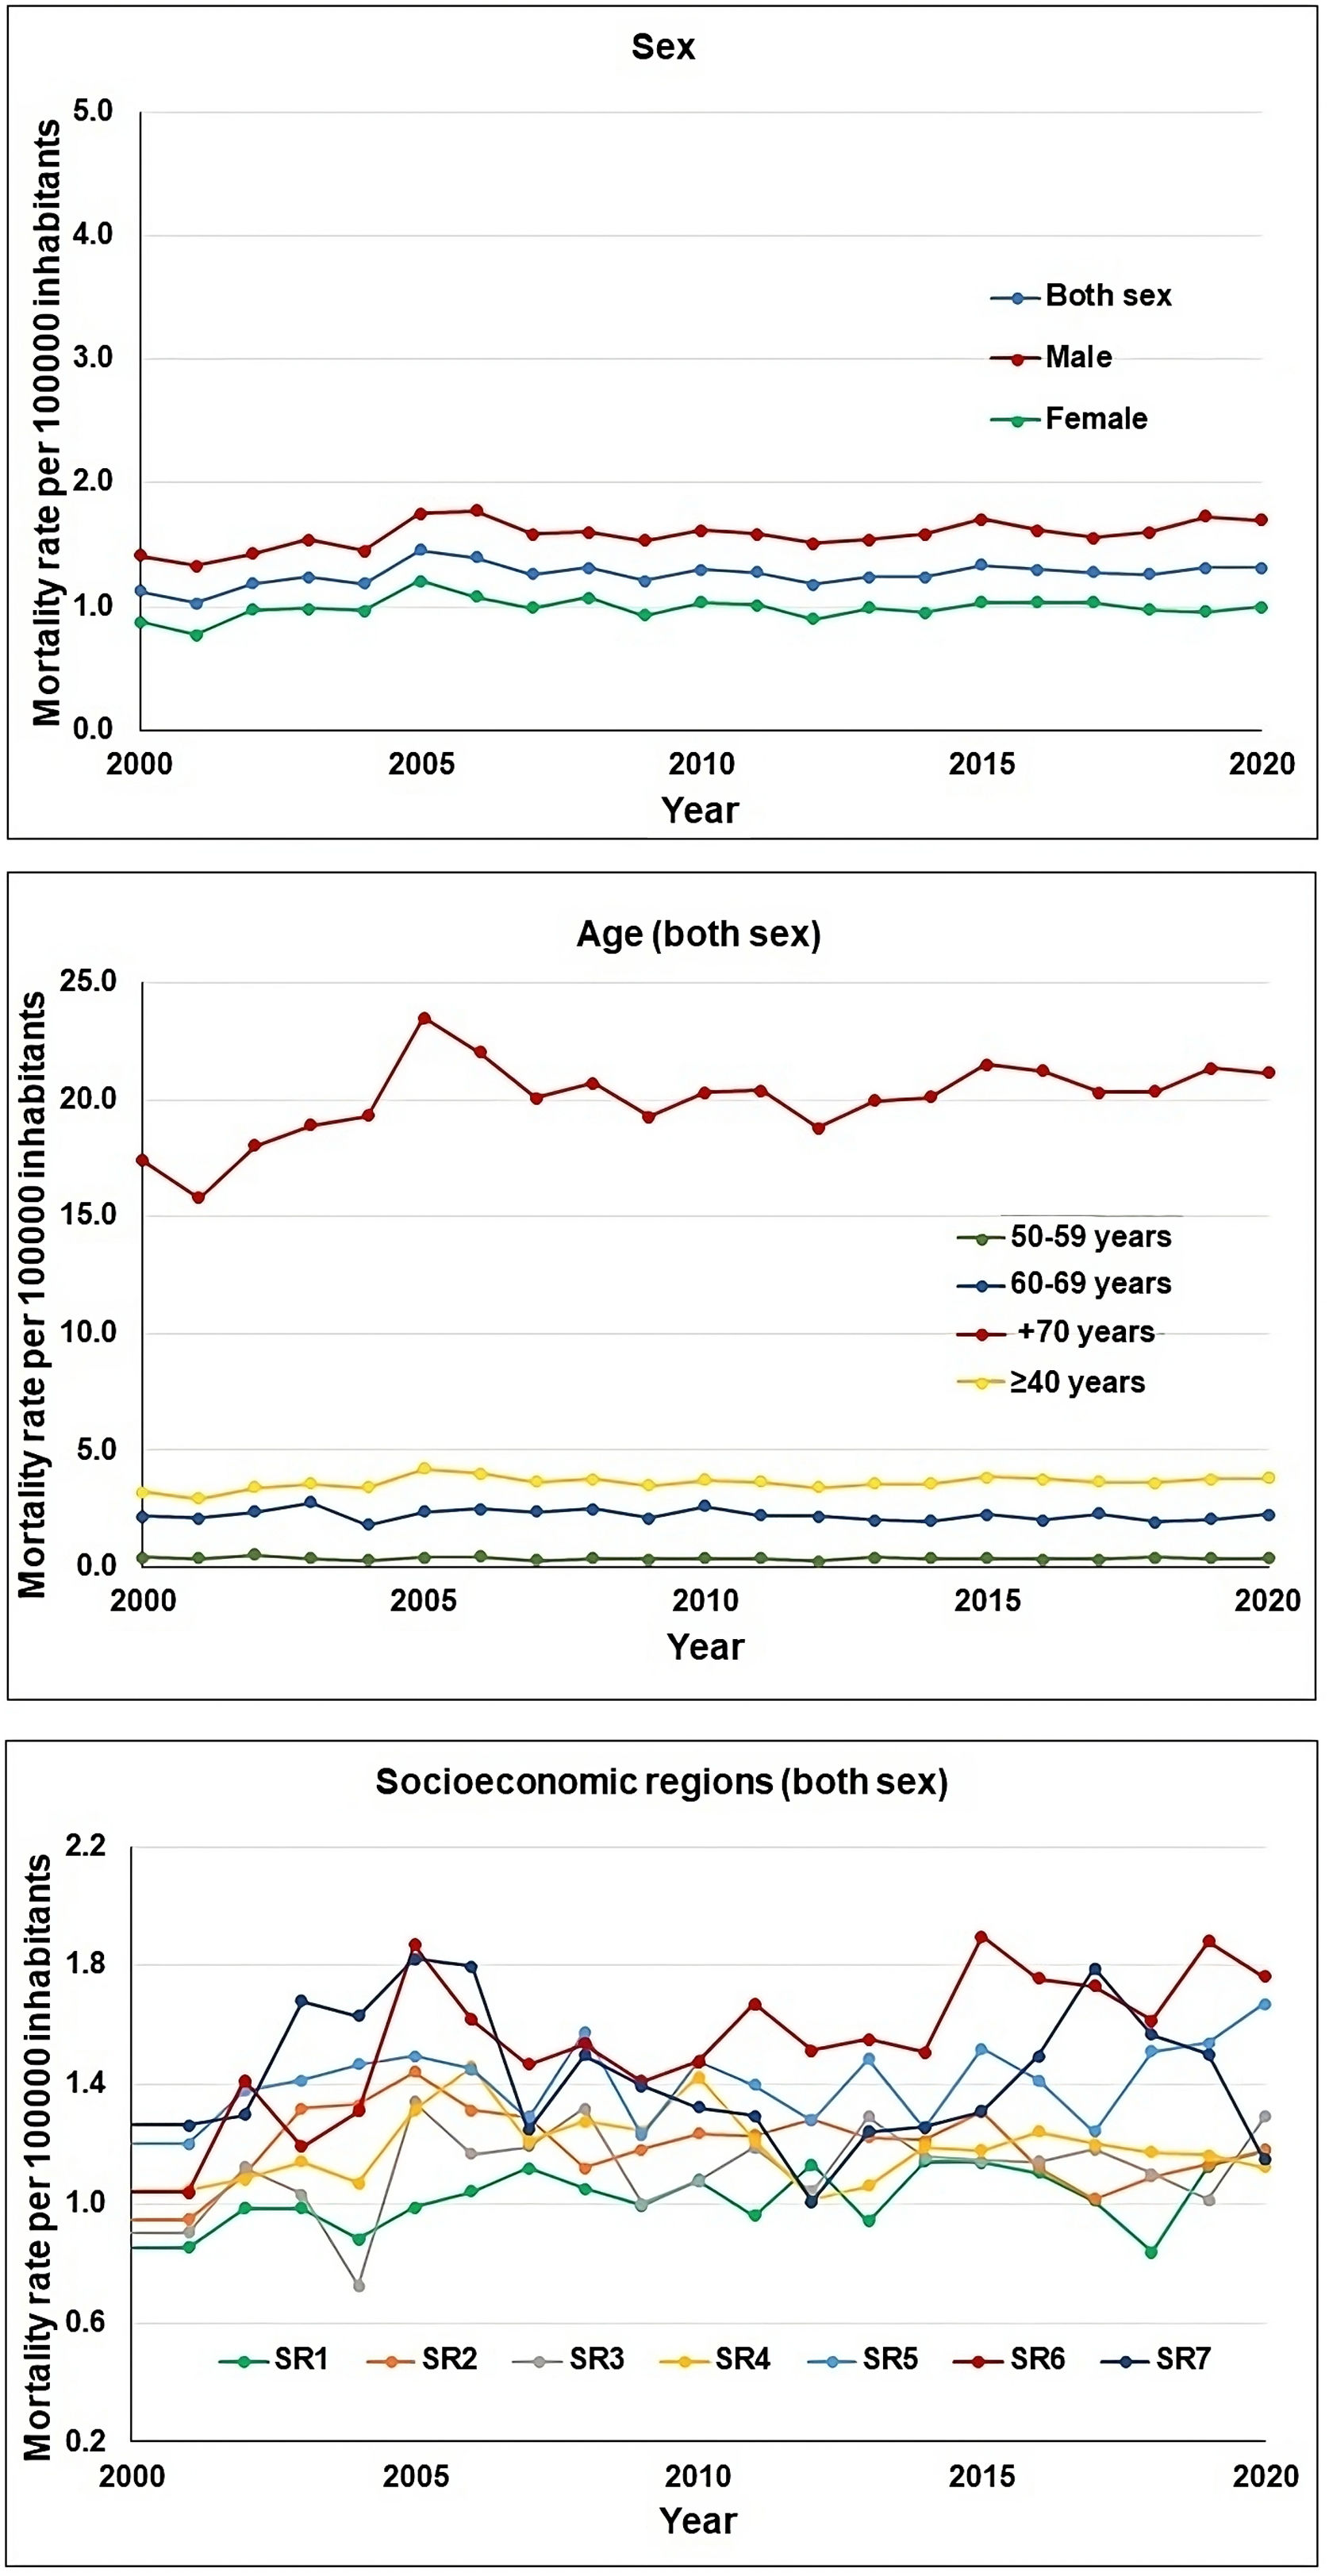
ResultsDuring the studied period, a total of 24,137 deaths due to PD occurred in Mexico, this represents 0.19% of all deaths (12,538,316). It should be noted that the main causes of death in Mexico are cardiovascular disease. The number of deaths due to PD was higher in males than females (13,801 vs. 10,334, respectively). The average adjusted mortality rate for both genders was 1.26/100,000 inhabitants (95% confidence interval [95%CI]: 1.21-1.30), ranging from 1.12/100,000 inhabitants in 2000 year, until 1.31/100,000 inhabitants in 2020 year. Males showed the highest mortality rate than females with an average of 1.58/100,000 (95%CI: 1.52-1.63), which ranged from 1.41/100,000 inhabitants in 2000 year, until 1.69/100,000 inhabitants in 2020 year (Table 1 and Fig. 2). The male/female ratio was 1.60.
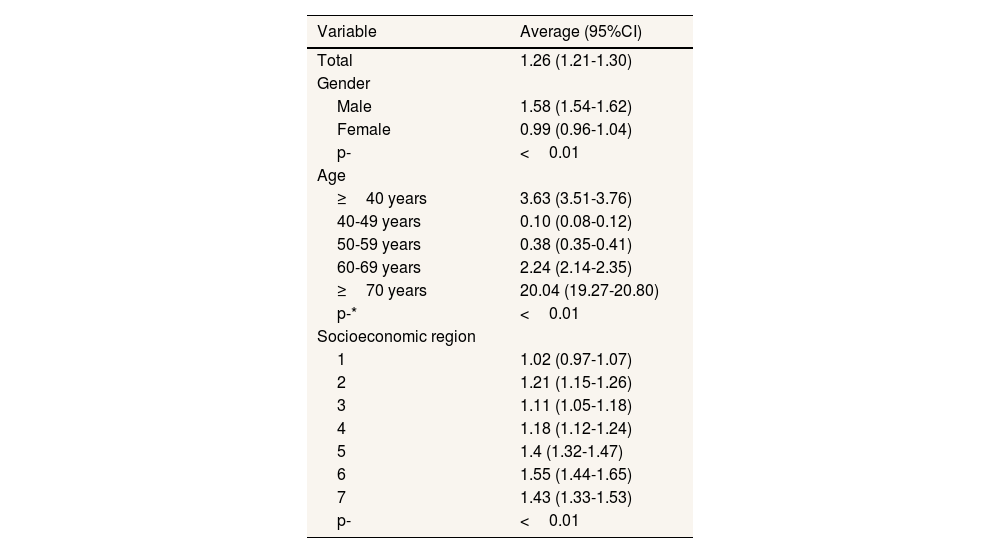
Adjusted mortality rate for Parkinson's disease in Mexico 2000-2020 (rates per 100,000 inhabitants).
| Variable | Average (95%CI) |
|---|---|
| Total | 1.26 (1.21-1.30) |
| Gender | |
| Male | 1.58 (1.54-1.62) |
| Female | 0.99 (0.96-1.04) |
| p- | <0.01 |
| Age | |
| ≥40 years | 3.63 (3.51-3.76) |
| 40-49 years | 0.10 (0.08-0.12) |
| 50-59 years | 0.38 (0.35-0.41) |
| 60-69 years | 2.24 (2.14-2.35) |
| ≥70 years | 20.04 (19.27-20.80) |
| p-* | <0.01 |
| Socioeconomic region | |
| 1 | 1.02 (0.97-1.07) |
| 2 | 1.21 (1.15-1.26) |
| 3 | 1.11 (1.05-1.18) |
| 4 | 1.18 (1.12-1.24) |
| 5 | 1.4 (1.32-1.47) |
| 6 | 1.55 (1.44-1.65) |
| 7 | 1.43 (1.33-1.53) |
| p- | <0.01 |
95%CI: 95% confidence interval.

Individuals ≥70 years old had the highest mortality rate with an average of 20.04/100,000 inhabitants (95%CI: 19.27-20.87), ranging from 17.39/100,000 inhabitants in the 2000 year, to 21.17/100,000 inhabitants (Table 1 and Fig. 2). On the contrary, individuals 40-49 years showed a minor mortality rate: 0.10/100,000 individuals (95%CI: 0.08-0.12).
According to the SR, mortality was higher in the SR 6 (1.55/100,000 inhabitants) and lesser in the SR 1 (1.02/100,000 inhabitants) (Table 1). In the first SR, mortality ranges from 1.25/100,000 in the 2000 year to 1.76/100,000 inhabitants in the 2020 year, and the later, it ranges from 0.90/100,000 inhabitants in the 2000 year to 1.18/100,000 inhabitants in the 2020 year (Fig. 2).
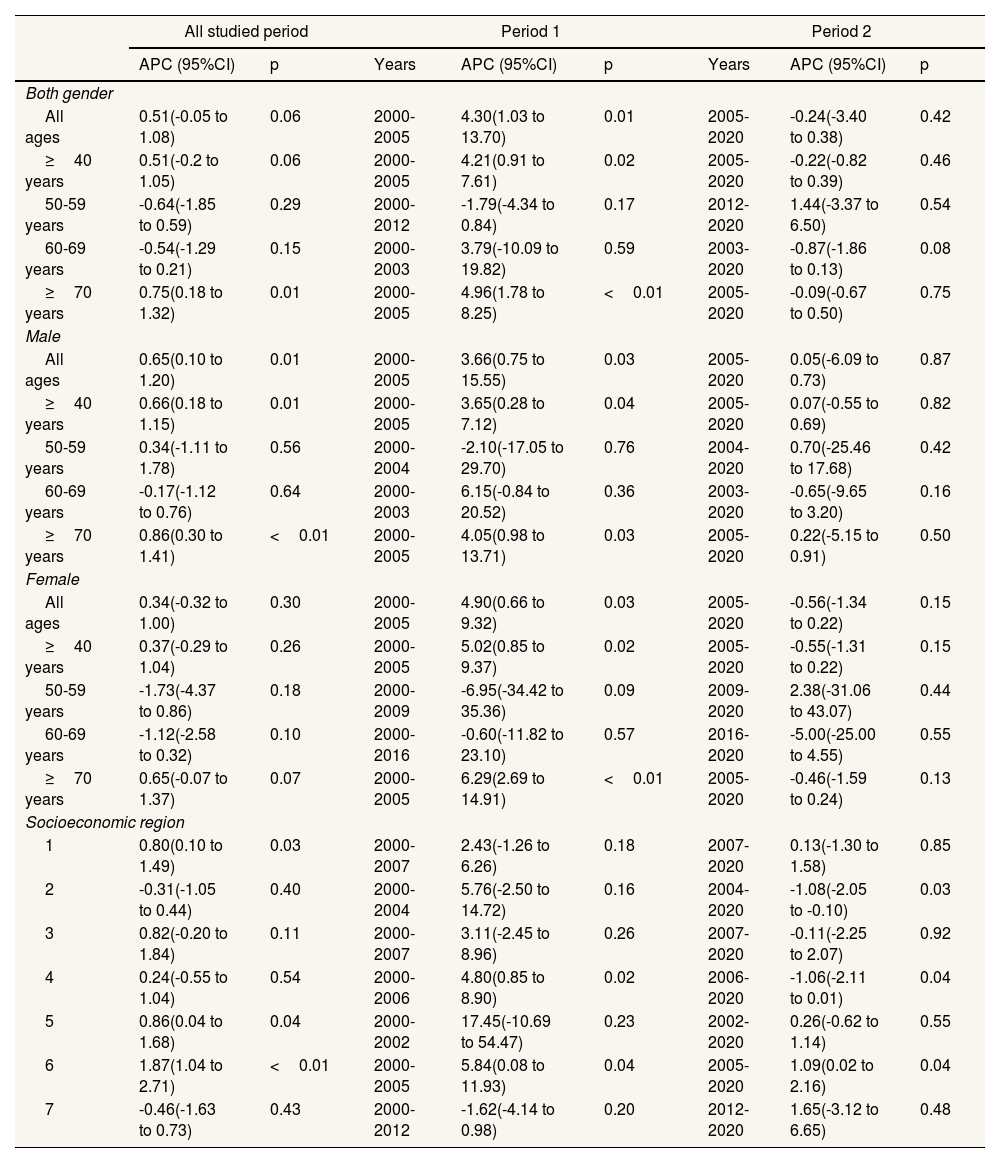
Trend analysis showed that no significant trend in mortality was observed during all studied period (p=0.06); however, males do present a significant increase in mortality rate with an APC value of 0.65 (p=0.01). According to the age groups, individuals ≥70 years old (both genders) showed a significant increase in mortality rates with an APC value of 0.75 (p=0.01). Another group that showed a significant increase in mortality during all period studied was males ≥70 years old with an APC value of 0.86 (p<0.01). Females of all age groups do not show significant trend during all studied period (Table 2). On the other hand, the SR that showed a significant trend during all studied period were 1, 5, and 6, with APC values of 0.80 (p=0.03), 0.86 (p=0.04), and 1.87 (p<0.01), respectively.
Trends in Parkinson's disease mortality in Mexico 2000-2020.
| All studied period | Period 1 | Period 2 | ||||||
|---|---|---|---|---|---|---|---|---|
| APC (95%CI) | p | Years | APC (95%CI) | p | Years | APC (95%CI) | p | |
| Both gender | ||||||||
| All ages | 0.51(-0.05 to 1.08) | 0.06 | 2000-2005 | 4.30(1.03 to 13.70) | 0.01 | 2005-2020 | -0.24(-3.40 to 0.38) | 0.42 |
| ≥40 years | 0.51(-0.2 to 1.05) | 0.06 | 2000-2005 | 4.21(0.91 to 7.61) | 0.02 | 2005-2020 | -0.22(-0.82 to 0.39) | 0.46 |
| 50-59 years | -0.64(-1.85 to 0.59) | 0.29 | 2000-2012 | -1.79(-4.34 to 0.84) | 0.17 | 2012-2020 | 1.44(-3.37 to 6.50) | 0.54 |
| 60-69 years | -0.54(-1.29 to 0.21) | 0.15 | 2000-2003 | 3.79(-10.09 to 19.82) | 0.59 | 2003-2020 | -0.87(-1.86 to 0.13) | 0.08 |
| ≥70 years | 0.75(0.18 to 1.32) | 0.01 | 2000-2005 | 4.96(1.78 to 8.25) | <0.01 | 2005-2020 | -0.09(-0.67 to 0.50) | 0.75 |
| Male | ||||||||
| All ages | 0.65(0.10 to 1.20) | 0.01 | 2000-2005 | 3.66(0.75 to 15.55) | 0.03 | 2005-2020 | 0.05(-6.09 to 0.73) | 0.87 |
| ≥40 years | 0.66(0.18 to 1.15) | 0.01 | 2000-2005 | 3.65(0.28 to 7.12) | 0.04 | 2005-2020 | 0.07(-0.55 to 0.69) | 0.82 |
| 50-59 years | 0.34(-1.11 to 1.78) | 0.56 | 2000-2004 | -2.10(-17.05 to 29.70) | 0.76 | 2004-2020 | 0.70(-25.46 to 17.68) | 0.42 |
| 60-69 years | -0.17(-1.12 to 0.76) | 0.64 | 2000-2003 | 6.15(-0.84 to 20.52) | 0.36 | 2003-2020 | -0.65(-9.65 to 3.20) | 0.16 |
| ≥70 years | 0.86(0.30 to 1.41) | <0.01 | 2000-2005 | 4.05(0.98 to 13.71) | 0.03 | 2005-2020 | 0.22(-5.15 to 0.91) | 0.50 |
| Female | ||||||||
| All ages | 0.34(-0.32 to 1.00) | 0.30 | 2000-2005 | 4.90(0.66 to 9.32) | 0.03 | 2005-2020 | -0.56(-1.34 to 0.22) | 0.15 |
| ≥40 years | 0.37(-0.29 to 1.04) | 0.26 | 2000-2005 | 5.02(0.85 to 9.37) | 0.02 | 2005-2020 | -0.55(-1.31 to 0.22) | 0.15 |
| 50-59 years | -1.73(-4.37 to 0.86) | 0.18 | 2000-2009 | -6.95(-34.42 to 35.36) | 0.09 | 2009-2020 | 2.38(-31.06 to 43.07) | 0.44 |
| 60-69 years | -1.12(-2.58 to 0.32) | 0.10 | 2000-2016 | -0.60(-11.82 to 23.10) | 0.57 | 2016-2020 | -5.00(-25.00 to 4.55) | 0.55 |
| ≥70 years | 0.65(-0.07 to 1.37) | 0.07 | 2000-2005 | 6.29(2.69 to 14.91) | <0.01 | 2005-2020 | -0.46(-1.59 to 0.24) | 0.13 |
| Socioeconomic region | ||||||||
| 1 | 0.80(0.10 to 1.49) | 0.03 | 2000-2007 | 2.43(-1.26 to 6.26) | 0.18 | 2007-2020 | 0.13(-1.30 to 1.58) | 0.85 |
| 2 | -0.31(-1.05 to 0.44) | 0.40 | 2000-2004 | 5.76(-2.50 to 14.72) | 0.16 | 2004-2020 | -1.08(-2.05 to -0.10) | 0.03 |
| 3 | 0.82(-0.20 to 1.84) | 0.11 | 2000-2007 | 3.11(-2.45 to 8.96) | 0.26 | 2007-2020 | -0.11(-2.25 to 2.07) | 0.92 |
| 4 | 0.24(-0.55 to 1.04) | 0.54 | 2000-2006 | 4.80(0.85 to 8.90) | 0.02 | 2006-2020 | -1.06(-2.11 to 0.01) | 0.04 |
| 5 | 0.86(0.04 to 1.68) | 0.04 | 2000-2002 | 17.45(-10.69 to 54.47) | 0.23 | 2002-2020 | 0.26(-0.62 to 1.14) | 0.55 |
| 6 | 1.87(1.04 to 2.71) | <0.01 | 2000-2005 | 5.84(0.08 to 11.93) | 0.04 | 2005-2020 | 1.09(0.02 to 2.16) | 0.04 |
| 7 | -0.46(-1.63 to 0.73) | 0.43 | 2000-2012 | -1.62(-4.14 to 0.98) | 0.20 | 2012-2020 | 1.65(-3.12 to 6.65) | 0.48 |
APC: annual percentage change; 95%CI: 95% confidence interval.
On the other hand, the Joinpoint regression technique detected that some groups presented just an inflection point during the studied period, so they presented periods with significant increase or decrease in mortality rates. In the case of males and females of all ages, they presented a significant increase from 2000 to 2005 with APC values of 3.66 and 4.90 respectively, for the rest of the period 2005 to 2020 no significant trend was observed. The following age groups, all ages, ≥40 years old and ≥70 years old, also present a significant increase from 2000 to 2005 with APC values of 4.30, 4.21 and 4.96, respectively; the rest of the period, 2005 to 2020 do not present a significant trend. The SR 4 presented a significant increase from 2000 to 2006 with an APC value of 4.80 and a significant decrease from 2006 to 2020 with an APC value of -1.06. The SR 7 presented a significant decrease from 2005 to 2012 with an APC value of -6.50.
DiscussionCompared with the overall mortality in Mexico, PD mortality represented a minor proportion of all defunctions (0.19%) during the studied period. It is worth mentioning that the main causes of death in Mexico are cardiovascular disease,12 and neurodegenerative diseases such as PD are not among the top 10 causes of death.
Until now, this is the first study that describes the world-adjusted mortality rate of PD in Mexico. A recent meta-analysis describes the “crude mortality” rate worldwide, including Mexico,13 but no world-population-adjusted rate mortality is reported. Crude mortality has the disadvantage that it does not consider the age distribution in the population of each country.
Mortality due to PD in Mexico was lower than reported in developed countries and some Latin American countries. The causes of variations among countries are not clear and could be due to differences in the exposure to risk factors, such as pollution and pesticides, exposure to protective factors such as caffeine and tobacco, availability of treatment and health workforce, and different age distribution.14
As has been previously reported, PD mortality was higher in males than females, reinforcing the hormonal influence in the development of this disease. Endogenous estrogen produces an increase in levels of dopamine in the striatum, which could protect women from PD development.15
Age is among the main risk factors for PD, so is expected that when the population gets older it increases. This is the case in Mexico, which is experiencing a demographic transition. Previous studies in Mexico have reported a significant increase in the incidence of PD.16 However, contrary to expected, while our results of mortality rates just found a significant increase from 2000 to 2005, in the rest of the years no significant trend was observed. A possible explanation could be that new patients are receiving an appropriate treatment, so their life expectancy increases. Another possible explanation is that some regions of Mexico with low socioeconomic development, which are located mainly in the south of the country, had no appropriate health infrastructure and personnel for diagnosis and treatment, so mortality could be underestimated.
Among the different regions of Mexico, we observed significant differences in mortality rates, the higher values were in the SR 5, 6, and 7 which are characterized by industrial activities, and high levels of pollution. These are environmental factors that are associated with the development of PD.14 In addition, these regions have a better health infrastructure than the rest of SR, so several processes like diagnosis, treatment, and death registry could be more efficient, while than in SR 1 to 4 could be less efficient. Considering that the older population increased in the same proportion from 2000 to 2020 in all SR of Mexico, these factors could be explaining partly the differences in mortality among the SR of Mexico. Another factor that could explain partly these differences is the inaccuracy in data processing by regional offices of the INEGI. A difference in the processing of Parkinson's death is not discarded among the regions and could be due to differences in infrastructure. Although the data processing for cancer deaths is robust,17 there are no studies that evaluate the quality of data for other diseases like Parkinson. This last point could be a limitation of the present study.
Globally, trends in PD mortality are variable: European countries and the USA have shown a significant increase in their trends, while African countries do not show any trend.13 This data highlights the complexity of this disease in all aspects such as its cause, diagnosis, and therapy, so is important that each country continuously monitors the temporal evolution of this disease.
ConclusionsThe adjusted PD mortality rate was higher in males than females. PD mortality increased significantly during 2000–2005 and remained with no significant trend for the rest of the years studied.
Availability of databases and material for replicationThe data used an analyzed in the present study are available through a request from the corresponding author.
Parkinson's disease is a leading cause of disability and death around the world. Mortality is widely variable among the countries and developing countries had few reports about it.
What does this study add to the literature?A recent description of adjusted mortality rate of Parkinson's disease in Mexico, a developing country that is experiencing a demographic transition with an increase in the number of older individuals.
What are the implications of the results?The results suggest the development of strategies that reduce mortality due to Parkinson's disease in Mexico. International organizations and foundations can get a better picture of Parkinson's mortality around the world and be able to allocate resources effectively.
Juan Alguacil.
Transparency declarationThe corresponding author on behalf of the other authors guarantee the accuracy, transparency and honesty of the data and information contained in the study, that no relevant information has been omitted and that all discrepancies between authors have been adequately resolved and described.
Authorship contributionsM.L. Yeverino Gutiérrez: analysis and interpretation of the results, draft writing. M.R. González González: interpretation of the results and review of the draft. O. González Santiago: conception and design of the study, and review of the draft.
FundingNone.
Conflicts of interestNone.


