

To characterize the prevalence of physical activity in the population aged ≥16 years integrating sedentarism and physical inactivity.
MethodA cross-sectional study using data from the Galician Risk Behavior Data System (n=12,928) was conducted. The population was classified into four categories: physically active (active and non-sedentary), active but sedentary (active and sedentary), lightly active (inactive and non-sedentary), and extremely sedentary (inactive and sedentary). Prevalences were calculated for each category and a multinomial logistic regression model was fitted.
Results58.0% of the population was physically active and the remaining 42.0% presented some degree of sedentarism and/or physical inactivity. Men were more likely to be extremely sedentary. The risk of sedentarism decreased with age, and workers and/or students were prone to a higher risk of extreme sedentarism in comparison to those who reported other status. Extremely sendentary behaviors were also more common in people with higher educational levels, individuals living alone, residents of urban environments, and smokers.
ConclusionsJoint evaluation of sedentarism and physical inactivity provides a more comprehensive and realistic picture of population behaviors related with physical activity. Since sedentarism is the most prevalent behavior, this study recommends that interventions be conducted at work and at academic environments.
Caracterizar la prevalencia de actividad física en la población ≥16 años integrando sedentarismo e inactividad física.
MétodoSe realizó un estudio transversal con datos del Sistema de Datos de Conductas de Riesgo de Galicia (n=12.928). La población se clasificó en cuatro categorías: físicamente activa (activa y no sedentaria), activa pero sedentaria (activa y sedentaria), poco activa (inactiva y no sedentaria) y extremadamente sedentaria (inactiva y sedentaria). Se calcularon las prevalencias para cada categoría y se ajustó un modelo de regresión logística multinomial.
ResultadosEl 58,0% de la población era físicamente activa y el 42,0% restante presentaba algún grado de sedentarismo o inactividad física. Los hombres eran más propensos a ser extremadamente sedentarios. El riesgo de sedentarismo disminuía con la edad, y los trabajadores o estudiantes eran propensos a un mayor riesgo de sedentarismo extremo en comparación con los que declaraban otra condición. Los comportamientos extremadamente sedentarios también fueron más frecuentes en personas con niveles educativos más altos, personas que vivían solas, residentes en entornos urbanos y fumadores.
ConclusionesLa evaluación conjunta del sedentarismo y la inactividad física proporciona una imagen más completa y realista de los comportamientos de la población relacionados con la actividad física. Dado que el sedentarismo es el comportamiento más prevalente, este estudio recomienda que se realicen intervenciones en el ámbito laboral y académico.
Sedentary behaviors, defined as any walking behavior characterized by energy expenditure ≤1.5 metabolic equivalents (MET),1 are ever more frequent in a modern society in which digitalization has brought about major changes.2 Automation of daily chores during work and leisure time reduces the amount of physical activity compared to the past. Sedentarism is associated with a higher risk of all-cause and cardiovascular-disease mortality,3 and with the development of obesity, type-2 diabetes, hypertension, metabolic syndrome, and dyslipidemia.4
Results of the Eurobarometer indicate that since 20025 the prevalence of sedentarism in Europe has been steadily rising, and reached a figure of 45.8% in 2017. For study purposes, a sedentary person was defined as anyone who exceeded 4h 30min of sedentary behaviors, bearing in mind that the evidence shows that the risk of developing cardiovascular diseases or suffering from a cardiovascular event increases from this cut-point onwards.3 In the latest European Health Survey in Spain (EHSS) (which defines leisure-time sedentarism as not engaging in any physical exercise in the spare time but instead spending the time in a sedentary manner, reading, watching television, etc.), 40.3% of women and 32.3% of men reported being sedentary in leisure time.6 It should be stressed that most of this leisure sedentary time is spent in front of a screen, and that this behavior is associated with an increase in mortality, development of cardiovascular disease, and depression.3,7 This association could be partly due to the fact that watching TV could be related with other risky behaviors, such as the consumption of unhealthy foods8 and poor-quality sleep.9
The high prevalence of physical inactivity, construed as a level of physical activity lower than that recommended for optimal health, constitutes another great health problem. In the latest EHSS, 46.6% of men and 54.8% of women reported doing no physical exercise whatsoever on any day in the week.6 In the same way as sedentarism, physical inactivity can contribute to an unhealthy lifestyle; both are included among the main risk factors for non-transmissible diseases.10,11 However, a person can be sedentary and inactive at the same time, be only one of the two, or neither. Thus, in a study it was observed that people who did no physical activity and spent more than 4h a day sitting had a 1.5 times higher risk of dying from any cause compared to people who performed more than 420min of physical activity and spent less than 4h a day sitting.3
However, few information exists regarding the clustering effect of these two modifiable behaviors or the factors that can contribute to these risky behaviors. Given that these two behaviors commonly co-exist, we consider that it is important to evaluate them jointly. This would provide a more complete picture of the population's lifestyles and allows for the estimation of the higher-risk population. To our knowledge, few studies have made a joint evaluation of these behaviors in the adult population.12–14 The main aim of this study was to characterize the prevalence of physical activity in the population aged ≥16 years from a comprehensive perspective, by analyzing sedentarism and physical inactivity jointly; and to assess the sociodemographic characteristics associated with physical activity.
MethodThe data were sourced from the Galician Risk Behavior Data System (SICRI, Sistema de Información sobre Conductas de Riesgo), which conducts annual surveys of the Galician population aged ≥16 years. In 2014 and 2015, sedentarism in leisure time and in the workplace was evaluated, along with leisure time and non-leisure time physical activity. For analysis purposes, the data from both surveys (n=7874 and n=7908, respectively) were pooled, excluding persons who were unable to walk, those who for a period of 6 months or more faced limitations for performing usual activities for their age (n=2785), and professional sportsmen and women (n=69). We finally analyzed data on 12,928 individuals.
Data collection and classificationComputer-assisted telephone interviews were conducted. The data-collection instrument used was a purpose-designed questionnaire for the study and subsequently validated in an objective population sample. Detailed information about its design is available from www.sergas.es/Saude-publica/SICRI-2014 and www.sergas.es/Saude-publica/SICRI-2015.
Ethical approval by the Galician ethics committee was not necessary because this study was voluntary and anonymous, ensuring full confidentiality. The authors did not participate in data collection.
- 1)
Sedentarism
We collected data related to sedentary behaviors in two spheres: leisure time and work. Regarding leisure time, subjects were asked about the time spent seated (minutes) or lying down devoted to each of the following activities: watching television, using a computer, reading or listening to music, and travelling in a means of transport. If the person was gainfully employed, the following question was asked: “During your workday, do you spend most of the time seated?”, with four response options: always, almost always, almost never, or never.
To calculate the time spent in sedentary activities during leisure time, the time in minutes devoted to each activity was summed. To apply the classification of sedentarism, we considered leisure-time behavior, work, and the fact of being a student. The cut-point of 4h 30min5 was used for the classification of sedentary/non-sedentary. A person was defined as sedentary if he/she: 1) was gainfully employed and answered the questionnaire to the effect that he/she always or almost always spent the workday seated; 2) was a student (the assumption being that students spend at least 4h 30min engaged in sedentary behaviors); or 3) exceeded the cut-point of 4h 30min, regardless of his/her occupational status.
- 2)
Physical activity
Physical activity was evaluated in leisure time and other scenarios (including travel, domestic, work activities) using the Minnesota Leisure Time Physical Activity Questionnaire.15,16 For each of the activities performed during the week preceding the survey, we obtained the amount of time per day and the number of days per week devoted to it. By associating each activity with a number of METs,17 we then calculated each individual's weekly energy expenditure (summation of MET×hours/day×days/week of each activity). However, the information on the activities collected in the questionnaire was less detailed than in the study performed by Ainsworth et al.17 and therefore we worked with an average of METs in the activities collected in the study population. A person was classified as inactive in any case where his/her weekly energy expenditure was ≤1000kcal.18
- 3)
Joint classification
The classifications of sedentarism and physical inactivity grouped were four categories:19 physically active (active and non-sedentary), active but sedentary (active and sedentary), lightly active (inactive and non-sedentary), and extremely sedentary (inactive and sedentary).
The prevalences of each category were calculated, both overall and by the following sociodemographic characteristics: sex (male, female), age group (16-24, 25-44, 45-64, ≥65 years), occupational status (work, study, other), educational level (basic-primary education or less, medium-secondary education, higher-university), cohabitation (yes, no), residential environment (urban, semiurban, rural), smoking status (smoker, ex-smoker, never smoker), and weight status (underweight, normal, overweight, obesity).
Data analysis and synthesis of resultsThe sociodemographic characteristics associated with the level of physical activity were assessed using a multinomial logistic regression model including the joint classification of sedentarism and physical inactivity in four categories as the response variable, and the characteristics analyzed as the predictive variables. As the reference category, we used the first category, physically active. The relative risk ratios (RRR) for each category as compared with the reference category were calculated. The RRR of the variable is the exponential of the coefficient of that variable in the model (RRR=exp(beta)). This is, if X is a binary variable of the model (e.g., 0=unexposed, 1=exposed), the RRR is the ratio between the relative risk (RR) of the exposed and that of the unexposed, and the RR is the risk of being in a category of physical activity as compared with the risk of being in the reference category.
Both prevalences and RRR are shown accompanied by their 95% confidence intervals (95%CI). All statistical analyses were performed using Stata v16.
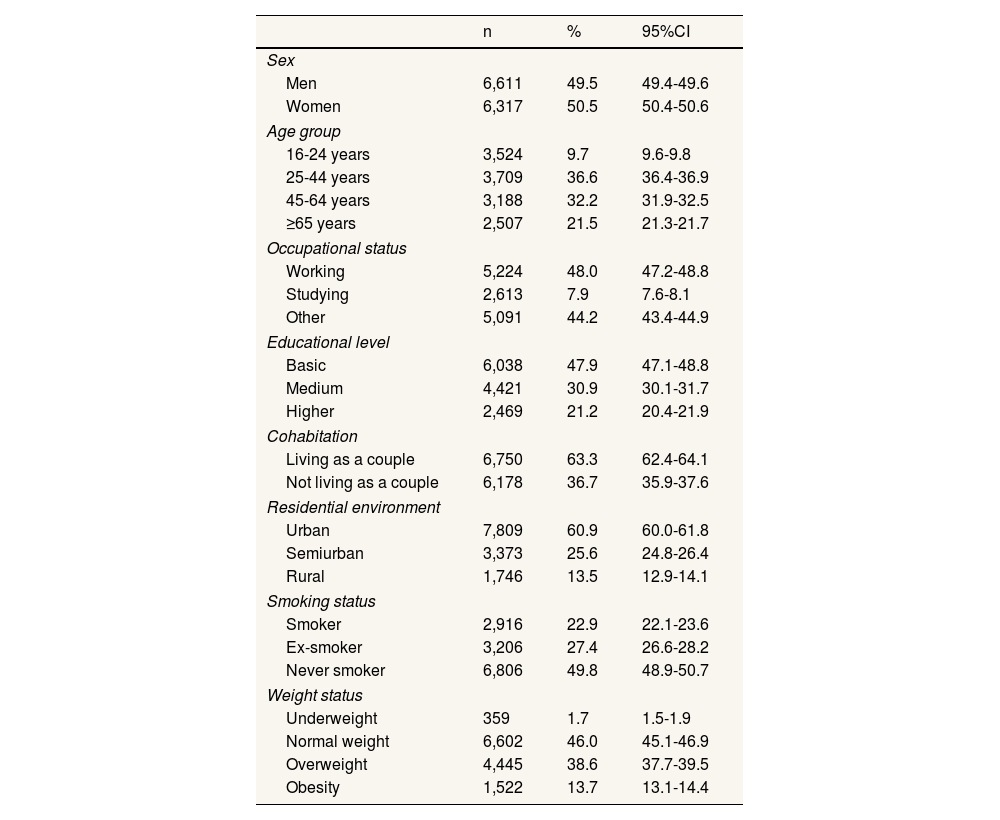
ResultsThe sociodemographic characteristics of the study population are shown in Table 1. As can be observed, 48.0% (95%CI: 47.2-48.8) of this population was gainfully employed and 7.9% (95%CI: 7.6-8.1) were students.
Characteristics of the study population.
| n | % | 95%CI | |
|---|---|---|---|
| Sex | |||
| Men | 6,611 | 49.5 | 49.4-49.6 |
| Women | 6,317 | 50.5 | 50.4-50.6 |
| Age group | |||
| 16-24 years | 3,524 | 9.7 | 9.6-9.8 |
| 25-44 years | 3,709 | 36.6 | 36.4-36.9 |
| 45-64 years | 3,188 | 32.2 | 31.9-32.5 |
| ≥65 years | 2,507 | 21.5 | 21.3-21.7 |
| Occupational status | |||
| Working | 5,224 | 48.0 | 47.2-48.8 |
| Studying | 2,613 | 7.9 | 7.6-8.1 |
| Other | 5,091 | 44.2 | 43.4-44.9 |
| Educational level | |||
| Basic | 6,038 | 47.9 | 47.1-48.8 |
| Medium | 4,421 | 30.9 | 30.1-31.7 |
| Higher | 2,469 | 21.2 | 20.4-21.9 |
| Cohabitation | |||
| Living as a couple | 6,750 | 63.3 | 62.4-64.1 |
| Not living as a couple | 6,178 | 36.7 | 35.9-37.6 |
| Residential environment | |||
| Urban | 7,809 | 60.9 | 60.0-61.8 |
| Semiurban | 3,373 | 25.6 | 24.8-26.4 |
| Rural | 1,746 | 13.5 | 12.9-14.1 |
| Smoking status | |||
| Smoker | 2,916 | 22.9 | 22.1-23.6 |
| Ex-smoker | 3,206 | 27.4 | 26.6-28.2 |
| Never smoker | 6,806 | 49.8 | 48.9-50.7 |
| Weight status | |||
| Underweight | 359 | 1.7 | 1.5-1.9 |
| Normal weight | 6,602 | 46.0 | 45.1-46.9 |
| Overweight | 4,445 | 38.6 | 37.7-39.5 |
| Obesity | 1,522 | 13.7 | 13.1-14.4 |
95%CI: 95% confidence interval.
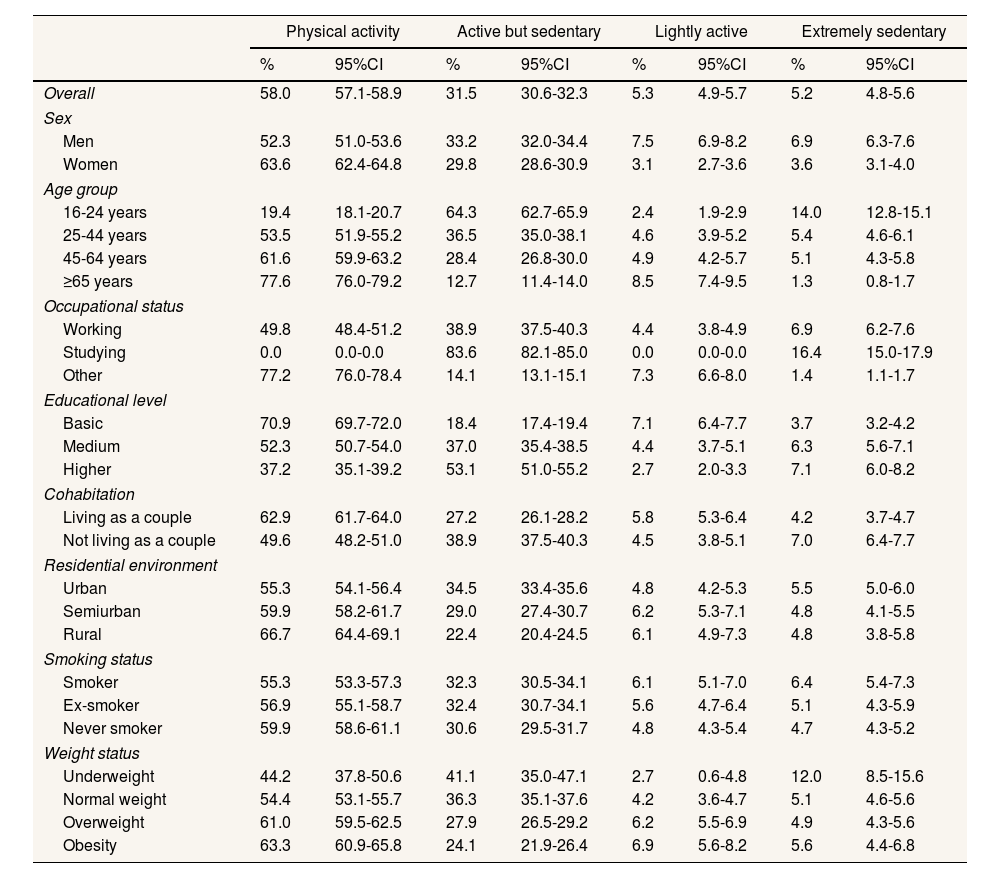
Overall, 36.7% (95%CI: 35.8-37.6) of the adult Galician population was sedentary and 10.5% (95%CI: 10.0%-11.1%) was physically inactive. The prevalences for each level of physical activity by sociodemographic characteristics are shown in Table 2.
Prevalences of level of physical activity in leisure time and other scenarios, according to sociodemographic characteristics.
| Physical activity | Active but sedentary | Lightly active | Extremely sedentary | |||||
|---|---|---|---|---|---|---|---|---|
| % | 95%CI | % | 95%CI | % | 95%CI | % | 95%CI | |
| Overall | 58.0 | 57.1-58.9 | 31.5 | 30.6-32.3 | 5.3 | 4.9-5.7 | 5.2 | 4.8-5.6 |
| Sex | ||||||||
| Men | 52.3 | 51.0-53.6 | 33.2 | 32.0-34.4 | 7.5 | 6.9-8.2 | 6.9 | 6.3-7.6 |
| Women | 63.6 | 62.4-64.8 | 29.8 | 28.6-30.9 | 3.1 | 2.7-3.6 | 3.6 | 3.1-4.0 |
| Age group | ||||||||
| 16-24 years | 19.4 | 18.1-20.7 | 64.3 | 62.7-65.9 | 2.4 | 1.9-2.9 | 14.0 | 12.8-15.1 |
| 25-44 years | 53.5 | 51.9-55.2 | 36.5 | 35.0-38.1 | 4.6 | 3.9-5.2 | 5.4 | 4.6-6.1 |
| 45-64 years | 61.6 | 59.9-63.2 | 28.4 | 26.8-30.0 | 4.9 | 4.2-5.7 | 5.1 | 4.3-5.8 |
| ≥65 years | 77.6 | 76.0-79.2 | 12.7 | 11.4-14.0 | 8.5 | 7.4-9.5 | 1.3 | 0.8-1.7 |
| Occupational status | ||||||||
| Working | 49.8 | 48.4-51.2 | 38.9 | 37.5-40.3 | 4.4 | 3.8-4.9 | 6.9 | 6.2-7.6 |
| Studying | 0.0 | 0.0-0.0 | 83.6 | 82.1-85.0 | 0.0 | 0.0-0.0 | 16.4 | 15.0-17.9 |
| Other | 77.2 | 76.0-78.4 | 14.1 | 13.1-15.1 | 7.3 | 6.6-8.0 | 1.4 | 1.1-1.7 |
| Educational level | ||||||||
| Basic | 70.9 | 69.7-72.0 | 18.4 | 17.4-19.4 | 7.1 | 6.4-7.7 | 3.7 | 3.2-4.2 |
| Medium | 52.3 | 50.7-54.0 | 37.0 | 35.4-38.5 | 4.4 | 3.7-5.1 | 6.3 | 5.6-7.1 |
| Higher | 37.2 | 35.1-39.2 | 53.1 | 51.0-55.2 | 2.7 | 2.0-3.3 | 7.1 | 6.0-8.2 |
| Cohabitation | ||||||||
| Living as a couple | 62.9 | 61.7-64.0 | 27.2 | 26.1-28.2 | 5.8 | 5.3-6.4 | 4.2 | 3.7-4.7 |
| Not living as a couple | 49.6 | 48.2-51.0 | 38.9 | 37.5-40.3 | 4.5 | 3.8-5.1 | 7.0 | 6.4-7.7 |
| Residential environment | ||||||||
| Urban | 55.3 | 54.1-56.4 | 34.5 | 33.4-35.6 | 4.8 | 4.2-5.3 | 5.5 | 5.0-6.0 |
| Semiurban | 59.9 | 58.2-61.7 | 29.0 | 27.4-30.7 | 6.2 | 5.3-7.1 | 4.8 | 4.1-5.5 |
| Rural | 66.7 | 64.4-69.1 | 22.4 | 20.4-24.5 | 6.1 | 4.9-7.3 | 4.8 | 3.8-5.8 |
| Smoking status | ||||||||
| Smoker | 55.3 | 53.3-57.3 | 32.3 | 30.5-34.1 | 6.1 | 5.1-7.0 | 6.4 | 5.4-7.3 |
| Ex-smoker | 56.9 | 55.1-58.7 | 32.4 | 30.7-34.1 | 5.6 | 4.7-6.4 | 5.1 | 4.3-5.9 |
| Never smoker | 59.9 | 58.6-61.1 | 30.6 | 29.5-31.7 | 4.8 | 4.3-5.4 | 4.7 | 4.3-5.2 |
| Weight status | ||||||||
| Underweight | 44.2 | 37.8-50.6 | 41.1 | 35.0-47.1 | 2.7 | 0.6-4.8 | 12.0 | 8.5-15.6 |
| Normal weight | 54.4 | 53.1-55.7 | 36.3 | 35.1-37.6 | 4.2 | 3.6-4.7 | 5.1 | 4.6-5.6 |
| Overweight | 61.0 | 59.5-62.5 | 27.9 | 26.5-29.2 | 6.2 | 5.5-6.9 | 4.9 | 4.3-5.6 |
| Obesity | 63.3 | 60.9-65.8 | 24.1 | 21.9-26.4 | 6.9 | 5.6-8.2 | 5.6 | 4.4-6.8 |
95%CI: 95% confidence interval.
A total of 58.0% of the population was physically active; the remaining 42.0% presented some degree of sedentarism and/or physical inactivity. The active but sedentary status was more common than the lightly active status (31.5% vs. 5.3%), with 5.2% falling into the extremely sedentary category in which both behaviors were present.
The prevalences of each category differed according to sex. The prevalence of the physically active category was higher in women than in men (63.6% vs. 52.3%), while men registered a higher prevalence in all other categories which include at least one of the two risky behaviors studied (sedentarism and/or physical inactivity). Furthermore, as age increases, the higher the prevalence of physically active and the lower the prevalence of active but sedentary. With respect to the occupational status, being a student was associated with sedentarism behavior. Similarly, the higher the educational level, the lower the prevalence of physically active and lightly active, and the higher the prevalence of active but sedentary and extremely sedentary. In addition, residential setting also had an influence on the fact of being physically active, with prevalences being higher in semiurban and rural areas vs. urban areas; the opposite occurred for active but sedentary, the prevalence of which decreased as areas became increasingly rural. While smoking had no clear influence, body-weight status mainly affected the active but sedentary category, such that its prevalence decreased as body weight increased.
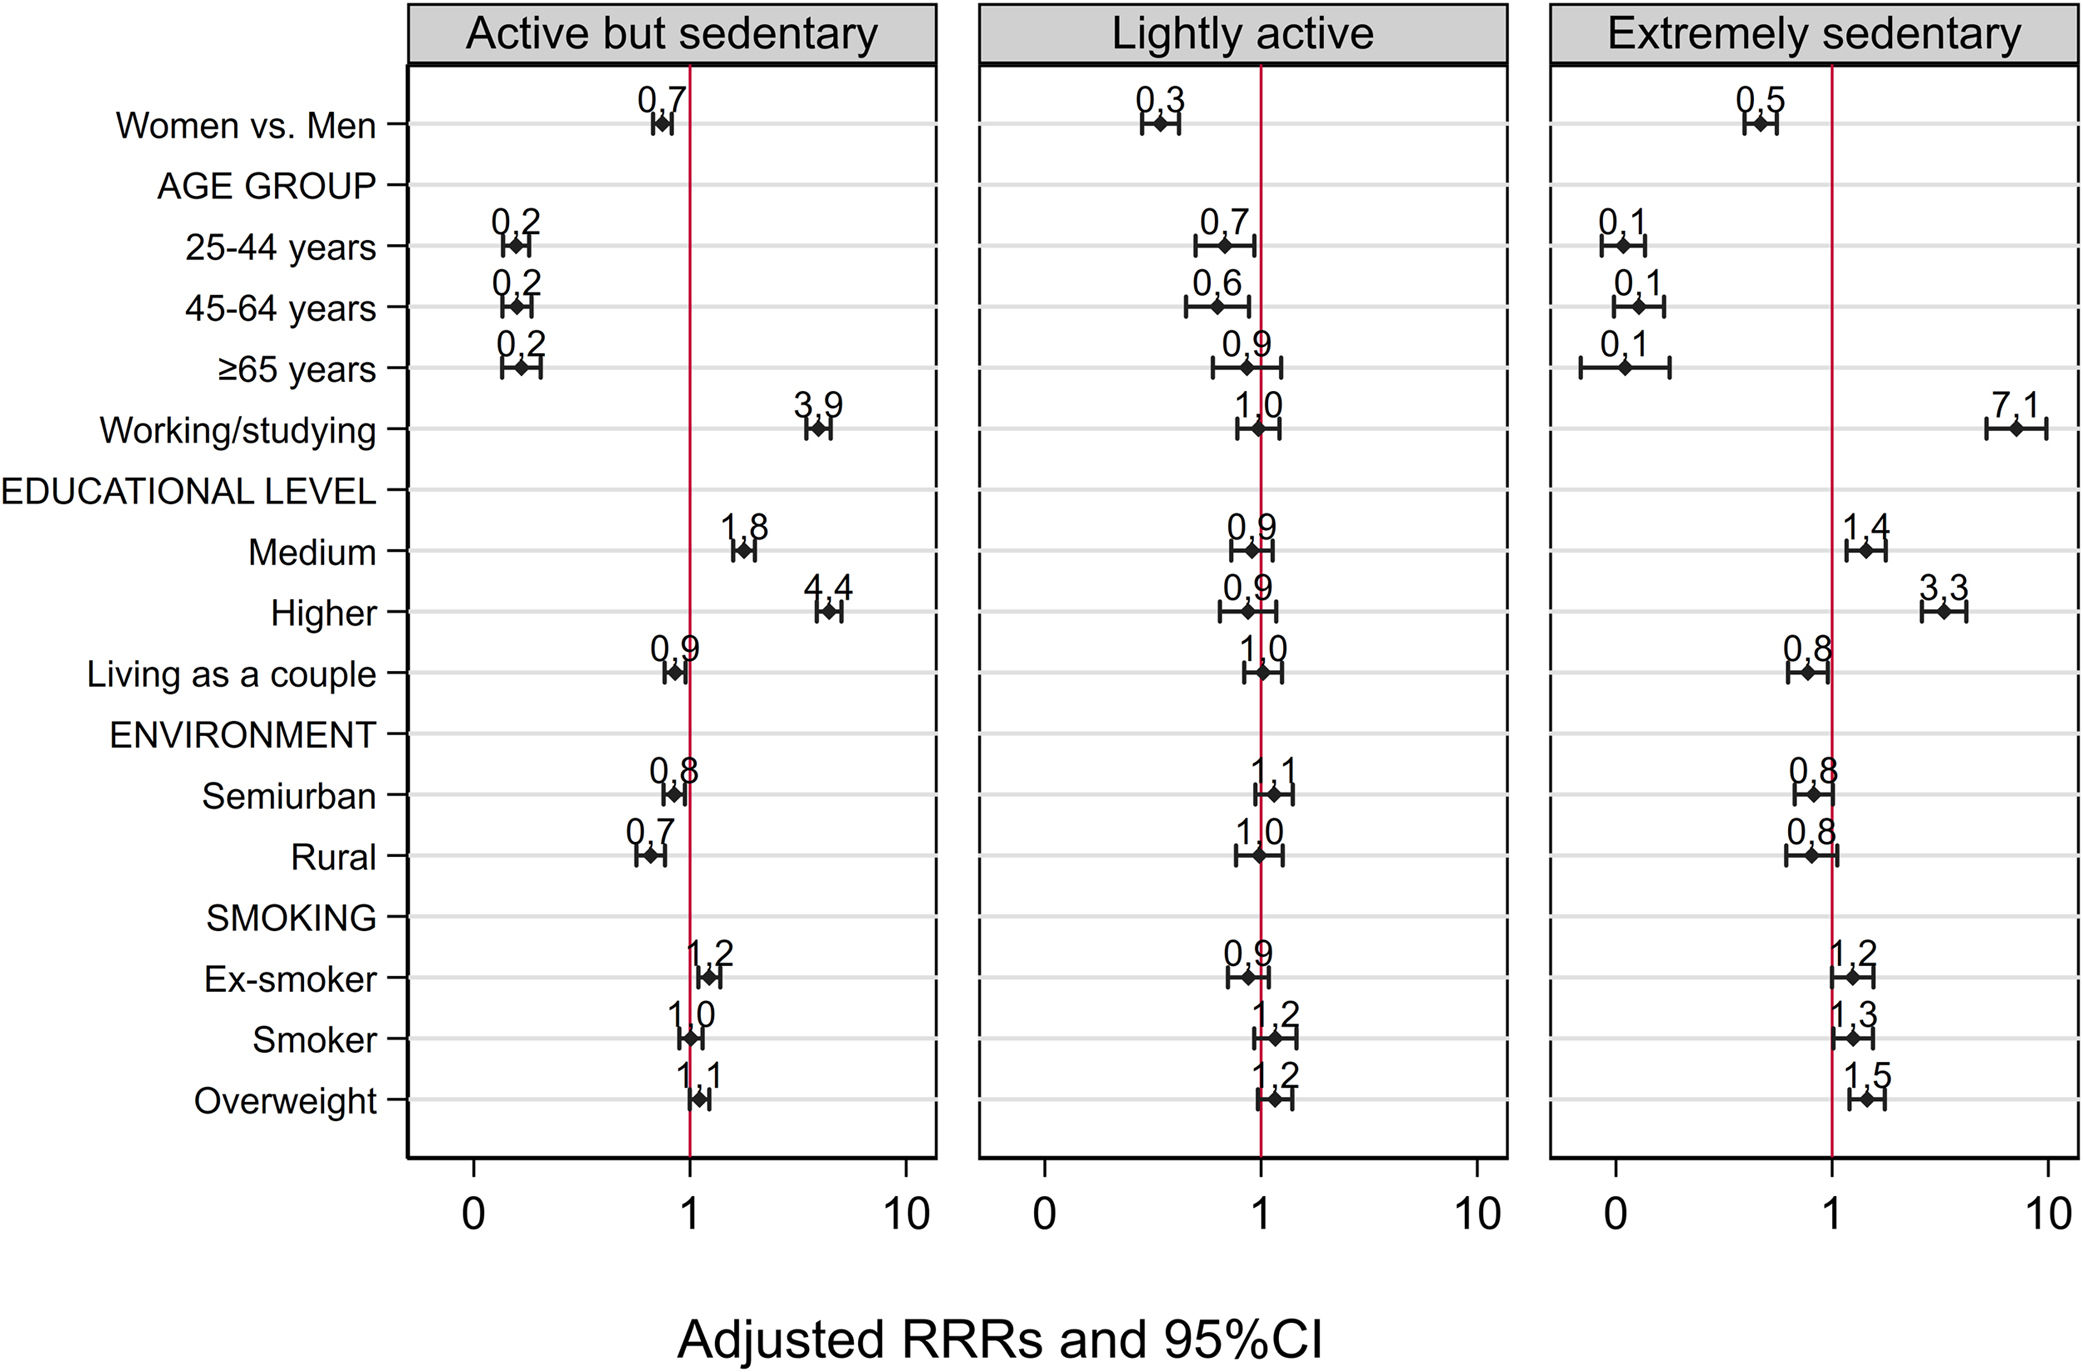
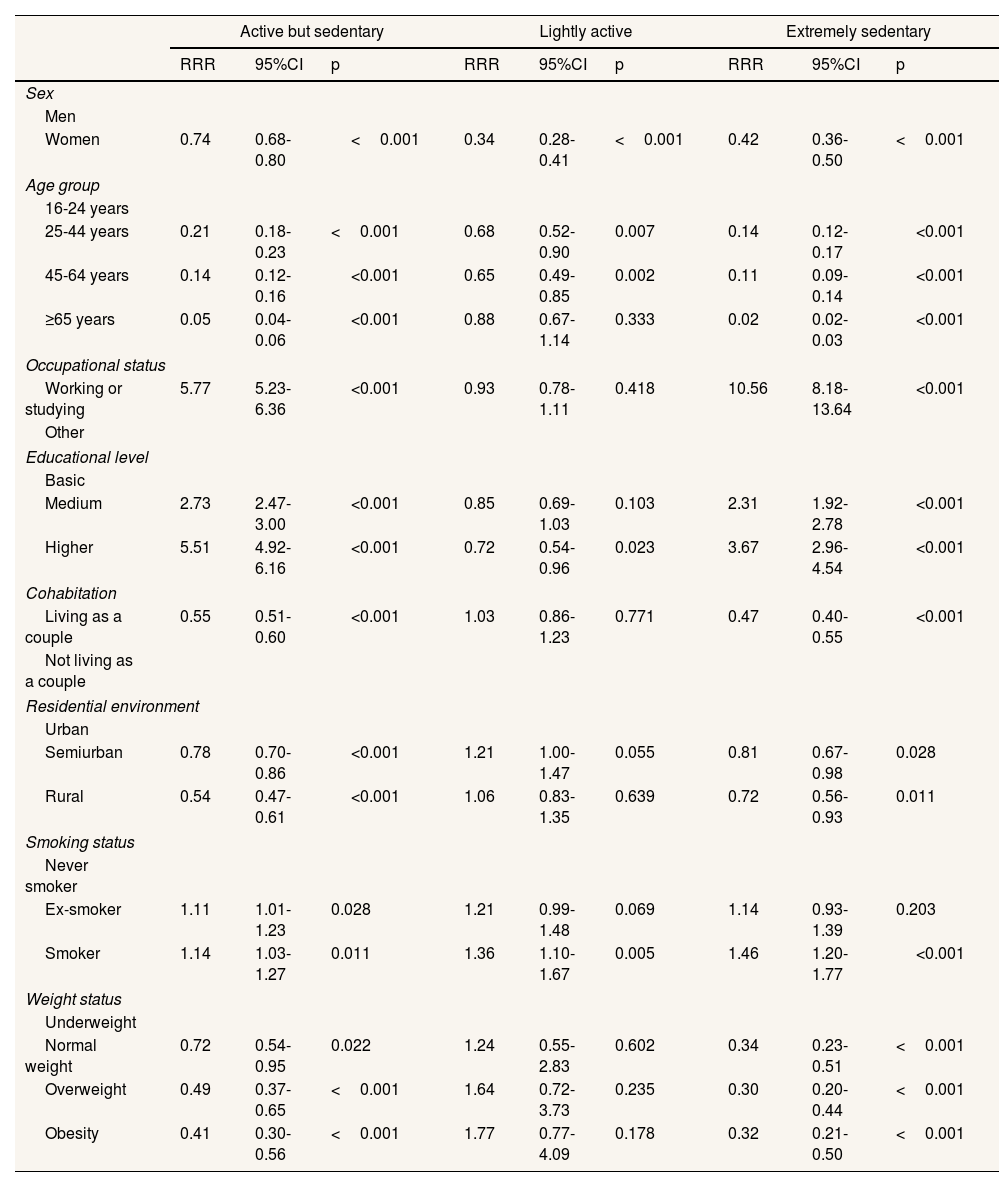
The results obtained in the analysis of prevalences was confirmed by the bivariate multinomial logistic regression (Table 3) and multivariate multinomial logistic regression (Fig. 1). Women had a higher likelihood of being in the physically active category than in the active but sedentary (RRR: 0.7; 95%CI: 0.7-0.8), lightly active (RRR: 0.3; 95%CI: 0.3-0.4) and extremely sedentary categories (RRR: 0.5; 95%CI: 0.4-0.6) in comparison with men. The RRR decreased with age, with young persons having a higher risk of being extremely sedentary than physically active in comparison with older persons.
Multinomial logistic regression. Relative risk ratios of levels of physical activity with some harmful behavior (sedentarism or physical inactivity), according to sociodemographic characteristics. Bivariate analysis.
| Active but sedentary | Lightly active | Extremely sedentary | |||||||
|---|---|---|---|---|---|---|---|---|---|
| RRR | 95%CI | p | RRR | 95%CI | p | RRR | 95%CI | p | |
| Sex | |||||||||
| Men | |||||||||
| Women | 0.74 | 0.68-0.80 | <0.001 | 0.34 | 0.28-0.41 | <0.001 | 0.42 | 0.36-0.50 | <0.001 |
| Age group | |||||||||
| 16-24 years | |||||||||
| 25-44 years | 0.21 | 0.18-0.23 | <0.001 | 0.68 | 0.52-0.90 | 0.007 | 0.14 | 0.12-0.17 | <0.001 |
| 45-64 years | 0.14 | 0.12-0.16 | <0.001 | 0.65 | 0.49-0.85 | 0.002 | 0.11 | 0.09-0.14 | <0.001 |
| ≥65 years | 0.05 | 0.04-0.06 | <0.001 | 0.88 | 0.67-1.14 | 0.333 | 0.02 | 0.02-0.03 | <0.001 |
| Occupational status | |||||||||
| Working or studying | 5.77 | 5.23-6.36 | <0.001 | 0.93 | 0.78-1.11 | 0.418 | 10.56 | 8.18-13.64 | <0.001 |
| Other | |||||||||
| Educational level | |||||||||
| Basic | |||||||||
| Medium | 2.73 | 2.47-3.00 | <0.001 | 0.85 | 0.69-1.03 | 0.103 | 2.31 | 1.92-2.78 | <0.001 |
| Higher | 5.51 | 4.92-6.16 | <0.001 | 0.72 | 0.54-0.96 | 0.023 | 3.67 | 2.96-4.54 | <0.001 |
| Cohabitation | |||||||||
| Living as a couple | 0.55 | 0.51-0.60 | <0.001 | 1.03 | 0.86-1.23 | 0.771 | 0.47 | 0.40-0.55 | <0.001 |
| Not living as a couple | |||||||||
| Residential environment | |||||||||
| Urban | |||||||||
| Semiurban | 0.78 | 0.70-0.86 | <0.001 | 1.21 | 1.00-1.47 | 0.055 | 0.81 | 0.67-0.98 | 0.028 |
| Rural | 0.54 | 0.47-0.61 | <0.001 | 1.06 | 0.83-1.35 | 0.639 | 0.72 | 0.56-0.93 | 0.011 |
| Smoking status | |||||||||
| Never smoker | |||||||||
| Ex-smoker | 1.11 | 1.01-1.23 | 0.028 | 1.21 | 0.99-1.48 | 0.069 | 1.14 | 0.93-1.39 | 0.203 |
| Smoker | 1.14 | 1.03-1.27 | 0.011 | 1.36 | 1.10-1.67 | 0.005 | 1.46 | 1.20-1.77 | <0.001 |
| Weight status | |||||||||
| Underweight | |||||||||
| Normal weight | 0.72 | 0.54-0.95 | 0.022 | 1.24 | 0.55-2.83 | 0.602 | 0.34 | 0.23-0.51 | <0.001 |
| Overweight | 0.49 | 0.37-0.65 | <0.001 | 1.64 | 0.72-3.73 | 0.235 | 0.30 | 0.20-0.44 | <0.001 |
| Obesity | 0.41 | 0.30-0.56 | <0.001 | 1.77 | 0.77-4.09 | 0.178 | 0.32 | 0.21-0.50 | <0.001 |
95%CI: 95% confidence interval; RRR: relative risk ratio.
 of each category compared with the reference category (physical activity). Multivariate analysis.")
People whose occupational status is either working or studying had a more than 10-fold higher risk of being extremely sedentary vs. physically active than those who reported another status. Persons living in a rural environment had a lower risk of being extremely sedentary than persons living in an urban environment. Lastly, smokers had a 50.0% higher risk of being extremely sedentary vs. physically active in comparison with never smokers.
In summary, men, of young people, workers or students, subjects with a higher educational level, individuals living alone, residents urban environments, and smokers had a higher likelihood of being extremely sedentary in comparison to physically active.
DiscussionTo our knowledge, this study is the first to analyze sedentarism and physical inactivity jointly in the Spanish adult population. This gives an integrative and complete picture of behaviors related with the population's physical activity, by examining all scenarios. We found that whereas only 36.7% of the population is classified as sedentary and 10.5% is physically inactive, 42.0% present some degree of sedentarism and/or physical inactivity. Men, young people, workers and/or students, subjects with higher educational levels, individuals living alone, residents of urban environments, and smokers present a higher likelihood of being extremely sedentary than their counterparts.
Different sociodemographic variables seem to influence the prevalences of these modifiable risk factors. Sex appears to be an influential factor, since women appear to be more physically active than men and have less probability of being in categories linked to at least one of the two risky behaviors studied (sedentarism or physical inactivity). This might reflect differences in women's and men's employments, household duties, transport use and leisure-time activities, etc. Moreover, the results highlight the importance of assessing physical activity in all scenarios, given that a previous study reported that prevalences of physical inactivity in women were considerably reduced when domestic activities were also included.20 The results of López-Valenciano et al.5 (focusing on sedentarism) agree with our results, on reporting that Spanish women were less sedentary than men in 2005, 2013, and 2017 (a sedentary person being anyone who spends>4h 30min engaged in sedentary behaviors).
The prevalence of physically active also seems to increase with age, a fact that is surprising but could be due to several reasons. For example, this trend could be influenced by the occupational and academic sedentarism of the youngest age groups21 (the prevalence of active but sedentary and extremely sedentary is higher among those who study or work in comparison with other occupational situations). This trend was also observed in a previous study, in which the prevalences of sedentarism were higher in the 18-24 year age group than in the older age groups5 in 2002, 2005, 2013, and 2017. It should be stressed, however, that our study excluded persons with mobility problems, which could lead to an overestimation of the prevalences of physically active persons in the oldest age groups.
Our results suggest that, compared to people with a lower educational level, those with a higher educational level tend to have jobs in which sedentarism is largely predominant. In general, it is understood that the higher the educational level, the greater the amount of physical activity done. But, when sedentarism and physical inactivity are evaluated jointly, persons who spend long periods of time seated drop out of the physically active group, despite engaging in sufficient physical activity in their leisure time.
Existing evidence shows that it is key to reduce the time spent seated, especially in the work and academic environment. Long periods of remaining seated are linked to back pain, and mental and muscle fatigue.22 In addition, the 2018 Physical Activity Guidelines Advisory Committee report concludes that there is solid evidence to show that sedentary behavior increases the risk of all-cause and cardiovascular-disease mortality, as well as the risk of developing type-2 diabetes.4 To reduce this risk, the interruption of long seated periods is recommended.23 Different studies propose strategies to disrupt these trends in the workplace, by, for example, changing its structure (moving or changing the furniture).24,25 A World Health Organization (WHO) report (Preventing disease through a healthier and safer workplace) stresses the importance of physical activity in the work environment, giving examples of intervention.26 In Galicia, for instance, the Occupational Safety and Health Institute (Instituto de Seguridad y Salud Laboral) launched a campaign in 2019 under the slogan, “Get moving and reduce sedentarism in the office” (Móvete! E reduce o sedentarism na oficina). To our knowledge, this is one of few initiatives essentially targeted at reducing sedentarism in Galicia. Future studies should evaluate the real impact of such campaigns on the working population. With regards to the academic environment, a study on university students concluded that the inclusion of at least 5min of active pauses (general movements of the whole body) every 20min of class serves to enhance concentration without adversely affecting the content of the session.27
As expected, living in an urban environment increased the probability of belonging to the physical activity group. This fact is supported by the literature because, among other things, people living in rural environments are more engaged in farm activities (more physically demanding) and the options of motorized travel are more limited.28 Similarly, the fact of cohabiting with a partner seems to influence lifestyle, since people are more likely to display neither of the behaviors studied (sedentarism or physical inactivity), if they live with a partner.
This study has shown an association between sociodemographic variables such as sex, age, level of education, residential environment, employment status and tobacco consumption with physical inactivity and a sedentary lifestyle. However, there could be other sociodemographic variables not included in this study that may also be related to these two behaviors, such as socioeconomic status or income. Most studies have found that people with higher socioeconomic status are more likely to be more physically active.29,30 On the other hand, in one study it was observed that people with a high-income level were 1.9 times more likely to meet physical activity guidelines than people with a lower income level.31 In addition, it has also been observed that those living in households with a lower poverty income index perform 17-30min less moderate physical activity during leisure time per week.32 In relation to sedentary lifestyle, it also has been found that those with higher socioeconomic levels tend to be less sedentary. Although, the differences between the different socioeconomic levels in relation to sedentary lifestyle are smaller than in the case of physical activity.29
Overall, our results highlight the need for boosting interventions targeted at combating sedentarism. In general, policies are targeted at controlling, monitoring and tackling physical inactivity whereas only around 22.0% focus on combating sedentarism.33 The literature suggests that sedentarism could be even more harmful than physical inactivity, due mainly to behaviors associated with or stemming from this (watching television, poor quality sleep, poor dietary behavior, stress, etc.).34 Given that these are closely related behaviors, promoting one could be construed as influencing the other. Indeed, there is evidence to show that the more time spent on physical activity, the less time spent on sedentary behaviors.35 However, the problem with the promotion of physical activity resides in that the messages are commonly limited to leisure time (time that people themselves can control); thus contributing to reduce leisure-time sedentarism but ignoring a great part of the day. Hence, it seems important that initiatives should also be targeted at scenarios such as workplaces and schools, where persons “may not have full freedom of control” over their behavior. For those situations where it is impossible to reduce sedentary behavior, studies indicate that people who do 60-75minutes of moderate intensity physical activity (3.0-5.9 MET) per day, eliminate the increased risk of mortality associated with being seated for more than 8h.36
One of this study's strengths is its sample size and the guaranteed representativeness of the population. The fact that both sedentarism and physical inactivity are examined in different scenarios provides a comprehensive picture of the population's daily routine. Even so, the study has several limitations. Our results are from a past period (2014-2015) but given the negative trends observed for both behaviors, similar or worse conclusions are to be expected for the present. While the SICRI questions enabled us to estimate physical inactivity via the calculation of kilocalories, results can not be directly compared to those obtained with other questionnaires, such as the Global Physical Activity Questionnaire (GPAQ) proposed by the WHO. Lastly, this study did not collect data on people with mobility problems, leading to a possible overestimation of prevalences of physically active in the oldest age groups.
ConclusionsJoint evaluation of sedentarism and physical inactivity gives a completer and more realistic picture of population behaviors related with physical activity. In most cases, limiting oneself to measuring just one of the two entails failing to evaluate a large part of someone's day. In this respect, messages should be integrated and given jointly, informing people of the importance of staying active and non-sedentary when it comes to improving their health. This approach could provide more information with a view to public health interventions.
Availability of databases and material for replicationThe datasets generated and/or analyzed during the current study are available in the Galician Directorate for Public Health repository: www.sergas.es/Saude-publica/SICRI-Sistema-Información-sobre-Condutas-de-Risco.
Sedentary lifestyles and physical inactivity are risk factors for developing non-communicable diseases such as cardiovascular or metabolic diseases. Although the presence of sedentary lifestyles and physical inactivity or either of the two behaviors in the same person is common, few studies have studied them jointly.
What does this study add to the literature?Men have a higher prevalence in the categories that include at least one of the two risk behaviors, sedentary lifestyle and/or physical inactivity. People who work or study are profiles that are 10 times more at risk of being sedentary and physically inactive compared to those with other status.
What are the implications of the results?Knowing the characteristics of the population at higher risk of sedentary lifestyles and/or physical inactivity will allow us to know where preventive measures need to be applied. Analyzing both behaviors jointly provides a more complete picture of a person's day-to-day physical activity.
Javier García Amez.
Transparency declarationThe corresponding author on behalf of the other authors guarantee the accuracy, transparency and honesty of the data and information contained in the study, that no relevant information has been omitted and that all discrepancies between authors have been adequately resolved and described.
Authorship contributionsJ. Rey-Brandariz: methodology, formal analysis, visualization and writing-original draft. J. Rial-Vázquez: methodology, formal analysis, writing-review and editing. L. Varela-Lema: methodology, supervision, writing-review and editing. M.I. Santiago-Pérez: methodology, formal analysis, data curation, writing-review and editing. C. Candal-Pedreira: methodology, writing-review and editing. C. Guerra-Tort: formal analysis, writing-review and editing. R. Ruano-Ravina: conceptualization, supervision, writing-review and editing. M. Pérez-Ríos: conceptualization, methodology, formal analysis, supervision and writing-review and editing.
FundingJ. Rial-Vázquez has received a Margarita Salas study grant for the training of new doctors at A Coruña University (RSU.UDC.MS10).
Conflicts of interestNone.


