


Editado por: Carme Borell
Última actualización: Marzo 2023
Más datosTo analyse socioeconomic inequalities in all-cause mortality among men and women in nine European urban areas during the recent economic crisis, and to compare the results to those from two periods before the crisis.
MethodThis is an ecological study of trends based on three time periods (2000-2003, 2004-2008 and 2009-2014). The units of analysis were the small areas of nine European urban areas. We used a composite deprivation index as a socioeconomic indicator, along with other single indicators. As a mortality indicator, we used the smoothed standardized mortality ratio, calculated using the hierarchical Bayesian model proposed by Besag, York and Mollié. To analyse the evolution of socioeconomic inequalities, we fitted an ecological regression model that included the socioeconomic indicator, the period of time, and the interaction between these terms.
ResultsWe observed significant inequalities in mortality among men for almost all the socioeconomic indicators, periods, and urban areas studied. However, no significant changes occurred during the period of the economic crisis. While inequalities among women were less common, there was a statistically significant increase in inequality during the crisis period in terms of unemployment and the deprivation index in Prague and Stockholm, respectively.
ConclusionsFuture analyses should also consider time-lag in the effect of crises on mortality and specific causes of death, and differential effects between genders.
Analizar las desigualdades socioeconómicas en la mortalidad por todas las causas en hombres y mujeres de nueve áreas urbanas europeas durante la reciente crisis económica, y comparar los resultados con dos periodos previos a la crisis.
MétodoEstudio ecológico de tendencias basado en tres periodos (2000-2003, 2004-2008 y 2009-2014). Las unidades de análisis fueron las áreas pequeñas de nueve zonas urbanas europeas. Se utilizaron un índice compuesto de privación socioeconómica como indicador socioeconómico y otros indicadores simples. Como indicador de mortalidad se usó la razón de mortalidad estandarizada suavizada, calculada utilizando el modelo jerárquico bayesiano propuesto por Besag, York y Mollié. Para analizar la evolución de las desigualdades socioeconómicas se utilizó un modelo de regresión ecológico que incluía el indicador socioeconómico, el periodo y la interacción de ambos.
ResultadosSe observaron desigualdades significativas en la mortalidad en los hombres para casi todos los indicadores socioeconómicos, periodos y áreas urbanas. Sin embargo, no hubo cambios significativos en las desigualdades en el periodo de crisis. Aunque las desigualdades entre las mujeres fueron menos comunes, hubo un incremento significativo en las desigualdades en mortalidad en el periodo de crisis en términos de desempleo y del índice de privación en Praga y Estocolmo, respectivamente.
ConclusionesFuturos análisis deberán tener en cuenta el tiempo transcurrido entre la crisis y su efecto en la mortalidad, así como diferentes causas de mortalidad y el efecto diferencial entre géneros.
Multiple studies have evaluated the relationship between economic recessions and changes in the health of the population. Some studies have shown improvements in health and health-related behaviours (procyclical effect), while others have shown worsening health (countercyclical effect) during periods of economic crises.1 Concerning the recent financial crisis in Europe that started at the end of 2008, some studies have reported a decrease in the consumption of tobacco and alcohol, reduced sedentary behaviour, and reduced incidence of traffic injuries. Conversely, there has been an increase in suicides, homicides, drug consumption, AIDS, and unmet healthcare needs overall.2–4 Consistent with this, it has been suggested that the number of suicides increased and that mental health deteriorated during the crisis, while there has been mixed evidence for self-rated health and other indicators.5 The effect of a recession on population health depends on various factors such as the extent, nature, and duration of the economic recession, co-existing economic and social protection policies, predominant socio-cultural values, and the general well-being of the population.6 These factors affect intermediate determinants of health inequalities such as unemployment, job insecurity, and lack of income and housing, all of which generally deteriorate during economic crises.7
There have been contradictory results regarding the impact of economic recessions on all-cause mortality. Some studies have observed an increase and decrease in mortality during economic expansions and recessions, respectively,8,9 while others have shown the opposite.10,11 Various possibilities have been proposed to explain these contradictory results: the use of individual versus aggregated data; the wealth of the countries analysed (high income versus low-middle income); analysis of levels of mortality versus inequalities in mortality; the time lag between the crisis and the effects studied; and the type of welfare state policies implemented in the countries studied.12
Economic crises have a worse impact on people from disadvantaged social classes, ethnic minorities, the unemployed, and those with lower educational levels.13 Therefore, the negative effects on health are also likely to be greater among these groups. However, there has been a general lack of studies that analyse the impact of economic recessions on inequalities in mortality,14,15 especially in urban areas. Further, studies that have analysed the effects of the economic crisis on socioeconomic inequalities in mortality have yielded mixed results.16–19
The aim of this study is to analyse socioeconomic inequalities in all-cause mortality among men and women living in nine European urban areas during the recent economic crisis, and to compare the results to those from two periods before the crisis.
MethodDesign, units of analyses and study populationThis study is part of a wider European project called EURO-HEALTHY (http://www.euro-healthy.eu/), which aims to increase knowledge and resources related to policies promoting health and health equity across European regions, with a focus on metropolitan areas. We performed an ecological study of trends based on three periods, two before the economic crisis (2000-2003 and 2004-2008), and one during the crisis (2009-2014). The units of analysis were small areas in nine European urban areas: Athens metropolitan area, Barcelona city, Berlin-Brandenburg Metropolregion, Brussels-Capital Region, Lisbon Metropolitan Area, Greater London, Prague city, Turin city, and Stockholm metropolitan area. These areas were selected because of their availability within the EURO-HEALTHY project, which covers a broad range of geographic areas and socioeconomic conditions20. The study population consisted of individuals residing in these areas during the three time periods.
Information sourcesFor most of the urban areas, mortality and population data were available for the three time periods, and socioeconomic indicators for 2001 (Tables 1 to 3). Mortality data were mainly obtained from mortality registers. Population data stratified by age (5-year groups) and sex were obtained from census or population registers. Socioeconomic data were mainly obtained from the census records.
Variables and indicatorsIn this study we analysed all-cause mortality in each small area of residence during the three time periods. The mortality indicator used for this analysis was the Standardized Mortality Ratio (SMR). For descriptive purposes we used the Indirectly Standardised Rate (ISR), which we calculated by multiplying the SMR for a study population by the crude rate in the standard population (defined as the European Union [EU]-28 in the year 2007).
We used a composite deprivation index in 2001 as a socioeconomic indicator for each small area. This index was the first component of a principal components analysis performed within each urban area.21 It includes unemployment in people aged ≥16 years; the percentage of manual workers in people aged ≥16 years; the percentage of people aged 25-64 years with primary education as their highest education (ISCED 0 and 1, except London where it was ISCED 0, 1 and 2); and the percentage of people aged 25-64 years with a university education (ISCED 5 and 6).22 There were no data for the percentage of manual workers in Stockholm, so the index was constructed using the other three available indicators.
Data analysisThe SMR depends on population size because its variance is inversely proportional to the expected values. Therefore, areas with low populations tend to present very variable estimates. To smooth the SMR, we used the hierarchical Bayesian model proposed by Besag, York and Mollié,23 which takes two types of random effects into account, spatial and heterogeneous. The former considers the spatial structure of the data, while the latter deals with non-structural (non-spatial) variability. We used the following model to estimate smoothed SMR (sSMR) for each sex, cause of death, and period:


where, for each area i, Oi is the number of observed cases, Ei is the expected number of cases, θi is the expected sSMR with respect to the European population, Si is the spatial effect, and Hi is the heterogeneous effect. The expected number of cases were calculated by indirect standardization, taking the mortality rates for 5-year age groups of the EU-28 in 2007 (approximately the year in the middle of the study period) as reference.
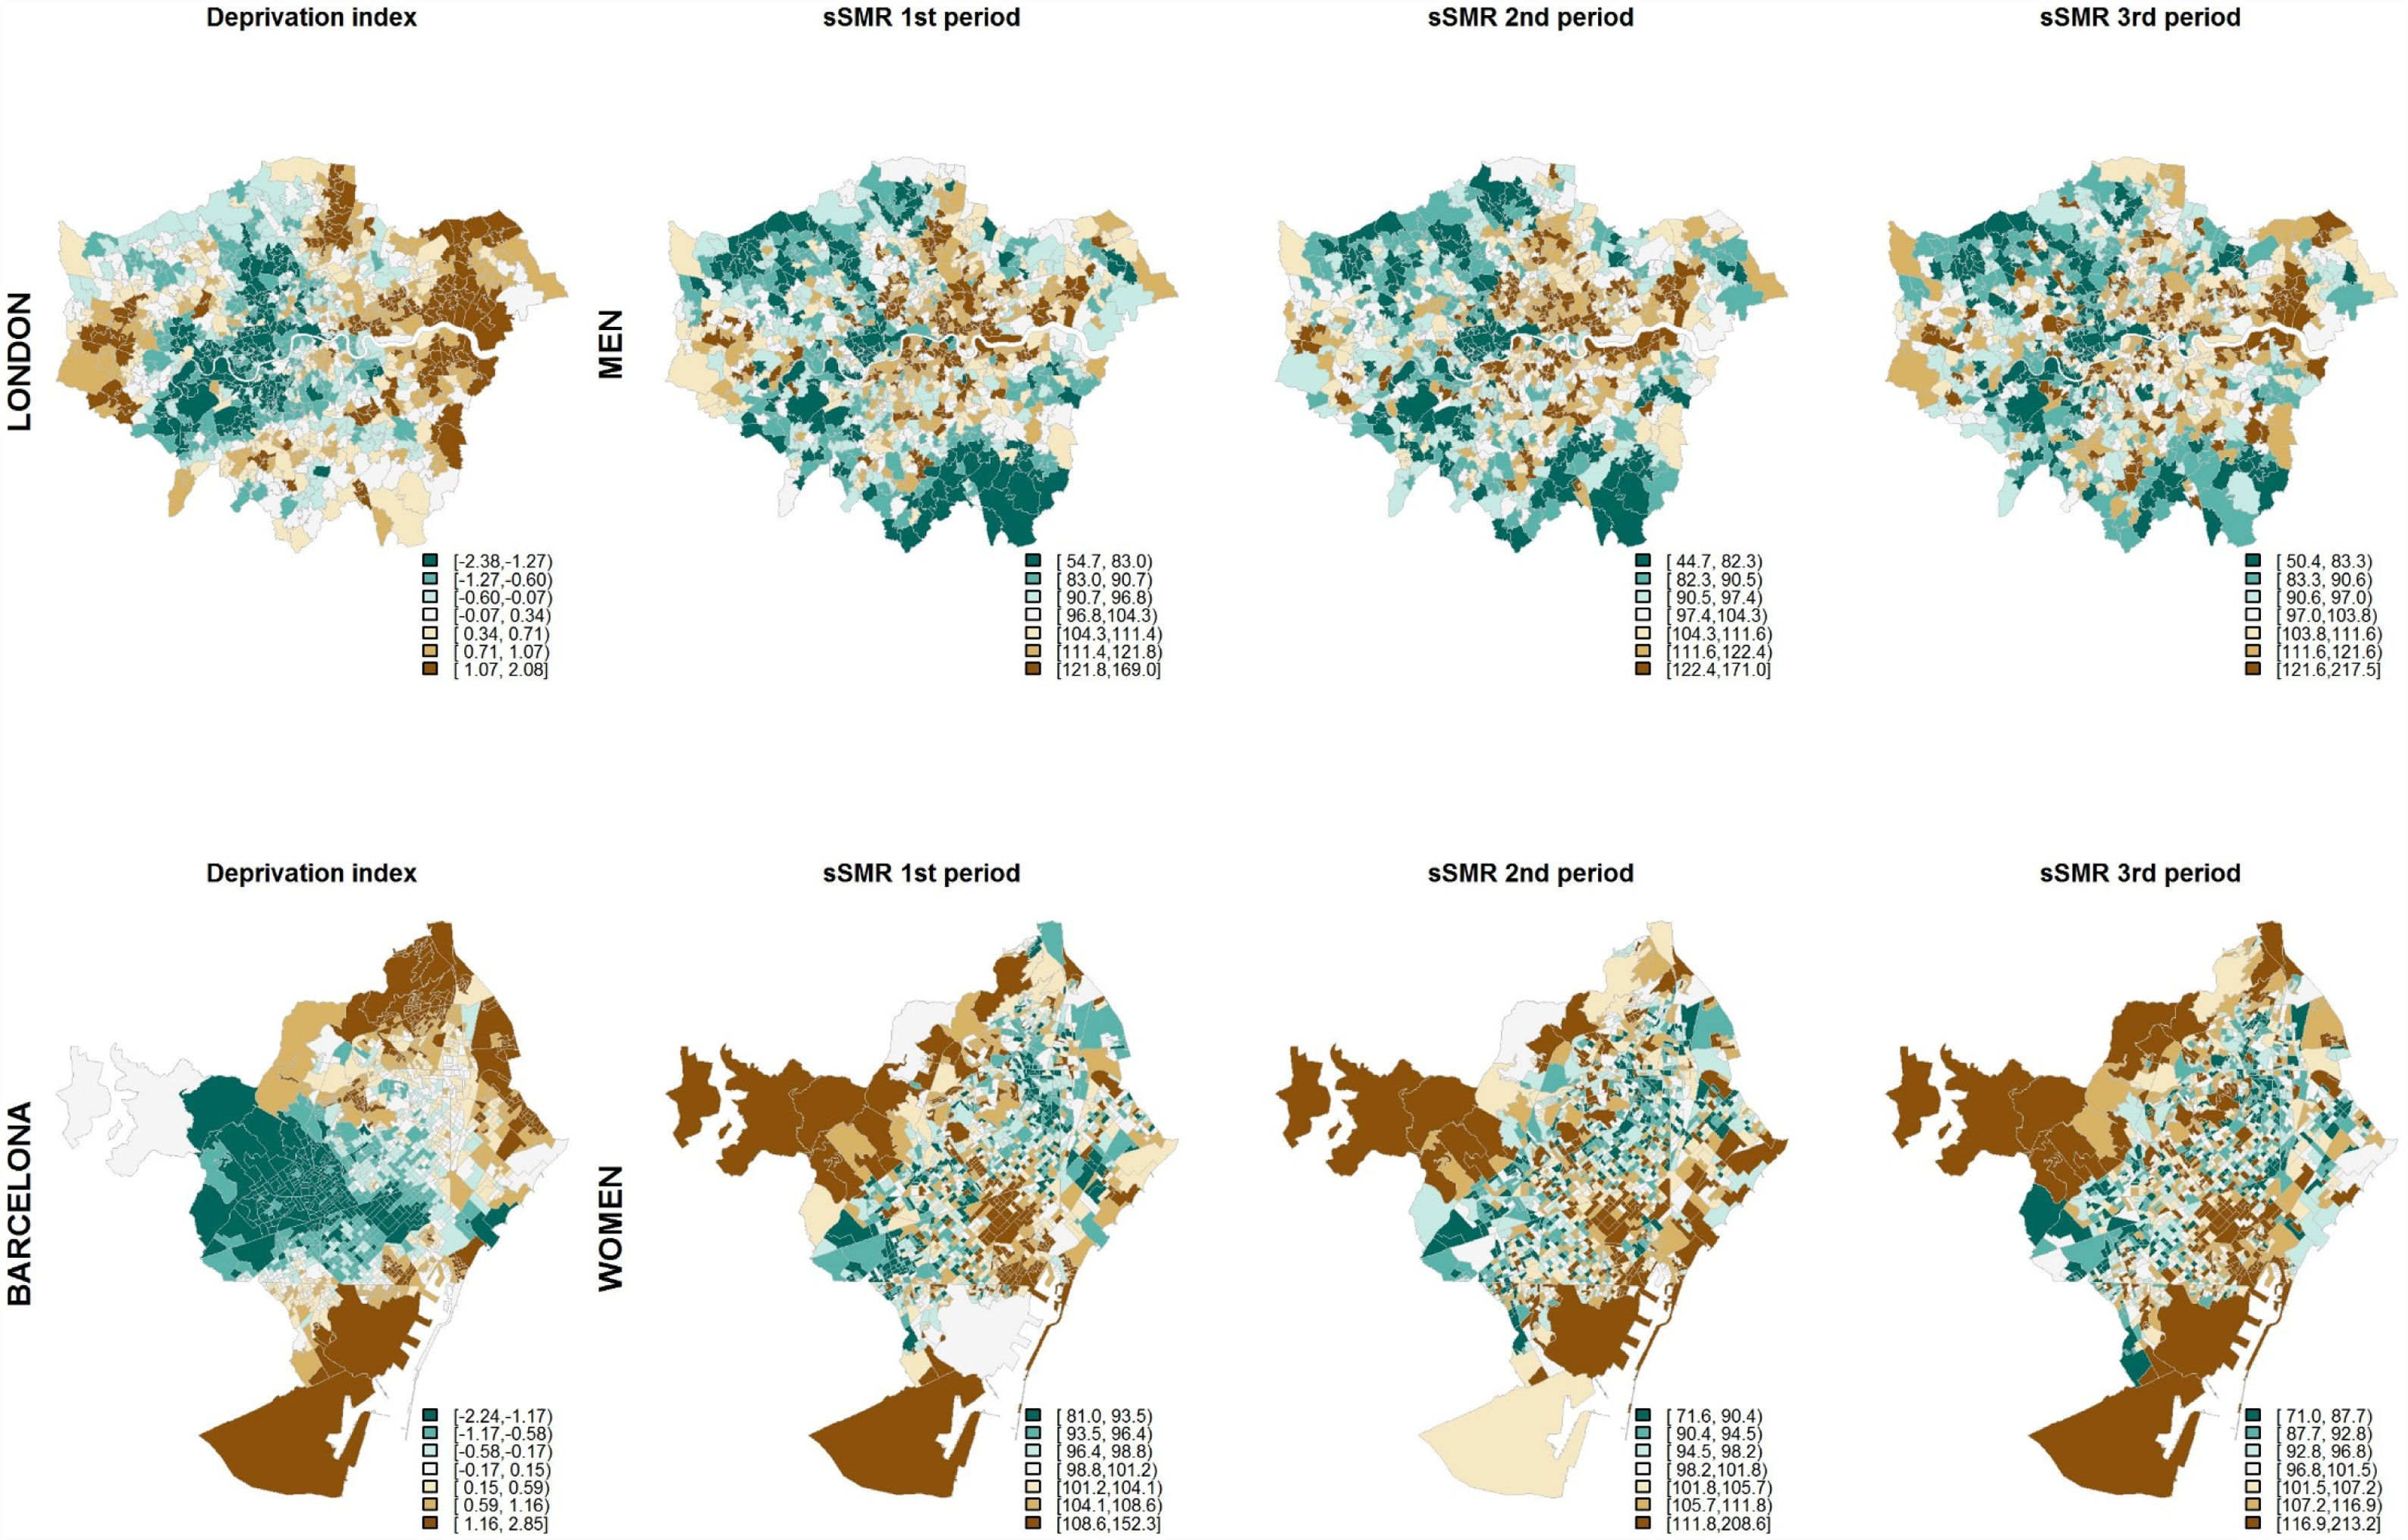
The geographical distribution of the sSMR, for each time period, was represented using septile maps. The socioeconomic indicators and the composite deprivation indicator were also represented as septile maps.
To analyse the evolution of socioeconomic inequalities, we fitted an ecological regression model that takes into account the composite deprivation index (D), the period (through two dummy variables P2 and P3) and their interaction:


where, for each area i and period t (t=1 for the first period, t=2 for the second period and t=3 for the third period), Oit is the number of observed cases, Eit is the expected number of cases, θit is the sSMR with respect to the European population, Sit is the spatial effect, and Hit is the heterogeneous effect. Finally, P2t and P3t take the following values: Pjt=1 if j=t, and 0 otherwise, where j=2 or 3. The expected number of cases was calculated as in the previous model. Changes between periods in the relationship between the socioeconomic deprivation index and mortality were evaluated by the interaction terms in model 2.
In the two models, the spatial effect was assigned an intrinsic conditional autoregressive prior distribution, which assumes that the expected value of each area coincides with the mean of the spatial effect of the adjacent areas. Its variance σs2 depends on the number of adjacent areas, since those areas that are more connected will show lower variability.24 The heterogeneous effect was represented using independent normal distributions with mean 0 and variance σh2. A uniform distribution U(0,∞) was assigned to the standard deviations σs and σh. A normal vague prior distribution, with mean 0 and precision 0.001, was assigned to the parameters α, β1, β2, β3, β4 and β5.
Since the composite deprivation index scale is dimensionless and arbitrarily fixed, we calculated the increase in risk that would correspond to a change in the composite deprivation index from its 5th percentile value (low deprivation) to its 95th percentile value (severe deprivation). Relative risk estimates were obtained based on the mean of their posterior distribution, along with corresponding 95% credible intervals.
Analyses were also performed for the single socioeconomic indicators: unemployment, percentage of manual workers, the percentage of those with primary education only, and the percentage of those with university education (results are shown for unemployment and for primary education while the others can be found in online Appendix).
All analyses were performed using R 3.5.0 25 and the R-INLA package 26.
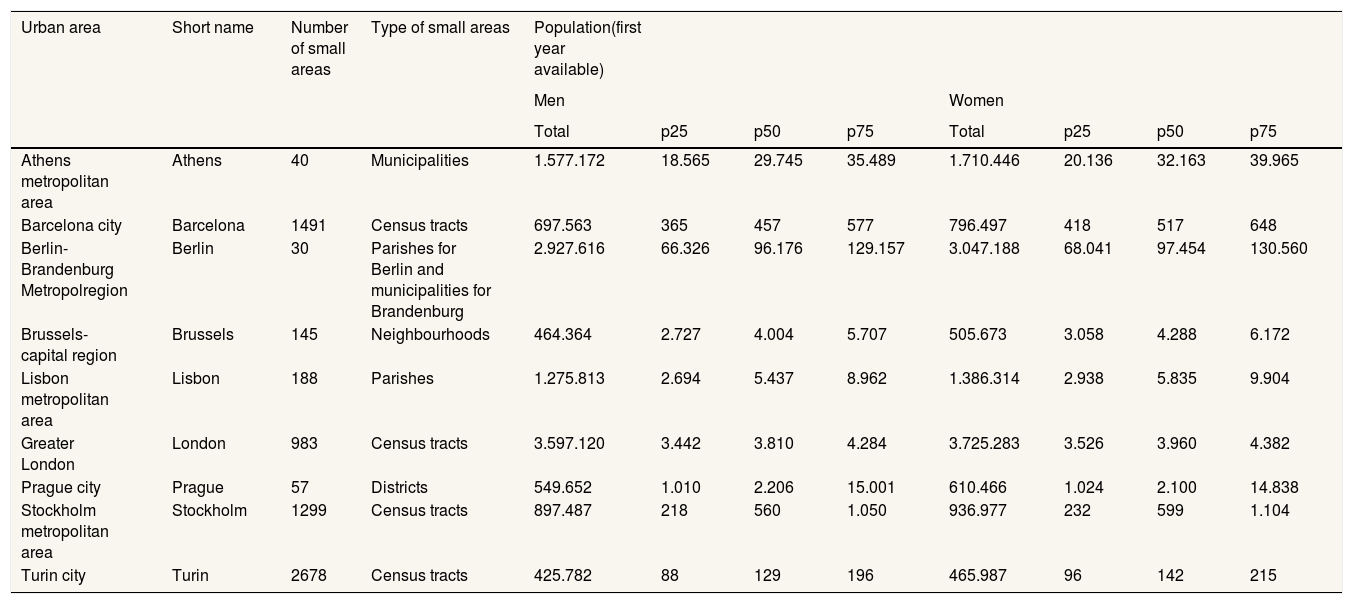
ResultsThe cities and metropolitan areas included in the study are described in Table 1. The least populated area is Turin city with nearly 900.000 people and the most populated is Greater London with more than 7 million people. Berlin-Brandenburg has the smallest number of areas (30 areas) and Turin has the highest (2678 census tracts). The population sizes of the small areas varied inversely with their number in a given region.
Description of the nine European urban areas: number and type of small areas, total population and first, second and third quartiles of the population by small area in the first year available, for men and women.
| Urban area | Short name | Number of small areas | Type of small areas | Population(first year available) | |||||||
|---|---|---|---|---|---|---|---|---|---|---|---|
| Men | Women | ||||||||||
| Total | p25 | p50 | p75 | Total | p25 | p50 | p75 | ||||
| Athens metropolitan area | Athens | 40 | Municipalities | 1.577.172 | 18.565 | 29.745 | 35.489 | 1.710.446 | 20.136 | 32.163 | 39.965 |
| Barcelona city | Barcelona | 1491 | Census tracts | 697.563 | 365 | 457 | 577 | 796.497 | 418 | 517 | 648 |
| Berlin-Brandenburg Metropolregion | Berlin | 30 | Parishes for Berlin and municipalities for Brandenburg | 2.927.616 | 66.326 | 96.176 | 129.157 | 3.047.188 | 68.041 | 97.454 | 130.560 |
| Brussels-capital region | Brussels | 145 | Neighbourhoods | 464.364 | 2.727 | 4.004 | 5.707 | 505.673 | 3.058 | 4.288 | 6.172 |
| Lisbon metropolitan area | Lisbon | 188 | Parishes | 1.275.813 | 2.694 | 5.437 | 8.962 | 1.386.314 | 2.938 | 5.835 | 9.904 |
| Greater London | London | 983 | Census tracts | 3.597.120 | 3.442 | 3.810 | 4.284 | 3.725.283 | 3.526 | 3.960 | 4.382 |
| Prague city | Prague | 57 | Districts | 549.652 | 1.010 | 2.206 | 15.001 | 610.466 | 1.024 | 2.100 | 14.838 |
| Stockholm metropolitan area | Stockholm | 1299 | Census tracts | 897.487 | 218 | 560 | 1.050 | 936.977 | 232 | 599 | 1.104 |
| Turin city | Turin | 2678 | Census tracts | 425.782 | 88 | 129 | 196 | 465.987 | 96 | 142 | 215 |
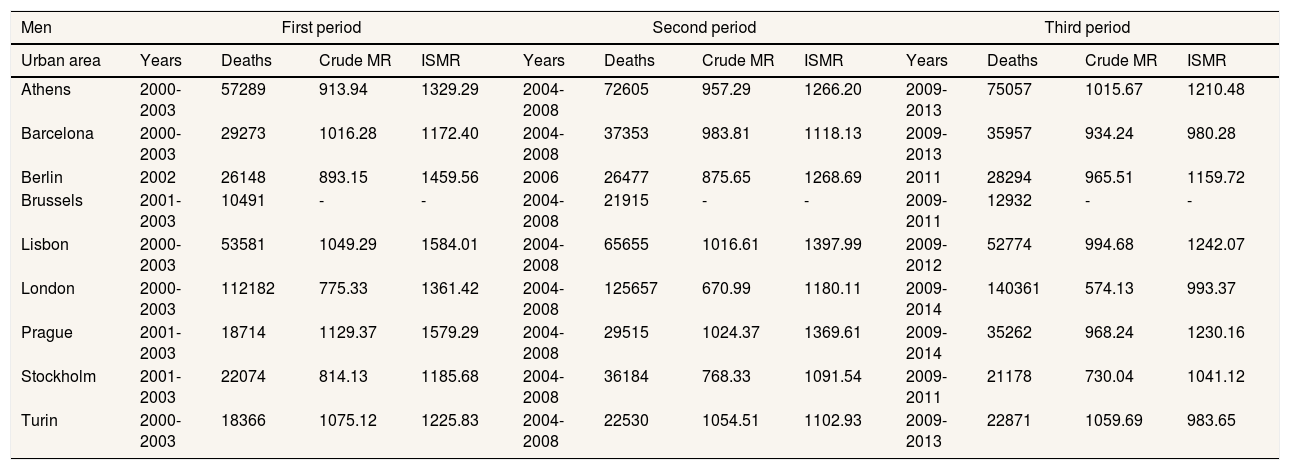
The periods of analyses, deaths and crude and indirectly standardised mortality ratios (ISMR) are described in Table 2. Indirectly standardised mortality rates tend to diminish over time in all urban areas (second with respect to the first period, and third with respect to the second period).
Description of mortality in each urban area: years, number of deaths, crude mortality rate and indirectly standardized mortality rate by 100,000 inhabitants, for men and women in each study period.
| Men | First period | Second period | Third period | |||||||||
|---|---|---|---|---|---|---|---|---|---|---|---|---|
| Urban area | Years | Deaths | Crude MR | ISMR | Years | Deaths | Crude MR | ISMR | Years | Deaths | Crude MR | ISMR |
| Athens | 2000-2003 | 57289 | 913.94 | 1329.29 | 2004-2008 | 72605 | 957.29 | 1266.20 | 2009-2013 | 75057 | 1015.67 | 1210.48 |
| Barcelona | 2000-2003 | 29273 | 1016.28 | 1172.40 | 2004-2008 | 37353 | 983.81 | 1118.13 | 2009-2013 | 35957 | 934.24 | 980.28 |
| Berlin | 2002 | 26148 | 893.15 | 1459.56 | 2006 | 26477 | 875.65 | 1268.69 | 2011 | 28294 | 965.51 | 1159.72 |
| Brussels | 2001-2003 | 10491 | - | - | 2004-2008 | 21915 | - | - | 2009-2011 | 12932 | - | - |
| Lisbon | 2000-2003 | 53581 | 1049.29 | 1584.01 | 2004-2008 | 65655 | 1016.61 | 1397.99 | 2009-2012 | 52774 | 994.68 | 1242.07 |
| London | 2000-2003 | 112182 | 775.33 | 1361.42 | 2004-2008 | 125657 | 670.99 | 1180.11 | 2009-2014 | 140361 | 574.13 | 993.37 |
| Prague | 2001-2003 | 18714 | 1129.37 | 1579.29 | 2004-2008 | 29515 | 1024.37 | 1369.61 | 2009-2014 | 35262 | 968.24 | 1230.16 |
| Stockholm | 2001-2003 | 22074 | 814.13 | 1185.68 | 2004-2008 | 36184 | 768.33 | 1091.54 | 2009-2011 | 21178 | 730.04 | 1041.12 |
| Turin | 2000-2003 | 18366 | 1075.12 | 1225.83 | 2004-2008 | 22530 | 1054.51 | 1102.93 | 2009-2013 | 22871 | 1059.69 | 983.65 |
| Women | First period | Second period | Third period | |||||||||
|---|---|---|---|---|---|---|---|---|---|---|---|---|
| Urban area | Years | Deaths | Crude MR | ISMR | Years | Deaths | Crude MR | ISMR | Years | Deaths | Crude MR | ISMR |
| Athens | 2000-2003 | 56116 | 825.04 | 982.35 | 2004-2008 | 72172 | 873.49 | 918.19 | 2009-2013 | 75402 | 930.85 | 853.27 |
| Barcelona | 2000-2003 | 30374 | 933.19 | 721.60 | 2004-2008 | 39335 | 933.80 | 710.23 | 2009-2013 | 39347 | 924.69 | 667.14 |
| Berlin | 2002 | 32571 | 1068.89 | 1067.22 | 2006 | 30731 | 986.41 | 935.49 | 2011 | 30257 | 990.74 | 847.86 |
| Brussels | 2001-2003 | 12793 | - | - | 2004-2008 | 26302 | - | - | 2009-2011 | 15292 | - | - |
| Lisbon | 2000-2003 | 50900 | 915.51 | 1002.16 | 2004-2008 | 62484 | 878.87 | 886.45 | 2009-2012 | 51575 | 873.87 | 812.25 |
| London | 2000-2003 | 120110 | 803.55 | 1018.40 | 2004-2008 | 131077 | 678.16 | 903.58 | 2009-2014 | 143304 | 572.66 | 787.47 |
| Prague | 2001-2003 | 21317 | 1164.47 | 1060.48 | 2004-2008 | 32758 | 1055.24 | 929.31 | 2009-2014 | 38139 | 989.32 | 855.36 |
| Stockholm | 2001-2003 | 24154 | 854.90 | 880.23 | 2004-2008 | 39558 | 812.04 | 839.40 | 2009-2011 | 23654 | 795.13 | 854.07 |
| Turin | 2000-2003 | 19803 | 1059.50 | 826.11 | 2004-2008 | 24085 | 1027.39 | 765.82 | 2009-2013 | 25257 | 1063.57 | 716.15 |
ISMR: indirectly standardized mortality rate; MR: mortality rate.
Note: Crude MR and ISMR are not displayed for Brussels as population data were interpolated.
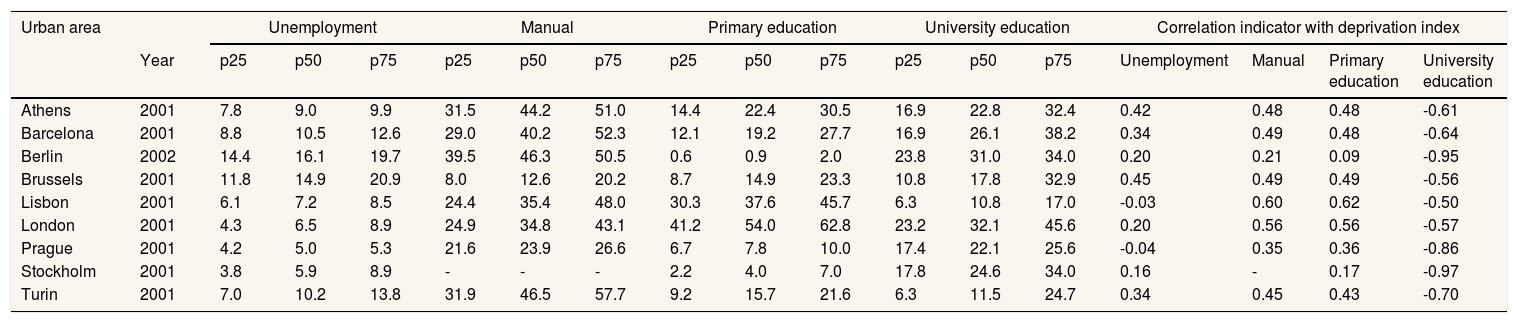
Table 3 shows the socioeconomic indicators and their correlation with deprivation index. Prague is the area with the lowest median percentages of unemployment, Brussels-Capital Region has the lowest median percentages of manual workers, Berlin-Brandenburg has the lowest median percentages of people with primary education at most, and Greater London the highest median percentages of university education. Conversely, Berlin-Brandenburg is the area with the highest median percentage of unemployment, Turin has the highest percentage of manual workers, Greater London has the highest percentages of people with primary education at most (although in this case the variable was constructed in a different way to the other cities), followed by Lisbon, which also has the lowest percentages of university education. The deprivation index shows a high negative correlation with the percentage of university education (all above 0.5), and a generally positive correlation with the other variables. In particular, a moderate positive correlation is shown with the percentage of manual workers and individuals with primary education only, and a lower correlation with the percentage of unemployment, in some cases around 0.
Description of the socioeconomic indicators: year, first, second and third quartiles of the indicators by small area. Correlation between the indicators and the composite deprivation index.
| Urban area | Unemployment | Manual | Primary education | University education | Correlation indicator with deprivation index | ||||||||||||
|---|---|---|---|---|---|---|---|---|---|---|---|---|---|---|---|---|---|
| Year | p25 | p50 | p75 | p25 | p50 | p75 | p25 | p50 | p75 | p25 | p50 | p75 | Unemployment | Manual | Primary education | University education | |
| Athens | 2001 | 7.8 | 9.0 | 9.9 | 31.5 | 44.2 | 51.0 | 14.4 | 22.4 | 30.5 | 16.9 | 22.8 | 32.4 | 0.42 | 0.48 | 0.48 | -0.61 |
| Barcelona | 2001 | 8.8 | 10.5 | 12.6 | 29.0 | 40.2 | 52.3 | 12.1 | 19.2 | 27.7 | 16.9 | 26.1 | 38.2 | 0.34 | 0.49 | 0.48 | -0.64 |
| Berlin | 2002 | 14.4 | 16.1 | 19.7 | 39.5 | 46.3 | 50.5 | 0.6 | 0.9 | 2.0 | 23.8 | 31.0 | 34.0 | 0.20 | 0.21 | 0.09 | -0.95 |
| Brussels | 2001 | 11.8 | 14.9 | 20.9 | 8.0 | 12.6 | 20.2 | 8.7 | 14.9 | 23.3 | 10.8 | 17.8 | 32.9 | 0.45 | 0.49 | 0.49 | -0.56 |
| Lisbon | 2001 | 6.1 | 7.2 | 8.5 | 24.4 | 35.4 | 48.0 | 30.3 | 37.6 | 45.7 | 6.3 | 10.8 | 17.0 | -0.03 | 0.60 | 0.62 | -0.50 |
| London | 2001 | 4.3 | 6.5 | 8.9 | 24.9 | 34.8 | 43.1 | 41.2 | 54.0 | 62.8 | 23.2 | 32.1 | 45.6 | 0.20 | 0.56 | 0.56 | -0.57 |
| Prague | 2001 | 4.2 | 5.0 | 5.3 | 21.6 | 23.9 | 26.6 | 6.7 | 7.8 | 10.0 | 17.4 | 22.1 | 25.6 | -0.04 | 0.35 | 0.36 | -0.86 |
| Stockholm | 2001 | 3.8 | 5.9 | 8.9 | - | - | - | 2.2 | 4.0 | 7.0 | 17.8 | 24.6 | 34.0 | 0.16 | - | 0.17 | -0.97 |
| Turin | 2001 | 7.0 | 10.2 | 13.8 | 31.9 | 46.5 | 57.7 | 9.2 | 15.7 | 21.6 | 6.3 | 11.5 | 24.7 | 0.34 | 0.45 | 0.43 | -0.70 |
Note: Primary education stands for ISCED 0 and 1 except for London where it stands for ISCED 0, 1 and 2.
Figure 1 shows the distribution of the deprivation index and the sSMR for the three periods among men living in London and women living in Barcelona (chosen for descriptive purposes). Men living in areas in London with lower deprivation (green, mainly in the inner part of London) also have lower mortality (green). Conversely, areas with higher deprivation (brown) tend to show higher mortality. However, we do not observe similar patterns in socioeconomic deprivation and mortality among women in Barcelona.

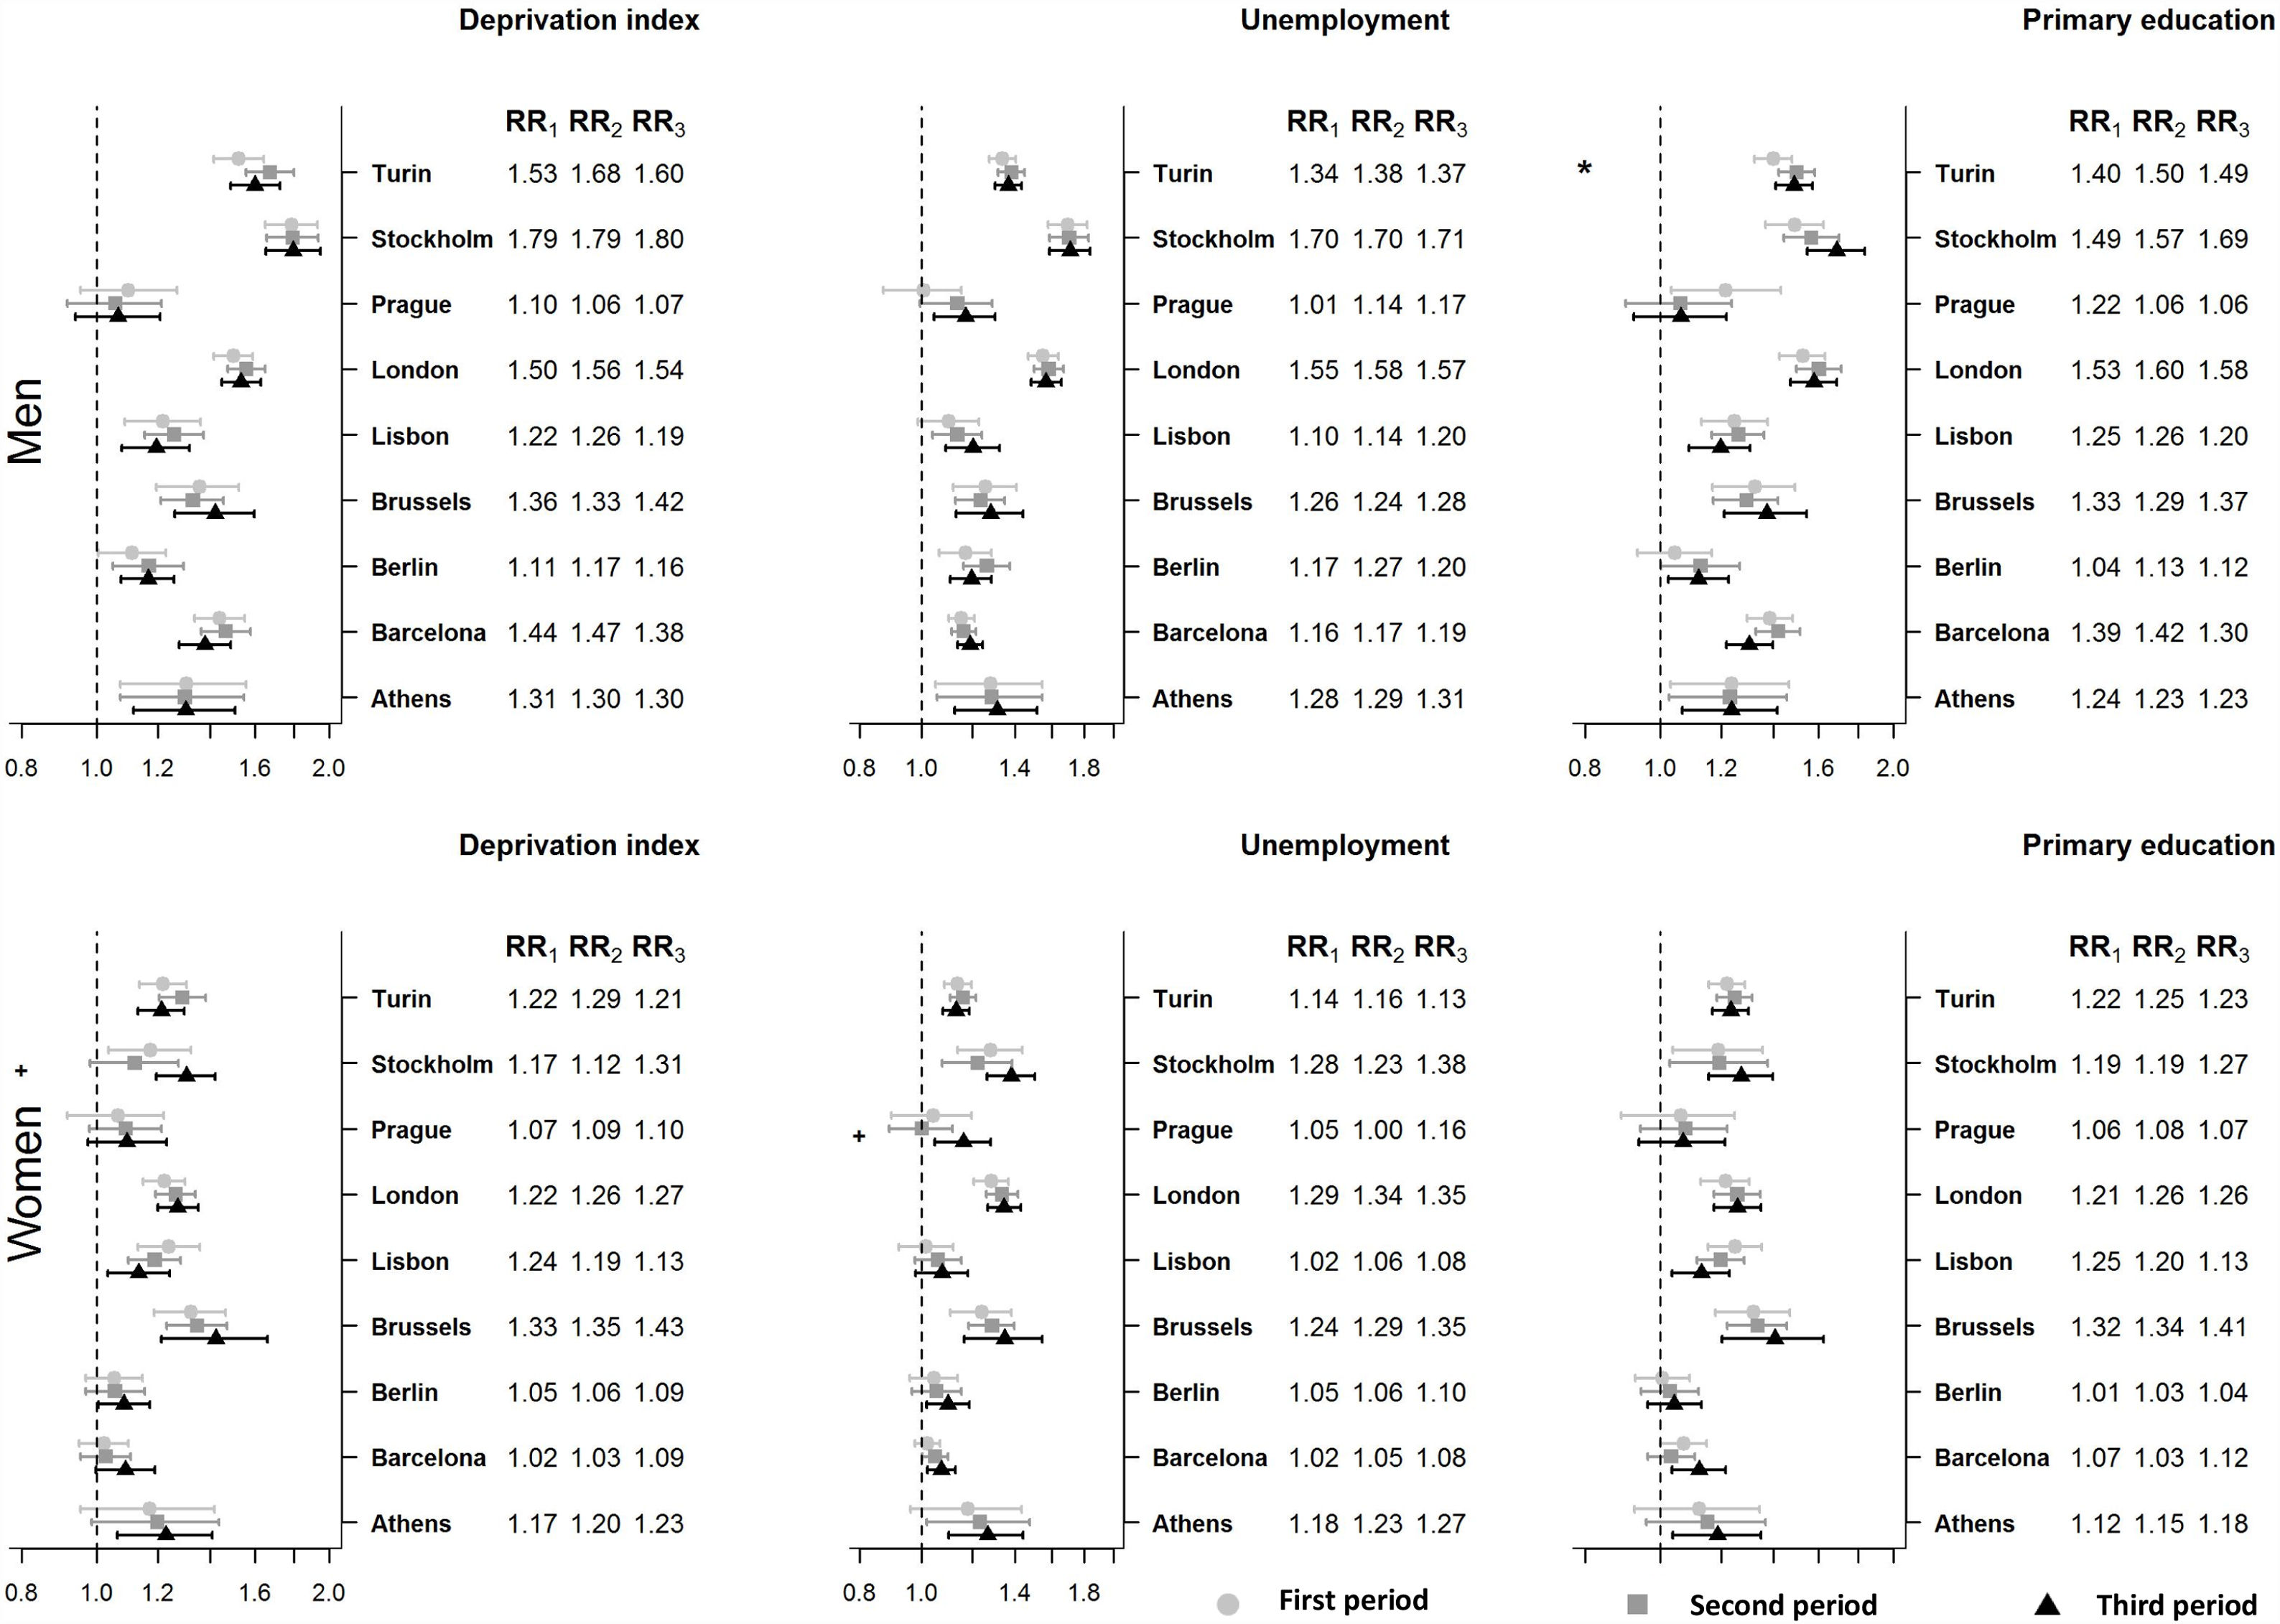
Figure 2 illustrates, for each of the three periods, the relative risks of mortality for the 5% of small areas with the highest deprivation compared to the 5% of small areas with the lowest deprivation, as well as the levels of statistical significance of their difference. Also shown is the relationship of unemployment and primary education with mortality. Regarding the deprivation index, we see significant inequalities (credible interval not containing 1) among men in all periods and areas, except for Prague where there were no significant inequalities in any of the periods. The greatest inequalities were found in Stockholm, where the areas with highest deprivation have around 80% higher mortality than those with the lowest deprivation. The results for primary education are similar with minor differences. For example, there were significant inequalities in Prague during the first period, but not in Berlin-Brandenburg. In addition, there was a statistically significant increase in inequalities between the first and second periods in Turin. Results were also similar for unemployment.

Association between socioeconomic indicators and mortality, relative risk (RR) and 95% credible intervals (CI) for men and women in nine urban areas (Note 1: RRi corresponds to the increase in risk that would correspond to a change in the composite deprivation index from its 5th percentile value (low deprivation) to its 95th percentile value (severe deprivation) in the period i; Note 2: * indicates that RR2 is statistically significantly different than RR1 and + means that RR3 is statistically significantly different than RR2).
The number of significant inequalities was much lower among women (Fig. 2). According to the deprivation index, there were inequalities during all periods in Brussels, Lisbon, London, and Turin. Inequalities became significant during the third period in Athens and Berlin (although this change was not statistically significant). Inequalities were not significant in any of the periods in Prague or Barcelona, although in Barcelona they were almost statistically significant during the last period. There were inequalities in Stockholm during the first period, but these disappeared in the second and appeared again in the last period; this change was statistically significant. In this case, women in areas with highest deprivation have 31% higher mortality than those from areas with the lowest deprivation. Overall, the results were similar for primary education and for unemployment. In Prague, unemployment inequalities appeared in the third period, where the change from the second period is statistically significant. In the third period, women from areas with the highest unemployment have 16% higher mortality than those from areas with the lowest unemployment.
DiscussionIn this study, we found statistically significant inequalities in mortality among men for almost all of the socioeconomic indicators, periods, and urban areas studied. However, for all urban areas, no statistically significant changes occurred in the period of economic crisis (third period) when compared to the previous period. In women, statistically significant inequalities in mortality were less common. However, there was a statistically significant increase in deprivation and unemployment inequalities during the crisis period in Stockholm and Prague, respectively. For some urban areas and indicators, there were no significant inequalities in the two first periods, although there were statistically significant inequalities in the third period.
Changes in mortality due to the economic crisisThere has been much debate about whether mortality rates increase or decrease during economic crises.12,27-33 There has been little consensus, except for the general observation that the number of suicides increases and that of traffic injuries decreases, at least during recent economic crises.5,34-36
We did not find any previous studies that focused on urban areas, so it is difficult to compare our results with others. Nevertheless, we observe that mortality during the crisis seems to follow the downward trend observed before the crisis. However, it is not possible to determine whether the rate was different to that in the periods prior to the crisis.
Changes in socioeconomic inequalities in mortalityEven if mortality does not increase for the entire population during periods of economic crisis, it may increase in certain socioeconomic groups, e.g. in socioeconomically deprived groups, who are more negatively affected by economic crises14. Some studies have shown an increase in inequalities following previous crises, such as during the Southeast Asian, Japanese, and Soviet Union crises, whereas these patterns were not so clear for the Nordic countries.14 Following the recent crisis, two studies reported an increase in socioeconomic inequalities in total mortality in two areas of Spain (Barcelona city and Andalucía autonomous community), one of which found increasing inequalities in men only.16,17 Two other studies found a decrease in inequalities in premature mortality in Spain18 and in the Lisbon Metropolitan area.19 The last authors suggest that the decrease in inequalities is due to stability or deterioration of health in the middle and upper-middle social groups, and improvements in the most disadvantaged groups. They argue that this is probably an unexpected effect of austerity policies, which have promoted the emergence of newly-deprived and vulnerable groups.19
In our study we did not find statistically significant changes between periods in socioeconomic inequalities in men. Two statistically significant changes occurred among women in the crisis period: deprivation inequalities increased in Stockholm, and unemployment inequalities increased in Prague. These countries were not affected especially hard by the economic crisis compared to other countries, and indeed to other crises.37,38 In addition, they have quite different state welfare policies.39 It is well known that Sweden has one of the most generous welfare policies, so the strong inequalities found are quite counterintuitive.
Differences in inequality due to genderIn our study we found more socioeconomic inequalities among men than among women, which has already been reported in previous studies.38 Surprisingly, however, we found some increases in inequality among women only. Allowing for spurious relationships and factors other than the crisis that could provoke such an increase in inequalities, other studies have indeed found similar results. The economic crisis of 1994 in Sweden was associated with greater inequalities in suicide among women, which was partially related to greater job insecurity and poorer working conditions in the female-dominated public sector after the recession.40 In the late 1990s economic crisis in South Korea, following neoliberal restructuring imposed by the IMF, females of working age were more affected than males in terms of life expectancy and mortality.41 These authors argued that, since the economic crisis, women from disadvantaged classes had to join the labour force to compensate for their husbands’ unemployment and wage cuts, and thus suffered both household economic collapse and unstable working conditions.41
Limitations and strengthsWe only had socioeconomic data for 1 year and thus considered them constant during all of the periods. Although socioeconomic indicators may have changed, the ranking of the areas in terms of deprivation did not change much and we were not using the value itself but only the distribution.
The sizes of the small areas differ between the urban areas studied, in fact some of the areas may not be considered as small areas given their size, which may partly explain why the results are not consistent. Smaller areas are more homogeneous and the possibility of observing higher effects is higher, which may be the case in Stockholm, London and Turin. So the comparison of RRs among urban areas is not very suitable in this case.
Finally, we did not consider any lag between the cause (economic recession) and its effects (mortality). It has been reported that the impact of unemployment and other adverse circumstances on health in times of crisis only becomes evident after many years, especially in disadvantaged populations.14
However, this study has important strengths. It fills the gap in research related to the effect of the crisis on socioeconomic inequalities in mortality in urban areas. Also, it reports mortality and socioeconomic data collected in a comparable way for a number of urban areas from different parts of Europe.
ConclusionsWe observe persistent socioeconomic inequalities in mortality among men, but these did not change during the periods studied. While inequalities among women were less common, there was a statistically significant increase in inequality for certain indicators and areas studied. Future analyses should consider a time lag between the crisis and mortality and specific causes of death, and should pay special attention to differential effects between genders.
Socioeconomic inequalities in health tend to be greater in urban areas.
There have been contradictory results regarding the impact of economic recessions on all-cause mortality.
What does this study add to the literature?Significant inequalities in mortality among men were found for almost all the socioeconomic indicators, periods and urban areas studied. However, no significant changes occurred in the period of economic crisis. In women, inequalities were less frequent. However, in two urban areas there were statistically significant increases in inequalities in the crisis period.
María-Victoria Zunzunegui.
Transparency declarationThe corresponding author on behalf of the other authors guarantee the accuracy, transparency and honesty of the data and information contained in the study, that no relevant information has been omitted and that all discrepancies between authors have been adequately resolved and described.
Authorship contributionsL. Palència, M. Gotsens, M. Marí-dell’Olmo and C. Borrell designed the paper, and analysed and interpreted the data. L. Bosakova, B. Burström, C. Costa, P. Deboosere, D. Dzurova, M. Lustigova, J. Morrison and P. Santana provided and interpreted the data. L. Palència and C. Borrell wrote the first version of the manuscript. M. Gotsens, M. Marí-dell’Olmo, L. Bosakova, B. Burström, C. Costa, P. Deboosere, D. Dzurova, M. Lustigova, J. Morrison and P. Santana revised it critically. All authors read and approved the final manuscript.
Acknowle**dgementsWe thank Sani Dimitroulopoulou and Christina Mitsakou for providing the data from London, Klea Katsouyanni for the data from Athens, Jürgen Schweikart and Conrad Franke for the data from Berlin, and Giuseppe Costa and Nicolás Zangarini for the data from Turin.
FundingThis study is a part of the EURO-HEALTHY project (Shaping EUROpean policies to promote HEALTH equity) and has received funding from the European Union's Horizon 2020 research and innovation programme (Grant Agreement No 643398). Dagmar Dzúrová and Michala Lustigova were also supported by Charles University (UNCE/HUM 018).
Cláudia Costa was supported by an Individual Doctoral Fellowship funded by the Foundation for Science and Technology, FCT (SFRH/BD/132218/2017).
Conflicts of interestsNone.


