


Conocer la incidencia de cáncer en Guipúzcoa entre 1998 y 2002, y su evolución desde 1986.
MétodosSe realizan estimaciones de incidencia anual del cáncer en el perÍodo 1998-2002, para Guipúzcoa, en tasas por 100.000 habitantes. Se analiza su evolución entre 1986 y 2002 en el conjunto de localizaciones y en las más frecuentes, mediante el modelo de regresión de Poisson y el modelo de regresión joinpoint en tumores de próstata.
ResultadosUno de cada 3 varones y una de cada 5 mujeres de Guipúzcoa tienen la probabilidad de desarrollar cancer a lo largo de su vida (rango, 0-74 años). En varones, el cáncer de próstata ocupa el primer lugar, seguido del cancer de pulmón. En mujeres, el cáncer de mama representa cerca del 30% del total (excluido el de piel no melanoma). Se observa un incremento anual de incidencia en varones del 1,5% (intervalo de confianza [IC] del 95%, 1,1-1,8) y del 0,9% (IC del 95%, 0,5-1,3) en mujeres. Aumentan los tumores de próstata en varones, especialmente en el período 1996-1999 en un 34,7% anual (IC del 95%, 5,9-71,5) y el cáncer de pulmón en las mujeres en un 5,2% anual (IC del 95%, 3,4-7,1), mientras que los tumores de estómago descienden en el período de estudio.
ConclusionesLa incidencia de cáncer en Guipúzcoa aumenta en el período de estudio; destacan los tumores de pulmón y melanoma cutáneo, donde las estrategias preventivas desempeñan un papel primordial.
To determine the cancer incidence in Gipuzkoa (Spain) from 1998 to 2002 and describe time trends since 1986.
MethodsThe annual incidence of cancer in Gipuzkoa from 1998 to 2002 was estimated as a rate per 100,000 inhabitants. Incidence trends for the period 1986-2002 were studied for all cancers and for the main cancer sites using Poisson regression and joinpoint regression for prostate tumours.
ResultsOn average, one in 3 men and one in 5 women would probably be diagnosed with cancer at some time during their life (0-74 years). Among men, prostate surpassed lung as the most frequent cancer site. Among women, breast cancer represented approximately 30% of all cases of cancer (excluding non-melanoma skin cancers). There was an annual increase in the incidence of cancer of 1.5% (95% CI, 1.1-1.8) in men and 0.9% (95% CI, 0.5-1.3) in women. The incidence of prostate cancer in men increased over the study period, and especially between 1996 and 1999, with an annual increase of 34.7% (95% CI, 5.9-71.5). The incidence of lung cancer in women presented an annual increase of 5.2% (95% CI, 3.4- 7.1). In contrast, the incidence of stomach cancer decreased during the study period.
ConclusionsCancer incidence in Gipuzkoa increased during the study period. This increase was particularly marked in lung cancer and skin melanoma, for which preventive strategies are fundamental.
Cancer is one of the most important public health problems in our community, as in other regions. It has enormous health and socio-economic implications and constitutes the most frequent cause of premature and avoidable death. In Gipuzkoa 1,600 people die of cancer every year and 3,000 new neoplasms are diagnosed. Cancer is identified as one of the priority health problems within the scope of the Euskadi Health Plan1.
It is also known that the incidence of different types of cancer varies from one country to another, depending on etiological factors and also on the availability of efficient methods of prevention, diagnosis and treatment2. Obtaining the most accurate data possible relating to these aspects therefore constitutes the first step towards appropriately planning prevention programs and assigning the health resources required to achieve more efficient results, in accordance with the scientific evidence available at any given time.
Population based cancer registry is an essential part of any rational program of cancer control3. Its primary function is to keep a file or register of all cases occurring in a defined population. The registry analyses and interprets such data periodically and provides information on the epidemiology of cancer. The value of a cancer registry depends on the quality of its data and the extent to which they are used in research and health service planning4. Quality control carried out at the local level for each of the registries is undoubtedly reinforced by international collaboration5-9.
The aim of this study was to provide insights into the epidemiology of invasive cancer in Gipuzkoa by analyzing population based incidence and time trends, with special emphasis on sex and site-specific changes over time.
MethodsThe study of cancer incidence included all invasive neoplasms (except epidermoid and basocellular skin tumours) diagnosed in residents of Gipuzkoa during the period 1998-2002. According to the 2001 census, this population numbered 673,563 (330,454 men and 343,109 women). The period was extended to 1986-2002 to analyse time trends. Population estimates in the denominator for calculation of incidence rates were obtained from the Basque Institute of Statistics.
The main sources of information for the population cancer registry were the 2 hospital cancer registries available in Gipuzkoa (Hospital Donostia and Instituto Oncológico). These institutions actively search for cases in the Pathological Anatomy (biopsies, cytologies and autopsies) and Clinical Documentation (hospital discharges) services, and also in other services. Similar data were actively collected and compiled at other public, concerted and private hospitals in Gipuzkoa. Death certificates (DC) were also consulted. Finally, cases were regularly obtained from the cancer registries of neighbouring communities.
The use of multiple sources makes it possible for the same case to be received more than once, so data were cross-checked in order to avoid duplication. Duplication, processing and concordance control were duly carried out in all cases identified as being new to the registry. The automatic quality control program IARC-CHECK10 was used as the final tool for controlling the quality of the data processed.
The variables used in the study were: a) personal data: gender and age; b) tumour data: anatomical site of the primary tumour and its morphology, codified according to the 2nd edition of the International Classification of Diseases for Oncology (ICD-O-II)11, and date of diagnosis or incidence, and c) quality indicators: diagnostic basis, indicating the most valid basis for diagnosis and grouped into 2 categories, non-microscopic (clinical, clinical research, surgery and tumour markers) and microscopic (cytology, histology and autopsy). Cases whose only source of information was the DC were assigned to a separate category.
Data analysisThe average annual incidence of cancer in Gipuzkoa for the period 1998-2002 is presented for all sites together, and also for specific sites, and expressed in rates per 100,000 persons at risk per year. Crude, age-specific and age-standardized incidence rates were calculated by gender, using the direct method and adjusted with European and World population data3. Furthermore, cumulative incidence rates were calculated for each site and gender, from birth to 65 and 75 years of age.
The cancer incidence trend for the period 1986-2002 was studied for all tumours and the most frequent sites. The general trend was quantified by applying the Poisson regression12, after adjusting for age, with separate models for men and women. In this model, a linear trend was assumed for the logarithm of the rates. Goodness of fit was assessed by deviance and its degrees of freedom. The significance level was set at 0.05. In the case of prostate cancer, the Poisson model did not fit correlated as a result of changes in the trend during the study period. This was related to the generalised use of prostatic specific antigen (PSA) during the final 5-year period. A joinpoint regression model was therefore used to analyse the time-related trends for these tumours. This made it possible to estimate annual percentage change (APC) and to identify trend inflexion points when they were present13. For data analysis, we used version 9.1 of the SAS statistical package14 and version 3.0 of the Joinpoint Regression program15.
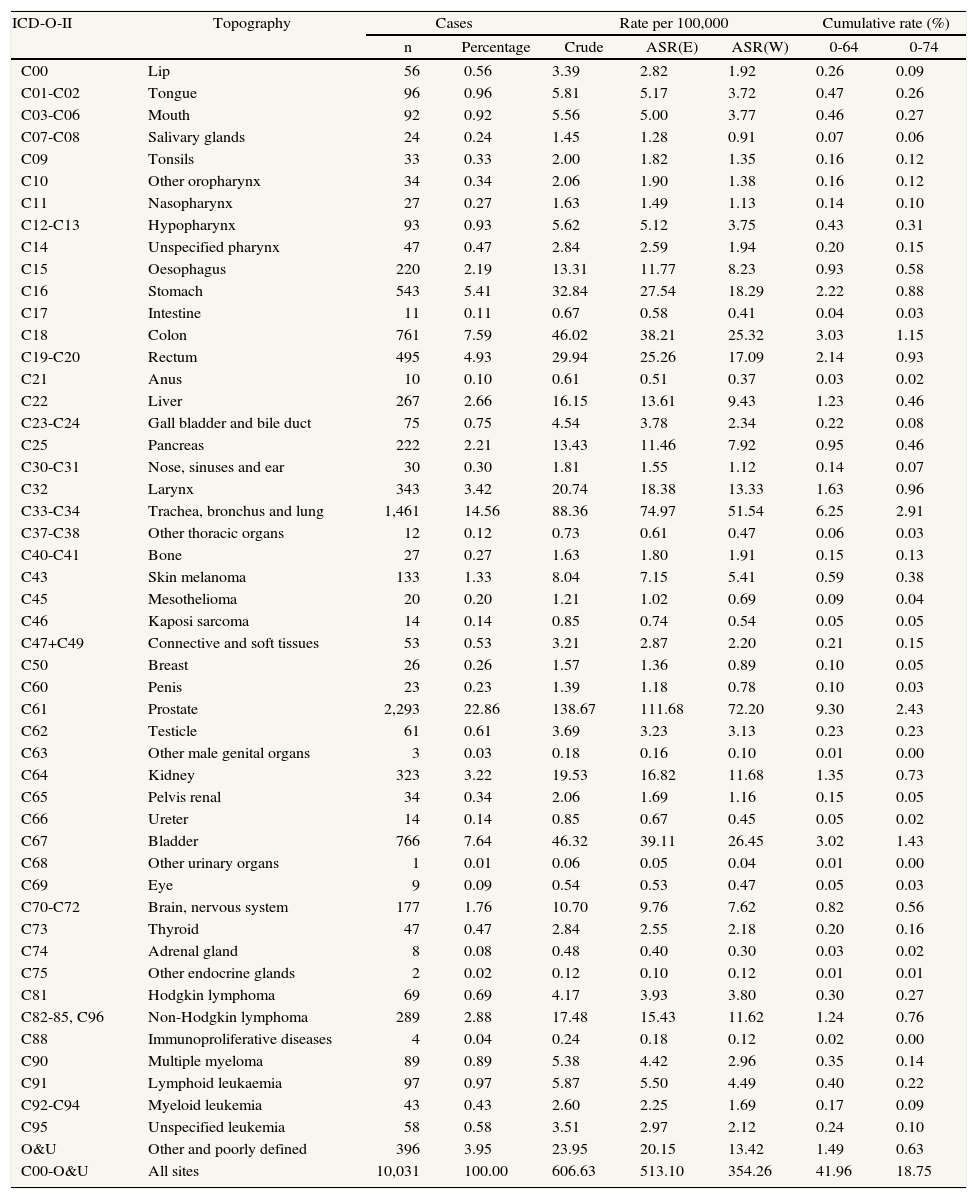
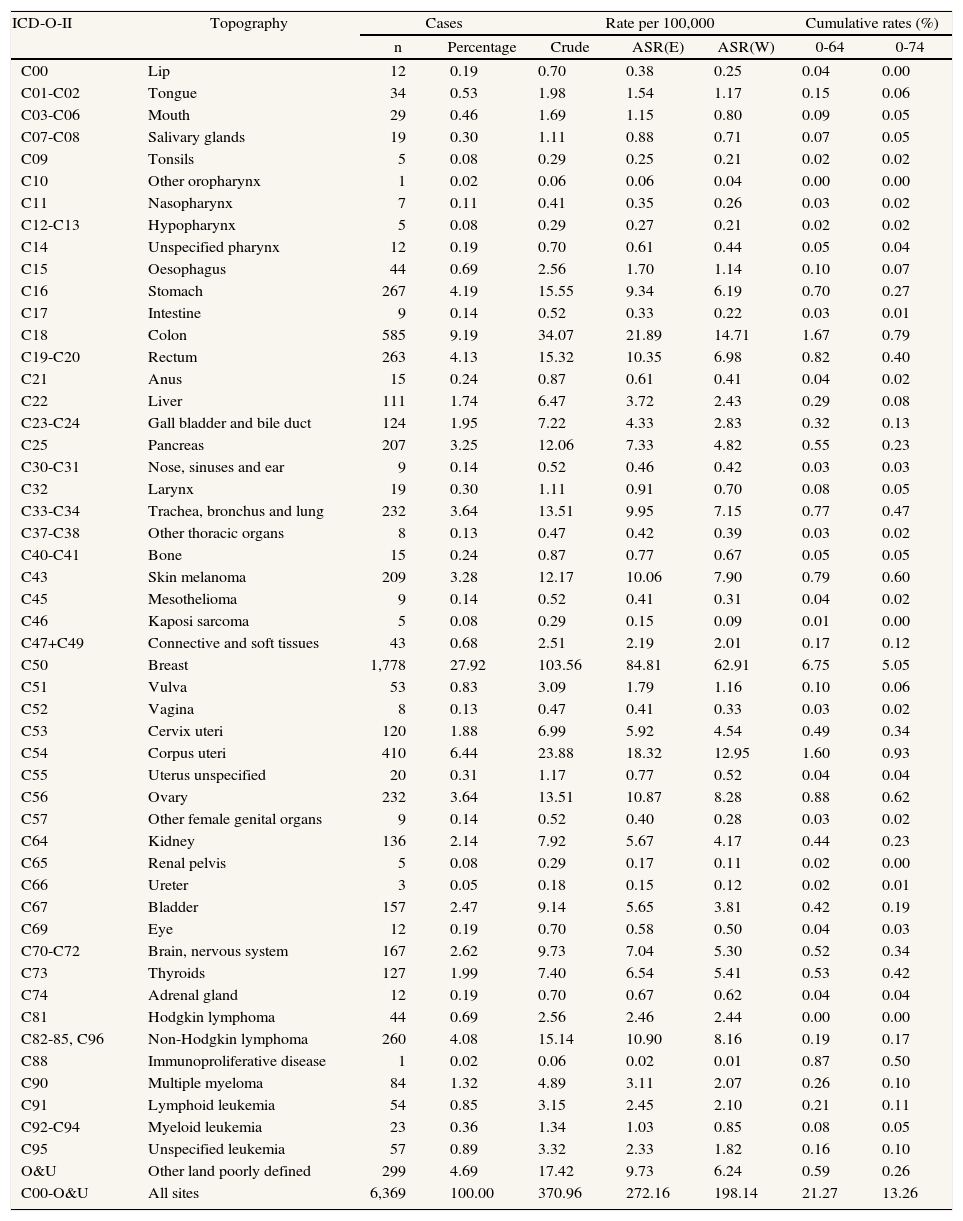
ResultsThe number of neoplasms registered in Gipuzkoa between the years 1998 and 2002 was 16,329, of which 9,991 were diagnosed in men and 6,338 in women. This meant a crude annual incidence rate, for the period 19982002, of 604.2 per 100,000 male inhabitants and 369.1 per 100,000 females.
During this 5-year period, 61% of the cancers registered in men and 54% of those in women were diagnosed in people over 65 years of age, with 26% and 32%, respectively, being diagnosed in men and women over 75 years of age. The cumulative rates for ages 0 to 64 were found to be 18.8% in men and 13.3% in women and those for ages 0 to 74 were, 42.0% in men and 21.3% in women.
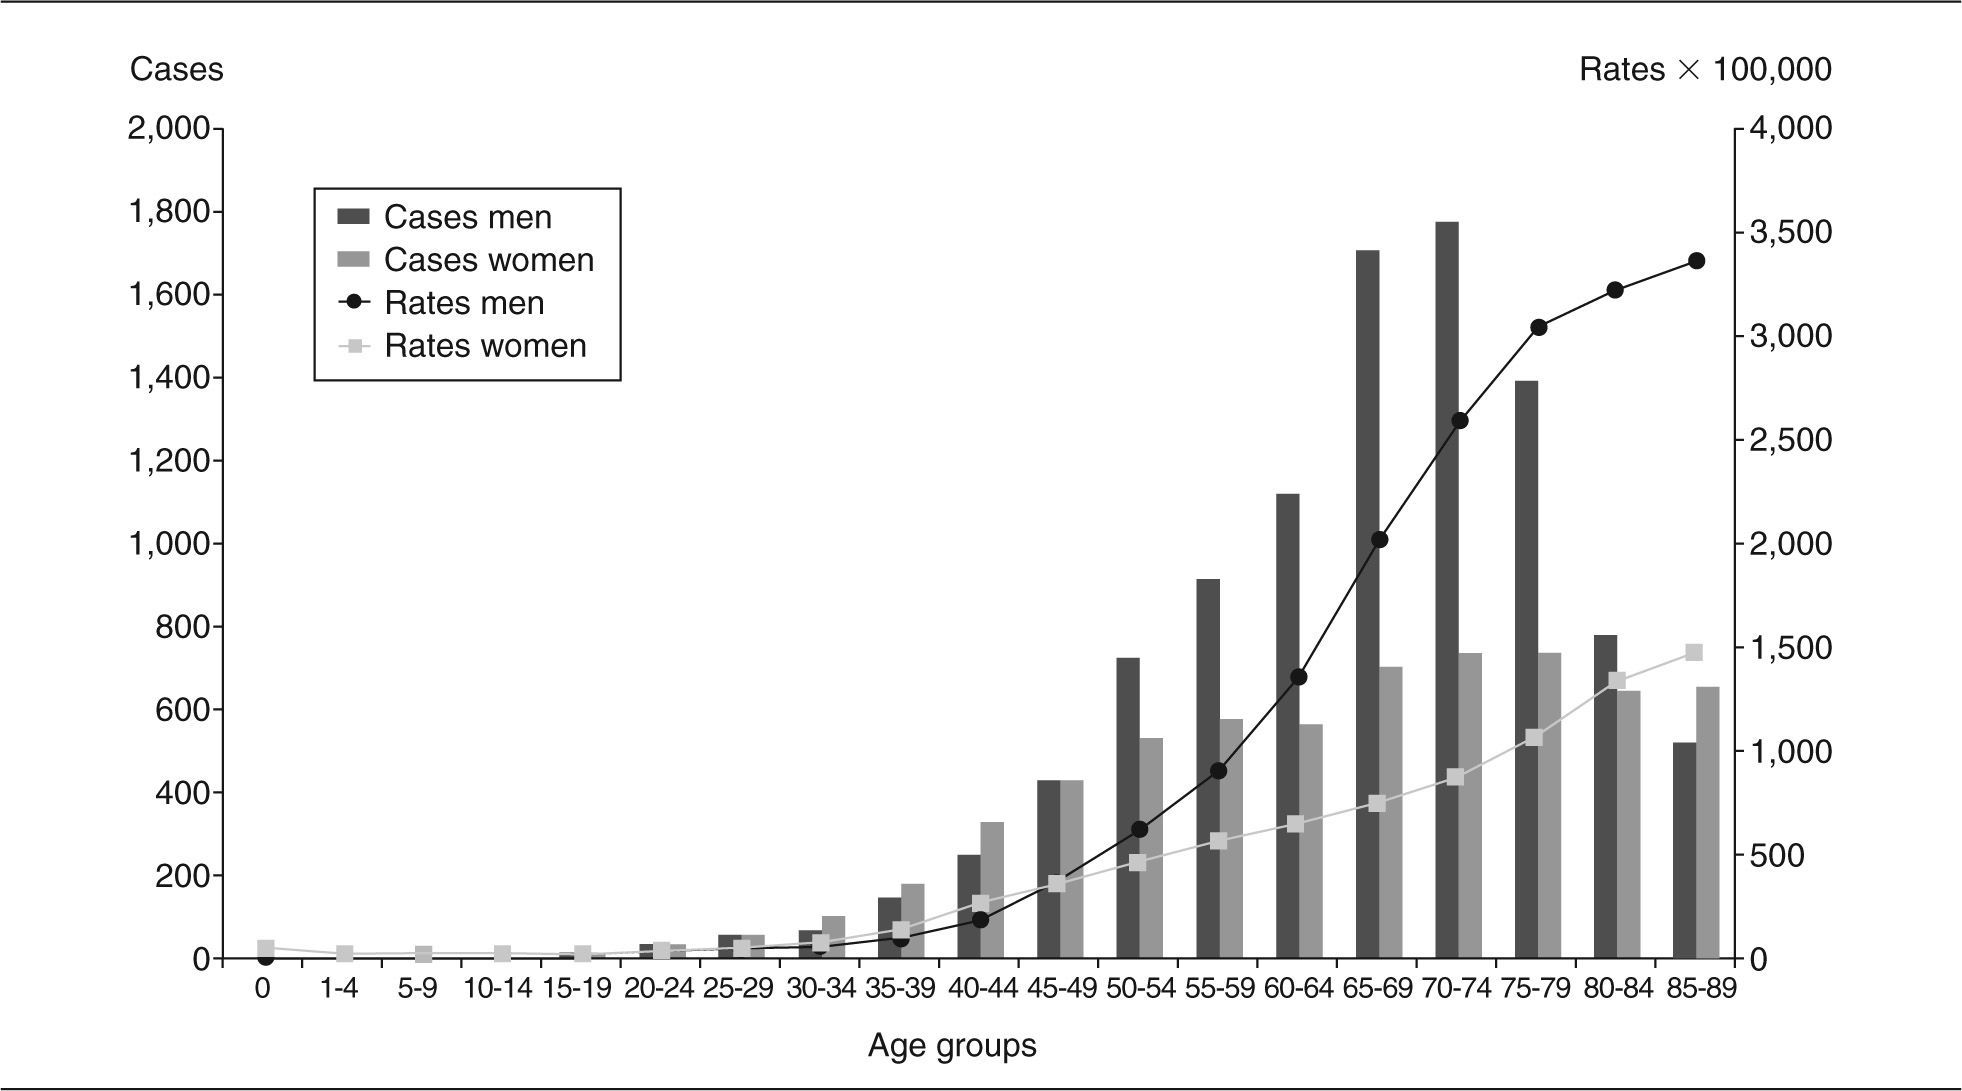
The incidence of cancer increased with age; rates were very similar for men and women until 20 years of age, but between 20 and 45 rates in females were higher than those in males. However, from this age on, there was a gradual increase in the incidence for both groups, with a more marked increase for men (fig. 1).

The mean age at diagnosis for the whole period was 65.5, with it greater for men (66.1 years) than for women (64.8 years). This was mainly due to the fact that average age at the appearance of breast tumours (60.3 years), the most frequent cancer in women, was lower than that of prostate tumours (71.4 years), the most common type of cancer in men. However, for the most frequent tumours common to both sexes, age at appearance was greater in women. This was the case of tumours located in the stomach (men 68.6, women 73.3), colon-rectum (men 68.3 and women 70.4), bladder (men 67.1, women 71.8) and oral cavity and pharynx (men 60.1 and women 63.0).
During the study period, the prostate (22.9%) was the most frequently affected site in men, followed by the tracheal-bronchial-lung (C33-C34: 14.6%) and colon-rectum (C18-C20: 12.6%) (table 1). Breast cancer (27.9%) was the most frequent neoplasm in women, followed by colorectal cancer (C18-C20: 13.4%) and cancer of the uterus (C53-C55: 8.7%) (table 2).
Cancer incidence in males in Gipuzkoa (1998-2002)
| ICD-O-II | Topography | Cases | Rate per 100,000 | Cumulative rate (%) | ||||
| n | Percentage | Crude | ASR(E) | ASR(W) | 0-64 | 0-74 | ||
| C00 | Lip | 56 | 0.56 | 3.39 | 2.82 | 1.92 | 0.26 | 0.09 |
| C01-C02 | Tongue | 96 | 0.96 | 5.81 | 5.17 | 3.72 | 0.47 | 0.26 |
| C03-C06 | Mouth | 92 | 0.92 | 5.56 | 5.00 | 3.77 | 0.46 | 0.27 |
| C07-C08 | Salivary glands | 24 | 0.24 | 1.45 | 1.28 | 0.91 | 0.07 | 0.06 |
| C09 | Tonsils | 33 | 0.33 | 2.00 | 1.82 | 1.35 | 0.16 | 0.12 |
| C10 | Other oropharynx | 34 | 0.34 | 2.06 | 1.90 | 1.38 | 0.16 | 0.12 |
| C11 | Nasopharynx | 27 | 0.27 | 1.63 | 1.49 | 1.13 | 0.14 | 0.10 |
| C12-C13 | Hypopharynx | 93 | 0.93 | 5.62 | 5.12 | 3.75 | 0.43 | 0.31 |
| C14 | Unspecified pharynx | 47 | 0.47 | 2.84 | 2.59 | 1.94 | 0.20 | 0.15 |
| C15 | Oesophagus | 220 | 2.19 | 13.31 | 11.77 | 8.23 | 0.93 | 0.58 |
| C16 | Stomach | 543 | 5.41 | 32.84 | 27.54 | 18.29 | 2.22 | 0.88 |
| C17 | Intestine | 11 | 0.11 | 0.67 | 0.58 | 0.41 | 0.04 | 0.03 |
| C18 | Colon | 761 | 7.59 | 46.02 | 38.21 | 25.32 | 3.03 | 1.15 |
| C19-C20 | Rectum | 495 | 4.93 | 29.94 | 25.26 | 17.09 | 2.14 | 0.93 |
| C21 | Anus | 10 | 0.10 | 0.61 | 0.51 | 0.37 | 0.03 | 0.02 |
| C22 | Liver | 267 | 2.66 | 16.15 | 13.61 | 9.43 | 1.23 | 0.46 |
| C23-C24 | Gall bladder and bile duct | 75 | 0.75 | 4.54 | 3.78 | 2.34 | 0.22 | 0.08 |
| C25 | Pancreas | 222 | 2.21 | 13.43 | 11.46 | 7.92 | 0.95 | 0.46 |
| C30-C31 | Nose, sinuses and ear | 30 | 0.30 | 1.81 | 1.55 | 1.12 | 0.14 | 0.07 |
| C32 | Larynx | 343 | 3.42 | 20.74 | 18.38 | 13.33 | 1.63 | 0.96 |
| C33-C34 | Trachea, bronchus and lung | 1,461 | 14.56 | 88.36 | 74.97 | 51.54 | 6.25 | 2.91 |
| C37-C38 | Other thoracic organs | 12 | 0.12 | 0.73 | 0.61 | 0.47 | 0.06 | 0.03 |
| C40-C41 | Bone | 27 | 0.27 | 1.63 | 1.80 | 1.91 | 0.15 | 0.13 |
| C43 | Skin melanoma | 133 | 1.33 | 8.04 | 7.15 | 5.41 | 0.59 | 0.38 |
| C45 | Mesothelioma | 20 | 0.20 | 1.21 | 1.02 | 0.69 | 0.09 | 0.04 |
| C46 | Kaposi sarcoma | 14 | 0.14 | 0.85 | 0.74 | 0.54 | 0.05 | 0.05 |
| C47+C49 | Connective and soft tissues | 53 | 0.53 | 3.21 | 2.87 | 2.20 | 0.21 | 0.15 |
| C50 | Breast | 26 | 0.26 | 1.57 | 1.36 | 0.89 | 0.10 | 0.05 |
| C60 | Penis | 23 | 0.23 | 1.39 | 1.18 | 0.78 | 0.10 | 0.03 |
| C61 | Prostate | 2,293 | 22.86 | 138.67 | 111.68 | 72.20 | 9.30 | 2.43 |
| C62 | Testicle | 61 | 0.61 | 3.69 | 3.23 | 3.13 | 0.23 | 0.23 |
| C63 | Other male genital organs | 3 | 0.03 | 0.18 | 0.16 | 0.10 | 0.01 | 0.00 |
| C64 | Kidney | 323 | 3.22 | 19.53 | 16.82 | 11.68 | 1.35 | 0.73 |
| C65 | Pelvis renal | 34 | 0.34 | 2.06 | 1.69 | 1.16 | 0.15 | 0.05 |
| C66 | Ureter | 14 | 0.14 | 0.85 | 0.67 | 0.45 | 0.05 | 0.02 |
| C67 | Bladder | 766 | 7.64 | 46.32 | 39.11 | 26.45 | 3.02 | 1.43 |
| C68 | Other urinary organs | 1 | 0.01 | 0.06 | 0.05 | 0.04 | 0.01 | 0.00 |
| C69 | Eye | 9 | 0.09 | 0.54 | 0.53 | 0.47 | 0.05 | 0.03 |
| C70-C72 | Brain, nervous system | 177 | 1.76 | 10.70 | 9.76 | 7.62 | 0.82 | 0.56 |
| C73 | Thyroid | 47 | 0.47 | 2.84 | 2.55 | 2.18 | 0.20 | 0.16 |
| C74 | Adrenal gland | 8 | 0.08 | 0.48 | 0.40 | 0.30 | 0.03 | 0.02 |
| C75 | Other endocrine glands | 2 | 0.02 | 0.12 | 0.10 | 0.12 | 0.01 | 0.01 |
| C81 | Hodgkin lymphoma | 69 | 0.69 | 4.17 | 3.93 | 3.80 | 0.30 | 0.27 |
| C82-85, C96 | Non-Hodgkin lymphoma | 289 | 2.88 | 17.48 | 15.43 | 11.62 | 1.24 | 0.76 |
| C88 | Immunoproliferative diseases | 4 | 0.04 | 0.24 | 0.18 | 0.12 | 0.02 | 0.00 |
| C90 | Multiple myeloma | 89 | 0.89 | 5.38 | 4.42 | 2.96 | 0.35 | 0.14 |
| C91 | Lymphoid leukaemia | 97 | 0.97 | 5.87 | 5.50 | 4.49 | 0.40 | 0.22 |
| C92-C94 | Myeloid leukemia | 43 | 0.43 | 2.60 | 2.25 | 1.69 | 0.17 | 0.09 |
| C95 | Unspecified leukemia | 58 | 0.58 | 3.51 | 2.97 | 2.12 | 0.24 | 0.10 |
| O&U | Other and poorly defined | 396 | 3.95 | 23.95 | 20.15 | 13.42 | 1.49 | 0.63 |
| C00-O&U | All sites | 10,031 | 100.00 | 606.63 | 513.10 | 354.26 | 41.96 | 18.75 |
ASR(E): age-standardized rates (European population); ASR(W): age-standardized rates (world population).
Cancer incidence in women Gipuzkoa (1998-2002)
| ICD-O-II | Topography | Cases | Rate per 100,000 | Cumulative rates (%) | ||||
| n | Percentage | Crude | ASR(E) | ASR(W) | 0-64 | 0-74 | ||
| C00 | Lip | 12 | 0.19 | 0.70 | 0.38 | 0.25 | 0.04 | 0.00 |
| C01-C02 | Tongue | 34 | 0.53 | 1.98 | 1.54 | 1.17 | 0.15 | 0.06 |
| C03-C06 | Mouth | 29 | 0.46 | 1.69 | 1.15 | 0.80 | 0.09 | 0.05 |
| C07-C08 | Salivary glands | 19 | 0.30 | 1.11 | 0.88 | 0.71 | 0.07 | 0.05 |
| C09 | Tonsils | 5 | 0.08 | 0.29 | 0.25 | 0.21 | 0.02 | 0.02 |
| C10 | Other oropharynx | 1 | 0.02 | 0.06 | 0.06 | 0.04 | 0.00 | 0.00 |
| C11 | Nasopharynx | 7 | 0.11 | 0.41 | 0.35 | 0.26 | 0.03 | 0.02 |
| C12-C13 | Hypopharynx | 5 | 0.08 | 0.29 | 0.27 | 0.21 | 0.02 | 0.02 |
| C14 | Unspecified pharynx | 12 | 0.19 | 0.70 | 0.61 | 0.44 | 0.05 | 0.04 |
| C15 | Oesophagus | 44 | 0.69 | 2.56 | 1.70 | 1.14 | 0.10 | 0.07 |
| C16 | Stomach | 267 | 4.19 | 15.55 | 9.34 | 6.19 | 0.70 | 0.27 |
| C17 | Intestine | 9 | 0.14 | 0.52 | 0.33 | 0.22 | 0.03 | 0.01 |
| C18 | Colon | 585 | 9.19 | 34.07 | 21.89 | 14.71 | 1.67 | 0.79 |
| C19-C20 | Rectum | 263 | 4.13 | 15.32 | 10.35 | 6.98 | 0.82 | 0.40 |
| C21 | Anus | 15 | 0.24 | 0.87 | 0.61 | 0.41 | 0.04 | 0.02 |
| C22 | Liver | 111 | 1.74 | 6.47 | 3.72 | 2.43 | 0.29 | 0.08 |
| C23-C24 | Gall bladder and bile duct | 124 | 1.95 | 7.22 | 4.33 | 2.83 | 0.32 | 0.13 |
| C25 | Pancreas | 207 | 3.25 | 12.06 | 7.33 | 4.82 | 0.55 | 0.23 |
| C30-C31 | Nose, sinuses and ear | 9 | 0.14 | 0.52 | 0.46 | 0.42 | 0.03 | 0.03 |
| C32 | Larynx | 19 | 0.30 | 1.11 | 0.91 | 0.70 | 0.08 | 0.05 |
| C33-C34 | Trachea, bronchus and lung | 232 | 3.64 | 13.51 | 9.95 | 7.15 | 0.77 | 0.47 |
| C37-C38 | Other thoracic organs | 8 | 0.13 | 0.47 | 0.42 | 0.39 | 0.03 | 0.02 |
| C40-C41 | Bone | 15 | 0.24 | 0.87 | 0.77 | 0.67 | 0.05 | 0.05 |
| C43 | Skin melanoma | 209 | 3.28 | 12.17 | 10.06 | 7.90 | 0.79 | 0.60 |
| C45 | Mesothelioma | 9 | 0.14 | 0.52 | 0.41 | 0.31 | 0.04 | 0.02 |
| C46 | Kaposi sarcoma | 5 | 0.08 | 0.29 | 0.15 | 0.09 | 0.01 | 0.00 |
| C47+C49 | Connective and soft tissues | 43 | 0.68 | 2.51 | 2.19 | 2.01 | 0.17 | 0.12 |
| C50 | Breast | 1,778 | 27.92 | 103.56 | 84.81 | 62.91 | 6.75 | 5.05 |
| C51 | Vulva | 53 | 0.83 | 3.09 | 1.79 | 1.16 | 0.10 | 0.06 |
| C52 | Vagina | 8 | 0.13 | 0.47 | 0.41 | 0.33 | 0.03 | 0.02 |
| C53 | Cervix uteri | 120 | 1.88 | 6.99 | 5.92 | 4.54 | 0.49 | 0.34 |
| C54 | Corpus uteri | 410 | 6.44 | 23.88 | 18.32 | 12.95 | 1.60 | 0.93 |
| C55 | Uterus unspecified | 20 | 0.31 | 1.17 | 0.77 | 0.52 | 0.04 | 0.04 |
| C56 | Ovary | 232 | 3.64 | 13.51 | 10.87 | 8.28 | 0.88 | 0.62 |
| C57 | Other female genital organs | 9 | 0.14 | 0.52 | 0.40 | 0.28 | 0.03 | 0.02 |
| C64 | Kidney | 136 | 2.14 | 7.92 | 5.67 | 4.17 | 0.44 | 0.23 |
| C65 | Renal pelvis | 5 | 0.08 | 0.29 | 0.17 | 0.11 | 0.02 | 0.00 |
| C66 | Ureter | 3 | 0.05 | 0.18 | 0.15 | 0.12 | 0.02 | 0.01 |
| C67 | Bladder | 157 | 2.47 | 9.14 | 5.65 | 3.81 | 0.42 | 0.19 |
| C69 | Eye | 12 | 0.19 | 0.70 | 0.58 | 0.50 | 0.04 | 0.03 |
| C70-C72 | Brain, nervous system | 167 | 2.62 | 9.73 | 7.04 | 5.30 | 0.52 | 0.34 |
| C73 | Thyroids | 127 | 1.99 | 7.40 | 6.54 | 5.41 | 0.53 | 0.42 |
| C74 | Adrenal gland | 12 | 0.19 | 0.70 | 0.67 | 0.62 | 0.04 | 0.04 |
| C81 | Hodgkin lymphoma | 44 | 0.69 | 2.56 | 2.46 | 2.44 | 0.00 | 0.00 |
| C82-85, C96 | Non-Hodgkin lymphoma | 260 | 4.08 | 15.14 | 10.90 | 8.16 | 0.19 | 0.17 |
| C88 | Immunoproliferative disease | 1 | 0.02 | 0.06 | 0.02 | 0.01 | 0.87 | 0.50 |
| C90 | Multiple myeloma | 84 | 1.32 | 4.89 | 3.11 | 2.07 | 0.26 | 0.10 |
| C91 | Lymphoid leukemia | 54 | 0.85 | 3.15 | 2.45 | 2.10 | 0.21 | 0.11 |
| C92-C94 | Myeloid leukemia | 23 | 0.36 | 1.34 | 1.03 | 0.85 | 0.08 | 0.05 |
| C95 | Unspecified leukemia | 57 | 0.89 | 3.32 | 2.33 | 1.82 | 0.16 | 0.10 |
| O&U | Other land poorly defined | 299 | 4.69 | 17.42 | 9.73 | 6.24 | 0.59 | 0.26 |
| C00-O&U | All sites | 6,369 | 100.00 | 370.96 | 272.16 | 198.14 | 21.27 | 13.26 |
ASR(E): age-standardized rates (European population); ASR(W): age-standardized rates (world population).
In general, neoplasms were more frequent in men than in women for all sites except thyroids and skin melanomas. The age-standardized rate ratio between men and women for all sites was 2.7, and the sites with the highest rate ratios were the larynx (19.1), oesophagus (7.2), tracheal-bronchial-lung (7.2), urinary bladder (6.9) and lip-oral cavity and pharynx (4.9).
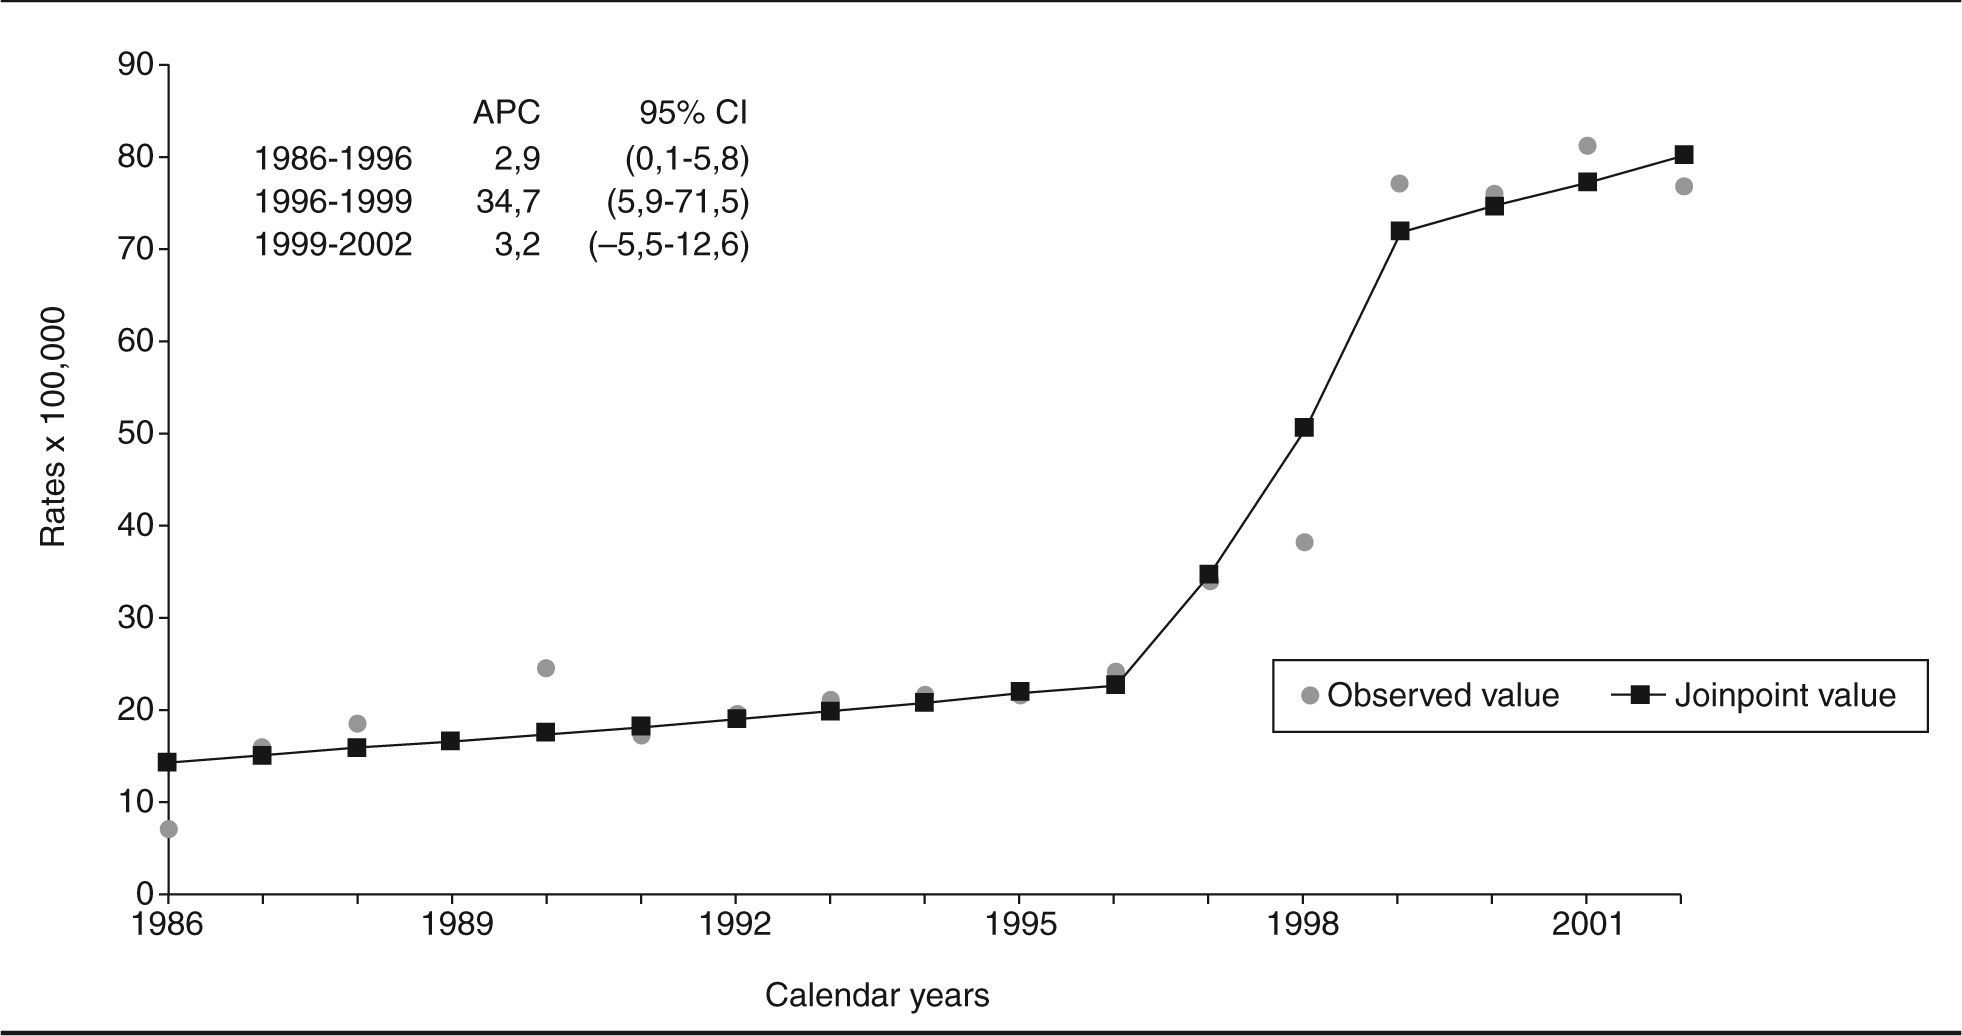
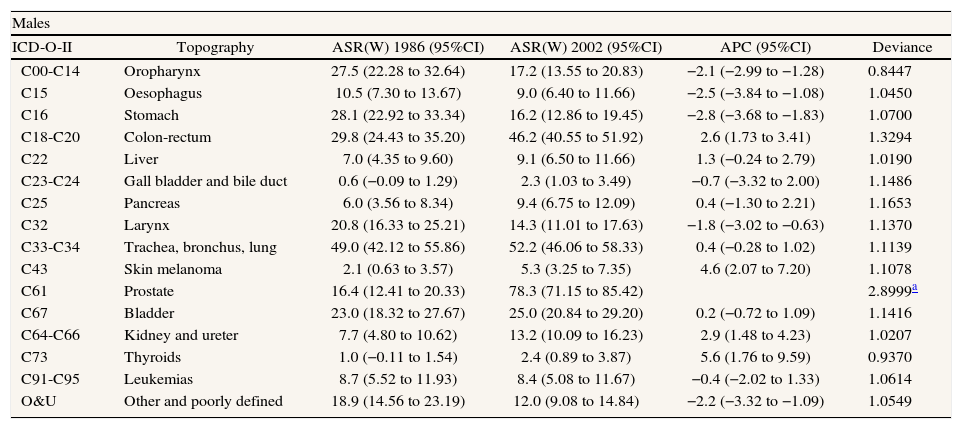
Between the years 1986 and 2002, the incidence of cancer in Gipuzkoa underwent an annual increase of 1.46% (95% confidence interval CI, 1.14-1.77) in men and 0.91% (95% CI, 0.53-1.30) in women. Trends for the most frequent sites are shown in table 3. In men, the tumour site with the greatest increase during the study period was the prostate. This increase was not linear. It is possible to distinguish 3 well-differentiated periods: 1986-1996, with an APC of 2.9% (95% CI, 0.15.8); 1996-1999, with an annual increase of 34.7% (95% CI, 5.9-71.5); and 1999-2002, in which no significant changes were observed (fig. 2). After prostate cancer, the tumours with the greatest APC in men were: thyroid (5.6%), skin melanoma (4.6%), kidney (2.8%) and colon-rectum (2.6%) cancer. Significant decreases were observed in stomach (2.8%), oesophagus (2.5%) and lip-oral cavity-pharynx (2.1%) cancer. No significant changes were observed in the incidence of tracheal-bronchial-lung and bladder urinary tumours. In women, the greatest annual increase occurred in tracheal-bronchial-lung tumours (5.2%), followed by skin melanoma (4.6%) and thyroid (4.0%) cancer. Significant decreases were observed in stomach tumours (4.4%) and in gallbladder and bile duct tumours (2.3%). No significant changes were observed in tumours of the cervix, ovary and urinary bladder.
Cancer incidence in Gipuzkoa (1986-2002): rates (per 100,000) and time trends (Poisson regression)
| Males | |||||
| ICD-O-II | Topography | ASR(W) 1986 (95%CI) | ASR(W) 2002 (95%CI) | APC (95%CI) | Deviance |
| C00-C14 | Oropharynx | 27.5 (22.28 to 32.64) | 17.2 (13.55 to 20.83) | −2.1 (−2.99 to −1.28) | 0.8447 |
| C15 | Oesophagus | 10.5 (7.30 to 13.67) | 9.0 (6.40 to 11.66) | −2.5 (−3.84 to −1.08) | 1.0450 |
| C16 | Stomach | 28.1 (22.92 to 33.34) | 16.2 (12.86 to 19.45) | −2.8 (−3.68 to −1.83) | 1.0700 |
| C18-C20 | Colon-rectum | 29.8 (24.43 to 35.20) | 46.2 (40.55 to 51.92) | 2.6 (1.73 to 3.41) | 1.3294 |
| C22 | Liver | 7.0 (4.35 to 9.60) | 9.1 (6.50 to 11.66) | 1.3 (−0.24 to 2.79) | 1.0190 |
| C23-C24 | Gall bladder and bile duct | 0.6 (−0.09 to 1.29) | 2.3 (1.03 to 3.49) | −0.7 (−3.32 to 2.00) | 1.1486 |
| C25 | Pancreas | 6.0 (3.56 to 8.34) | 9.4 (6.75 to 12.09) | 0.4 (−1.30 to 2.21) | 1.1653 |
| C32 | Larynx | 20.8 (16.33 to 25.21) | 14.3 (11.01 to 17.63) | −1.8 (−3.02 to −0.63) | 1.1370 |
| C33-C34 | Trachea, bronchus, lung | 49.0 (42.12 to 55.86) | 52.2 (46.06 to 58.33) | 0.4 (−0.28 to 1.02) | 1.1139 |
| C43 | Skin melanoma | 2.1 (0.63 to 3.57) | 5.3 (3.25 to 7.35) | 4.6 (2.07 to 7.20) | 1.1078 |
| C61 | Prostate | 16.4 (12.41 to 20.33) | 78.3 (71.15 to 85.42) | 2.8999a | |
| C67 | Bladder | 23.0 (18.32 to 27.67) | 25.0 (20.84 to 29.20) | 0.2 (−0.72 to 1.09) | 1.1416 |
| C64-C66 | Kidney and ureter | 7.7 (4.80 to 10.62) | 13.2 (10.09 to 16.23) | 2.9 (1.48 to 4.23) | 1.0207 |
| C73 | Thyroids | 1.0 (−0.11 to 1.54) | 2.4 (0.89 to 3.87) | 5.6 (1.76 to 9.59) | 0.9370 |
| C91-C95 | Leukemias | 8.7 (5.52 to 11.93) | 8.4 (5.08 to 11.67) | −0.4 (−2.02 to 1.33) | 1.0614 |
| O&U | Other and poorly defined | 18.9 (14.56 to 23.19) | 12.0 (9.08 to 14.84) | −2.2 (−3.32 to −1.09) | 1.0549 |
| Females | |||||
| ICD-O-II | Topography | ASR(w) 1986 (95%CI) | ASR(w) 2002 (95%CI) | ASR(w) (95%CI) | Deviance |
| C00-C14 | Oropharynx | 2.4 (1.07 to 3.84) | 3.6 (1.61 to 5.65) | 2.5 (0.13 to 4.93) | 1.0525 |
| C15 | Oesophagus | 0.6 (−0.03 to 1.32) | 1.4 (0.39 to 2.45) | 3.5 (−0.64 to 7.76) | 0.9194 |
| C16 | Stomach | 10.4 (7.67 to 13.23) | 6.0 (4 to 8.04) | −4.4 (−5.67 to −3.10) | 1.0881 |
| C18-C20 | Colon-rectum | 14.7 (11.46 to 17.83) | 20.4 (16.83 to 23.93) | 1.5 (0.64 to 2.37) | 1.0187 |
| C22 | Liver | 1.8 (0.65 to 3.03) | 3.0 (1.56 to 4.48) | 3.2 (0.89 to 5.57) | 0.8463 |
| C23-C24 | Gall bladder and bile duct | 4.8 (2.99 to 6.62) | 1.98 (1.01 to 2.94) | 2.3 (−4.09 to −0.38) | 0.9046 |
| C25 | Pancreas | 3.1 (1.81 to 4.39) | 4.8 (3.12 to 6.47) | 1.0 (−0.72 to 2.81) | 1.0568 |
| C33-C34 | Trachea, bronchus, lung | 4.0 (2.24 to 5.79) | 7.9 (5.47 to 10.25) | 5.2 (3.36 to 7.05) | 0.9540 |
| C43 | Skin melanoma | 3.1 (1.49 to 4.81) | 7.5 (4.81 to 10.19) | 4.6 (2.59 to 6.67) | 1.1709 |
| C50 | Breast | 44.8 (38.39 to 51.13) | 57.5 (50.84 to 64.06) | 1.5 (0.79 to 2.24) | 1.5815 |
| C53 | Cervix | 3.1 (1.47 to 4.78) | 3.6 (1.97 to 5.24) | −0.5 (−2.60 to 1.60) | 1.0527 |
| C54 | Uterine corpus | 9.7 (6.90 to 12.54) | 12.1 (9.17 to 15.09) | 2.8 (1.54 to 4.01) | 0.9829 |
| C56 | Ovary | 9.1 (6.22 to 11.97) | 7.2 (4.49 to 9.88) | −1.0 (−2.49 to 0.45) | 1.0459 |
| C67 | Bladder | 2.5 (1.23 to 3.84) | 3.4 (2.06 to 4.81) | −0.5 (−1.44 to 2.45) | 0.9718 |
| C64-C66 | Kidney and ureter | 1.9 (0.68 to 3.20) | 4.5 (2.29 to 6.73) | 1.6 (−0.13 to 3.44) | 0.7795 |
| C73 | Thyroids | 2.2 (0.76 to 3.73) | 8.0 (5.24 to 10.69) | 4.0 (1.67 to 6.46) | 1.1146 |
| C91-C95 | Leukemias | 3.4 (1.32 to 5.50) | 5.0 (2.20 to 7.72) | 0.2 (−1.89 to 2.23) | 1.1206 |
| O&U | Other and poorly defined | 14.2 (11.09 to 17.30) | 4.7 (3.10 to 6.39) | −3.9 (−5.25 to −2.60) | 1.1325 |
ASR(W): age-standardized rates (world population); APC: annual percentage change; CI: confidence interval.

The quality indicators used showed a high degree of exhaustiveness and highlighted the good quality of the data compiled. Over the whole period, there were only 5 cases in which the age and date of birth were unknown at the moment of diagnosis, and none in the last five-year period. The percentage of cases with histological verification was almost 90% for the last five-year period, while during the same period the proportion of cases with unknown or poorly defined primary sites was less than 5%, with an annual decrease of 2.2% in men and 3.9% in women over the study period (table 3). Finally, cases in which the only source of data was the death certifícate (DCO) accounted for less than 2.5% of the total in the last few years.
DiscussionThe average annual frequency of appearance of new cases of cancer in Gipuzkoa between 1998 and 2002 was 607/100,000 for men and 371/100,000 for women, with a standardized man/woman rate ratio of 2.7 and an average age at diagnosis of 66 years for men and 64 for women.
Data published from the Spanish cancer registries16-18 shows a north-south gradient in men, with higher incidence rates in the north of Spain, in contrast to women with similar rates in Navarra, the Basque Country and Tarragona, and somewhat lower rates in Granada and Zaragoza19. In periods prior to 1998, incidence rates for cancer in women resident in Gipuzkoa, as for those for women from other regions of Spain, were amongst the lowest in Europe, while those for men were similar to the European average.
The pattern of cancer in men from Gipuzkoa for the last 5-year period studied shows a high incidence of tobacco and alcohol related tumours (lip, oral cavity, pharynx, larynx, oesophagus and lung). Similar rates were observed in previous periods for this region and also for the whole of Spain20. Lung cancer, which was the most frequent neoplasm in males in previous periods, descended to second place, mainly due to the significant increase in prostate tumours. In women, incidence data for the five-year period 1998-2002 show a similar pattern to those of previous periods, with a gradual increase in the rates of the most frequent tumours: breast and colon-rectum tumours, and also in cancers of the uterus. Malignant breast cancers represented 28% of all cancers (excluding non-melanoma skin cancer) and followed the same upward trend observed in other regions of Spain and countries worldwide21-23.
In general, a progressive increase in the number of cancer cases was observed during the study period in both men and women. The overall annual increases in the incidence of cancer were 1.5% in men and 0.9% in women. This overall increase in the detection of tumours corresponds to general trends for the most frequent tumours in both men and women. The exceptions to the rule were stomach tumours, which decreased in both sexes, and tumours of the oral cavity and pharynx and oesophagus, which decreased in men.
In men, the great increase observed in prostate cancer, with an annual increase of 2.9% in the period 1986-1996, and a very sharp annual increase (34.7%) between 1996 and 1999, reflects the increase in diagnosis related to the widespread use of the PSA test. Registered cases of prostate cancer have been on the increase in France since 1985 and in Spain since 199024. Nevertheless, in the data presented here, the observed increase was 100% in 3 years, while increases in detection associated with the use of PSA in other countries, in earlier periods, were more gradual25,26. On the other hand, the incidence of lung cancer stabilized, but the decrease described in some other European countries and in the USA was not observed27,28. In some European countries, the incidence of lung cancer in men has decreased since the 1980's, while in southern Europe it continued to increase until the 1990's, with a pattern reflecting the epidemic of tobacco smoking affecting certain regions29. The number of male smokers in some northern European countries began to descend in the 1960's. Nevertheless, in some southern European countries, including Spain, this decrease in male tobacco consumption did not begin until the 1980's30.
In women, although the increases in breast and colon-rectum cancers were greater, in absolute numbers, than those observed for other tumours, the greatest percentage increases were observed for tumours such us lung cancer (5.2% annually). Although the incidence rates of these tumours are still much lower than for men, they are now increasing, as previously occurred in other western nations25,27,31. Tobacco consumption by Spanish women increased rapidly from 1970 onwards and continued to increase until the 1990's31. This implied a lag of 20-40 years compared to the experience of women in other western countries and this will also be reflected in the evolution of the incidence of tobacco-related cancers32.
The incidence of melanoma in Gipuzkoa showed an annual increase of 4.6% in both men and women. The incidence of these tumours in Europe has been rising steadily, albeit with differences between countries33-35, though a deceleration in the general trend has been observed in northern Europe36. This general increase has been associated with exposure to ultraviolet radiation in combination with endogenous factors such as skin type and genetic predisposition37. Finally, the increase in the incidence of thyroid cancer, particularly in women (4%), has also been described by other authors, as has a decline in mortality rates38,39. This indicates that the observed increase may be due to improved diagnosis and to the identification of a greater number of small, well-differentiated, tumours. Exposure to radiation and other substances that affect the thyroid function are amongst the etiological factors40, thus this type of tumour showed a greater incidence in areas of endemic goitre.
For the last period studied, the quality indicators of the cancer register support both the validity and the exhaustiveness of the cancer registry, confirming the quality of the data presented. In addition, the decrease observed in the number of tumours with poorly defined sites was clearly related to improvements in the quality of diagnostic data. An age-period-cohort analysis for specific sites would provide more detailed data about factors that could possibly explain the increase in the incidence of cancer. In Spain, pronounced cohort effects have been described for lung41 and breast21 cancer, amongst others, indicating respective changes in the prevalence of risk factors such as tobacco and reproductive aspects, in specific birth-defined cohorts. In the case of prostate cancer, the period considered and the generalized use of PSA seems to have had a greater effect on the changes observed, which affected all age groups. Even so, significant cohort effects have also been described suggesting the influence of etiological factors42.
In conclusion, the study data reflect an important rise in the incidence of neoplasms in Gipuzkoa in most sites, and most notably in those associated with preventable risk factors, as is the case of lung tumours in women and skin melanoma in both sexes.
We would like to thank the people responsible for and workers of the departments who supplied the data to the cancer registry. In particular, we would like to thank the people responsible for actively gathering, codifying and registering the data in the 3 registries: Mercedes Laviñeta, Conchi Mugarza, M. Carmen San Sebastián and Marian Ugarte. Lastly, thanks go to Mikel Basterretxea for his comments during the editing of the present manuscript.


