


To analyze whether Emergency Aid Program (EAP) availability and COVID-19 vaccination were associated to changes in hospitalizations and mortality due to COVID-19 in Brazil.
MethodThis was a longitudinal ecological study with 5570 Brazilian municipalities as analysis units. Data from March 2020 to December 2021 were analysed. As control covariates, we considered socioeconomic, sociodemographic and morbidity characteristics and health services access, including COVID-19 testing availability and vaccination. Bayesian hierarchical models were adjusted with spatial and temporal effects.
ResultsEAP coverage (RR: 0.986; 95%CI: 0.984-0.988) and COVID-19 vaccine first dose coverage (RR: 0.982; 95%CI: 0.979-0.985) exhibited a negative association with the relative risk of COVID-19 hospitalization in Brazil. EAP coverage (RR: 0.975; 95%CI: 0.973-0.977), first-dose COVID-19 vaccine coverage (RR: 0.983; 95%CI: 0.981-0.985), and coverage of regular vaccination in children under 5 years old (RR: 0.996; 95%CI: 0.994-0.996) exhibited a negative association with COVID-19 mortality.
ConclusionsThe results highlight the important role of income transfer in COVID-19 morbidity and mortality, as well as the complementary effects and relevance of strengthening social protection policies and vaccination efforts in reducing severe cases in a pandemic scenario.
Analizar si la disponibilidad del Programa de Auxilio de Emergencia (PAE) y la vacunación contra la COVID-19 se asociaron con una reducción de la morbilidad y la mortalidad por COVID-19.
MétodoEstudio ecológico longitudinal, con 5570 municipios brasileños como unidades de análisis. Se analizaron datos correspondientes al periodo de marzo de 2020 a diciembre de 2021. Como covariables de control se consideraron las características socioeconómicas, sociodemográficas y de morbilidad, así como el acceso a servicios de salud, incluyendo la disponibilidad de pruebas diagnósticas para COVID-19 y la vacunación. Se ajustaron modelos jerárquicos bayesianos con efectos espaciales y temporales.
ResultadosLa cobertura del PAE (RR: 0,986; IC95%: 0,984-0,988) y la cobertura de la primera dosis de la vacuna contra la COVID-19 (RR: 0,982; IC95%: 0,979-0,985) mostraron una asociación negativa con el riesgo relativo de hospitalización por COVID-19 en Brasil. La cobertura del PAE (RR: 0,975; IC95%: 0,973-0,977), la cobertura de la primera dosis de la vacuna contra la COVID-19 (RR: 0,983; IC95%: 0,981-0,985) y la cobertura de la vacunación sistemática en niños menores de 5 años (RR: 0,996; IC95%: 0,994-0,996) se asociaron negativamente con la mortalidad por COVID-19.
ConclusionesLos resultados destacan el papel relevante de la transferencia de ingresos en la morbilidad y la mortalidad por COVID-19, así como los efectos complementarios y la importancia de fortalecer las políticas de protección social y los esfuerzos de vacunación para reducir los casos graves en un escenario pandémico.
Five years after its emergence, COVID-19 became endemic, like other respiratory viruses. In Brazil, it marked impact, reflected in high morbidity and mortality, highlighting structural, economic, and social vulnerabilities and inequalities.
Brazil adopted mobility restrictions, mask use, isolation of suspected or confirmed cases, and suspension of non-essential activities in a disorganized manner,1 becoming one of the global leaders in cases and deaths.
In March 2020, the Federal Government implemented the Emergency Aid Program (EAP) to support vulnerable populations. However, irregular payments and fluctuating amounts hindered financial planning.2 Moreover, the central government failed to leverage features of existing social protection programs, the Bolsa Família Program (BFP) and the Continuous Benefit Program,2, namely, the use of cash transfers to promote preventive behaviors and the provision of regular, predictable benefits.
Benefits granted in 2020–2021 varied in duration, value, coverage, and the regulatory mechanisms employed. In 2020, the EAP ran from April to December, with reductions in value and coverage starting in September. Peak coverage reached 64 million people, who received BRL 600 for the first five months; single mothers received double. In 2021, the EAP was paid from April to October, reaching a maximum of 39 million beneficiaries, who received BRL 150, BRL 250, or BRL 375 according to family characteristics, again with double payments for single mothers.2
During the EAP period, the BFP was paid only to individuals ineligible for the EAP or entitled to a lower benefit. From April 2020 onward, the BFP payroll decreased sharply, as 86%–95% of its beneficiaries shifted to EAP payments.2,3
Failure to use the BFP registration system led to major distribution errors. The Federal Court of Accounts estimated that 7.3 million people were improperly benefited, and 6.4 million women falsely declared themselves single mothers.4 These inclusion errors resulted in excess spending of BRL 54 billion, nearly one-sixth of total expenditures that year.4 The EAP ended in October 2021, coinciding with the implementation of the Auxílio Brasil Program, which replaced the BFP.
Despite inconsistencies, the EAP increased transfer amounts and expanded coverage. In 2020, spending of BRL 303.4 billion generated positive economic effects. Sanches et al.5 estimated that these transfers acted as a fiscal multiplier, mitigating the economic downturn. Without this investment, the 4.1% GDP decline in 2020 would have been substantially larger, ranging from 8.4% to 14.8% compared with 2019.5
Brazil began COVID-19 vaccination in January 2021, prioritizing biologically and socially vulnerable groups and expanding coverage as supply increased.6 Despite early delays, the country benefited from its strong National Immunization Program), with broad reach and experience in mass campaigns. Nonetheless, structural inequalities, political disputes, logistical barriers, and misinformation produced marked heterogeneity in vaccine uptake. Studies show lower coverage associated with income, education, race, housing conditions, and urban density, indicating delayed access among populations already more exposed and vulnerable to COVID-19.6–9
Given this context, it is important to assess how vaccination and income transfer programs interacted with disease spread. Specifically, evaluating whether large-scale financial support to vulnerable populations reduced disease burden, particularly alongside expanding vaccine coverage, may inform future social protection and public health strategies. This longitudinal ecological study analyzed whether the availability of the EAP and COVID-19 vaccination was associated with COVID-19 morbidity and mortality in Brazilian municipalities, controlling for relevant covariates, including demographic, health, socioeconomic, health service availability, and testing factors.
MethodStudy designWe performed a longitudinal ecological study on COVID-19 hospitalizations and deaths across 5,570 Brazilian municipalities, considering monthly number of cases from March 2020 to December 2021, totaling 122,540 observations. To control municipality population age structure effect, outcome variables were directly standardized by sex and five-year age groups, using the Brazilian demographic structure as reference. Rates were reported per 100,000 inhabitants.
Study variablesThe theoretical model considered how socioeconomic determinants, sociodemographic factors, access to health services and individual characteristics were associated with COVID-19 morbimortality. Specifically, we examined the association between EAP availability and COVID-19 vaccination with the outcome variables: hospitalizations and deaths due to COVID-19.9
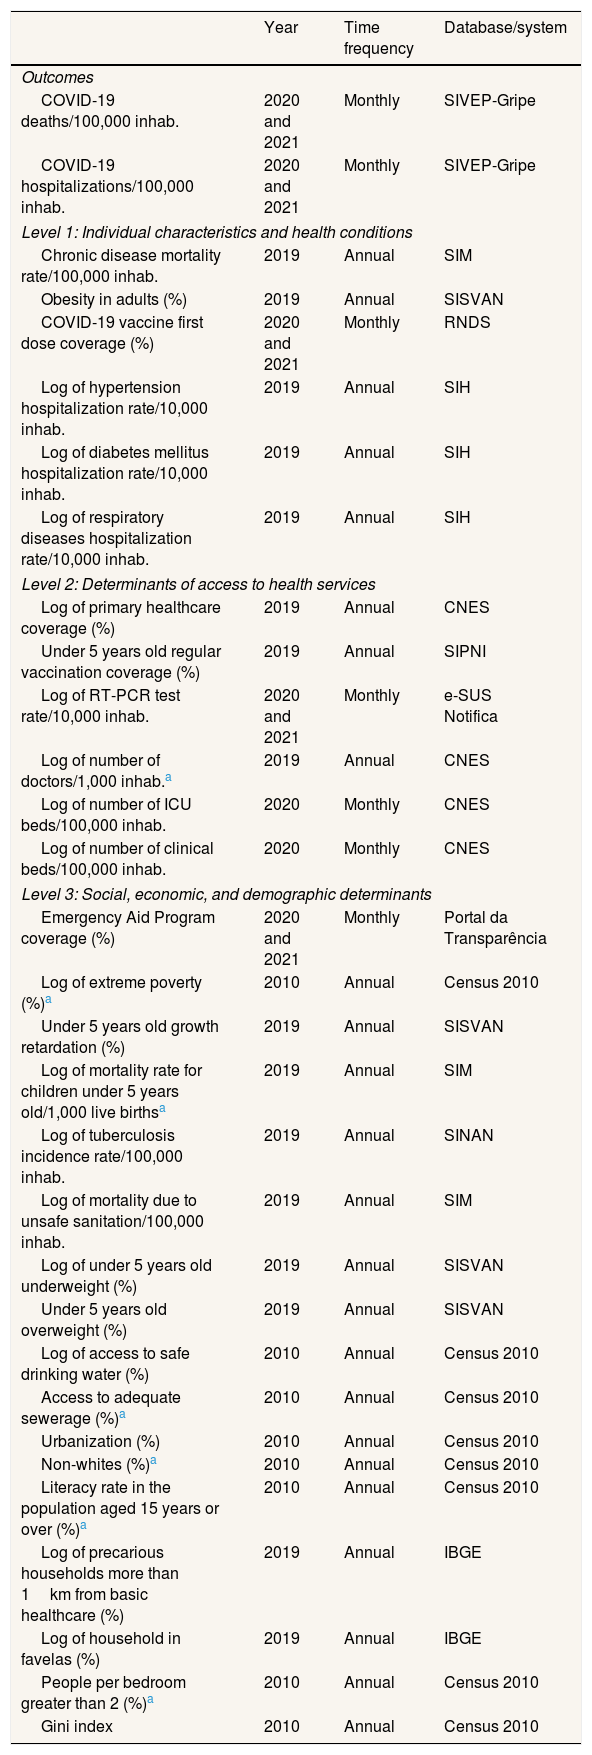
The monthly percentages of EAP and first-dose vaccine coverage were obtained, respectively, from the Portal da Transparência and the National Health Data Network of the Brazilian federal government. Data on the monthly rate of hospitalizations and deaths per 100,000 inhabitants were obtained from the Influenza Epidemiological Surveillance Information System. Additionally, we selected several control variables with basis on previous studies9,10 (Table 1). They were grouped into blocks, where level 1 corresponded to individual characteristics and associated comorbidities; level 2 represented health services access (general and intensive care unit [ICU] beds), COVID-19 testing, vaccination, number of healthcare professionals, and access to primary health care); and Level 3 corresponded to social, economic, and demographic determinants (education, income, sanitation, housing, and nutritional status). All variables were collected from publicly accessible databases in Brazil, and their sources can be verified in Table 1 with further details in Silva et al.9
Description of the control and exposure variables used in the analysis.
| Year | Time frequency | Database/system | |
|---|---|---|---|
| Outcomes | |||
| COVID-19 deaths/100,000 inhab. | 2020 and 2021 | Monthly | SIVEP-Gripe |
| COVID-19 hospitalizations/100,000 inhab. | 2020 and 2021 | Monthly | SIVEP-Gripe |
| Level 1: Individual characteristics and health conditions | |||
| Chronic disease mortality rate/100,000 inhab. | 2019 | Annual | SIM |
| Obesity in adults (%) | 2019 | Annual | SISVAN |
| COVID-19 vaccine first dose coverage (%) | 2020 and 2021 | Monthly | RNDS |
| Log of hypertension hospitalization rate/10,000 inhab. | 2019 | Annual | SIH |
| Log of diabetes mellitus hospitalization rate/10,000 inhab. | 2019 | Annual | SIH |
| Log of respiratory diseases hospitalization rate/10,000 inhab. | 2019 | Annual | SIH |
| Level 2: Determinants of access to health services | |||
| Log of primary healthcare coverage (%) | 2019 | Annual | CNES |
| Under 5 years old regular vaccination coverage (%) | 2019 | Annual | SIPNI |
| Log of RT-PCR test rate/10,000 inhab. | 2020 and 2021 | Monthly | e-SUS Notifica |
| Log of number of doctors/1,000 inhab.a | 2019 | Annual | CNES |
| Log of number of ICU beds/100,000 inhab. | 2020 | Monthly | CNES |
| Log of number of clinical beds/100,000 inhab. | 2020 | Monthly | CNES |
| Level 3: Social, economic, and demographic determinants | |||
| Emergency Aid Program coverage (%) | 2020 and 2021 | Monthly | Portal da Transparência |
| Log of extreme poverty (%)a | 2010 | Annual | Census 2010 |
| Under 5 years old growth retardation (%) | 2019 | Annual | SISVAN |
| Log of mortality rate for children under 5 years old/1,000 live birthsa | 2019 | Annual | SIM |
| Log of tuberculosis incidence rate/100,000 inhab. | 2019 | Annual | SINAN |
| Log of mortality due to unsafe sanitation/100,000 inhab. | 2019 | Annual | SIM |
| Log of under 5 years old underweight (%) | 2019 | Annual | SISVAN |
| Under 5 years old overweight (%) | 2019 | Annual | SISVAN |
| Log of access to safe drinking water (%) | 2010 | Annual | Census 2010 |
| Access to adequate sewerage (%)a | 2010 | Annual | Census 2010 |
| Urbanization (%) | 2010 | Annual | Census 2010 |
| Non-whites (%)a | 2010 | Annual | Census 2010 |
| Literacy rate in the population aged 15 years or over (%)a | 2010 | Annual | Census 2010 |
| Log of precarious households more than 1km from basic healthcare (%) | 2019 | Annual | IBGE |
| Log of household in favelas (%) | 2019 | Annual | IBGE |
| People per bedroom greater than 2 (%)a | 2010 | Annual | Census 2010 |
| Gini index | 2010 | Annual | Census 2010 |
CNES: National Registry of Health Establishments; IBGE: Brazilian Institute of Geography and Statistics; ICU: intensive care unit; RNDS: National Health Data Network; RT-PCR: reverse transcription polymerase chain reaction; SIH: Hospital Information System of Brazilian Unified National Health System (SUS); SIM: Brazil Mortality Information System; SINAN: Notifiable Diseases Information System; SIPNI: National Immunization Program Information System; SISVAN: Food and Nutritional Surveillance System; SIVEP-Gripe: Influenza Epidemiological Surveillance Information System.
As shown in Table 1, the outcome variables and those directly related to the pandemic, such as the reverse transcription polymerase chain reaction (RT-PCR) testing for COVID-19, availability of hospital beds, first-dose COVID-19 vaccination and EAP coverage had monthly measurements. Socioeconomic variables were measured annually, using the most recent data available from the pre-pandemic period, to avoid influence on these measures. Chronic diseases mortality and hospitalization rates were standardized by age group, as was done for the outcomes. Variables with highly skewed distributions underwent a logarithmic transformation.11 This transformation was adopted for variables with variation coefficients higher than those observed for the outcome variables.
Data analysisA Pearson linear correlation analysis was performed to identify highly correlated factors that could introduce multicollinearity effects in the models to be fitted. Among control variables with a high linear correlation (between 1 and 0.50 or –0.50 and –1), we retained the variable with the highest correlation with outcomes, prioritizing the order of levels 1, 2, and 3. All variables that exhibited a higher correlation with mortality also showed a higher correlation with hospitalizations. Variables related to first-dose COVID-19 vaccine coverage and EAP coverage were necessarily retained due to their central role in study's goal.
Statistical significance of variables explaining outcome relative risks was assessed using generalized linear mixed models (GLMM),12,13 based on Poisson, negative binomial, zero-inflated Poisson, and zero-inflated negative binomial distributions. An offset for the expected number of cases was included to account for population size, enabling interpretation as relative risks.12
Given the hierarchical data structure, models included random effects for states and municipalities, capturing state-level containment measures and municipal actions, local characteristics, and access to health services. Time (month) was included as a fixed effect to account for temporal trends. Analyses were performed using the glmmTMB13 package in R (R Core Team, 2021).
For the four classes of GLMM considered, selection of explanatory variables was done by blocks, starting with individual and health determinants (level 1), followed by determinants of access to health services (level 2), and finally, social, economic, and demographic determinants (level 3). In each block, a univariate model was fitted, adopting a significance level of 20%, followed by adjustment of a multivariate model with a 5% significance level. Both in univariate and multivariate analysis, variables selected in the previous block were retained. After including the three blocks, variables regarding COVID-19 vaccination and EAP were added. Multicollinearity in the final model of each class was assessed by evaluating the presence of terms with a generalized variance inflation factor (VIF) greater than 5. Selection among the final models was based on the Akaike Information Criterion (AIC), a well-known metric that assesses data goodness-of-fit, with lower values indicating a better fit.
Residual analysis of selected GLMM indicated the presence of spatial dependence for both outcomes, as previously identified.14 This evaluation was performed through spatial autocorrelation analysis using Moran's I test, adjusted by randomization on the models’ residuals for each month of analysis. Given this finding, spatiotemporal multilevel models adjusted from a Bayesian perspective, which directly accounts for the spatial and temporal heterogeneity of data. The same four classes of distributions considered in the GLMM were explored, with the logarithm of the outcome's mean as a linear function of: 1) fixed effects for time (month) and for explanatory variables selected using the GLMM approach, and the expected number of cases as an offset; 2) Gaussian random effect related to state level; 3) the Besag-York-Molie approach14 was used to model the spatial dependency, which includes an intrinsic conditional auto-regressive component for spatial autocorrelation and an independent Gaussian random effect component for non-spatial heterogeneity; and 4) an independent and identically distributed spatiotemporal interaction (month-municipality) term.15,16 This type of modeling is commonly used for the analysis of longitudinal spatial epidemiological data, as the COVID-19 pandemic.17–19
Inference for the Bayesian hierarchical models was conducted using the integrated nested Laplace approximation20 approach in R software. For each outcome, we reported summaries of the a posteriori distribution of the effect of each explanatory variable and the associated risk ratio (exponential of estimated effect), along with the corresponding 95% credible interval (95%CI). Explanatory variables whose estimated effects showed a posterior distribution approximately symmetrical around zero were removed. The best Bayesian model was chosen based on the lowest value of the deviance information criterion (DIC).21
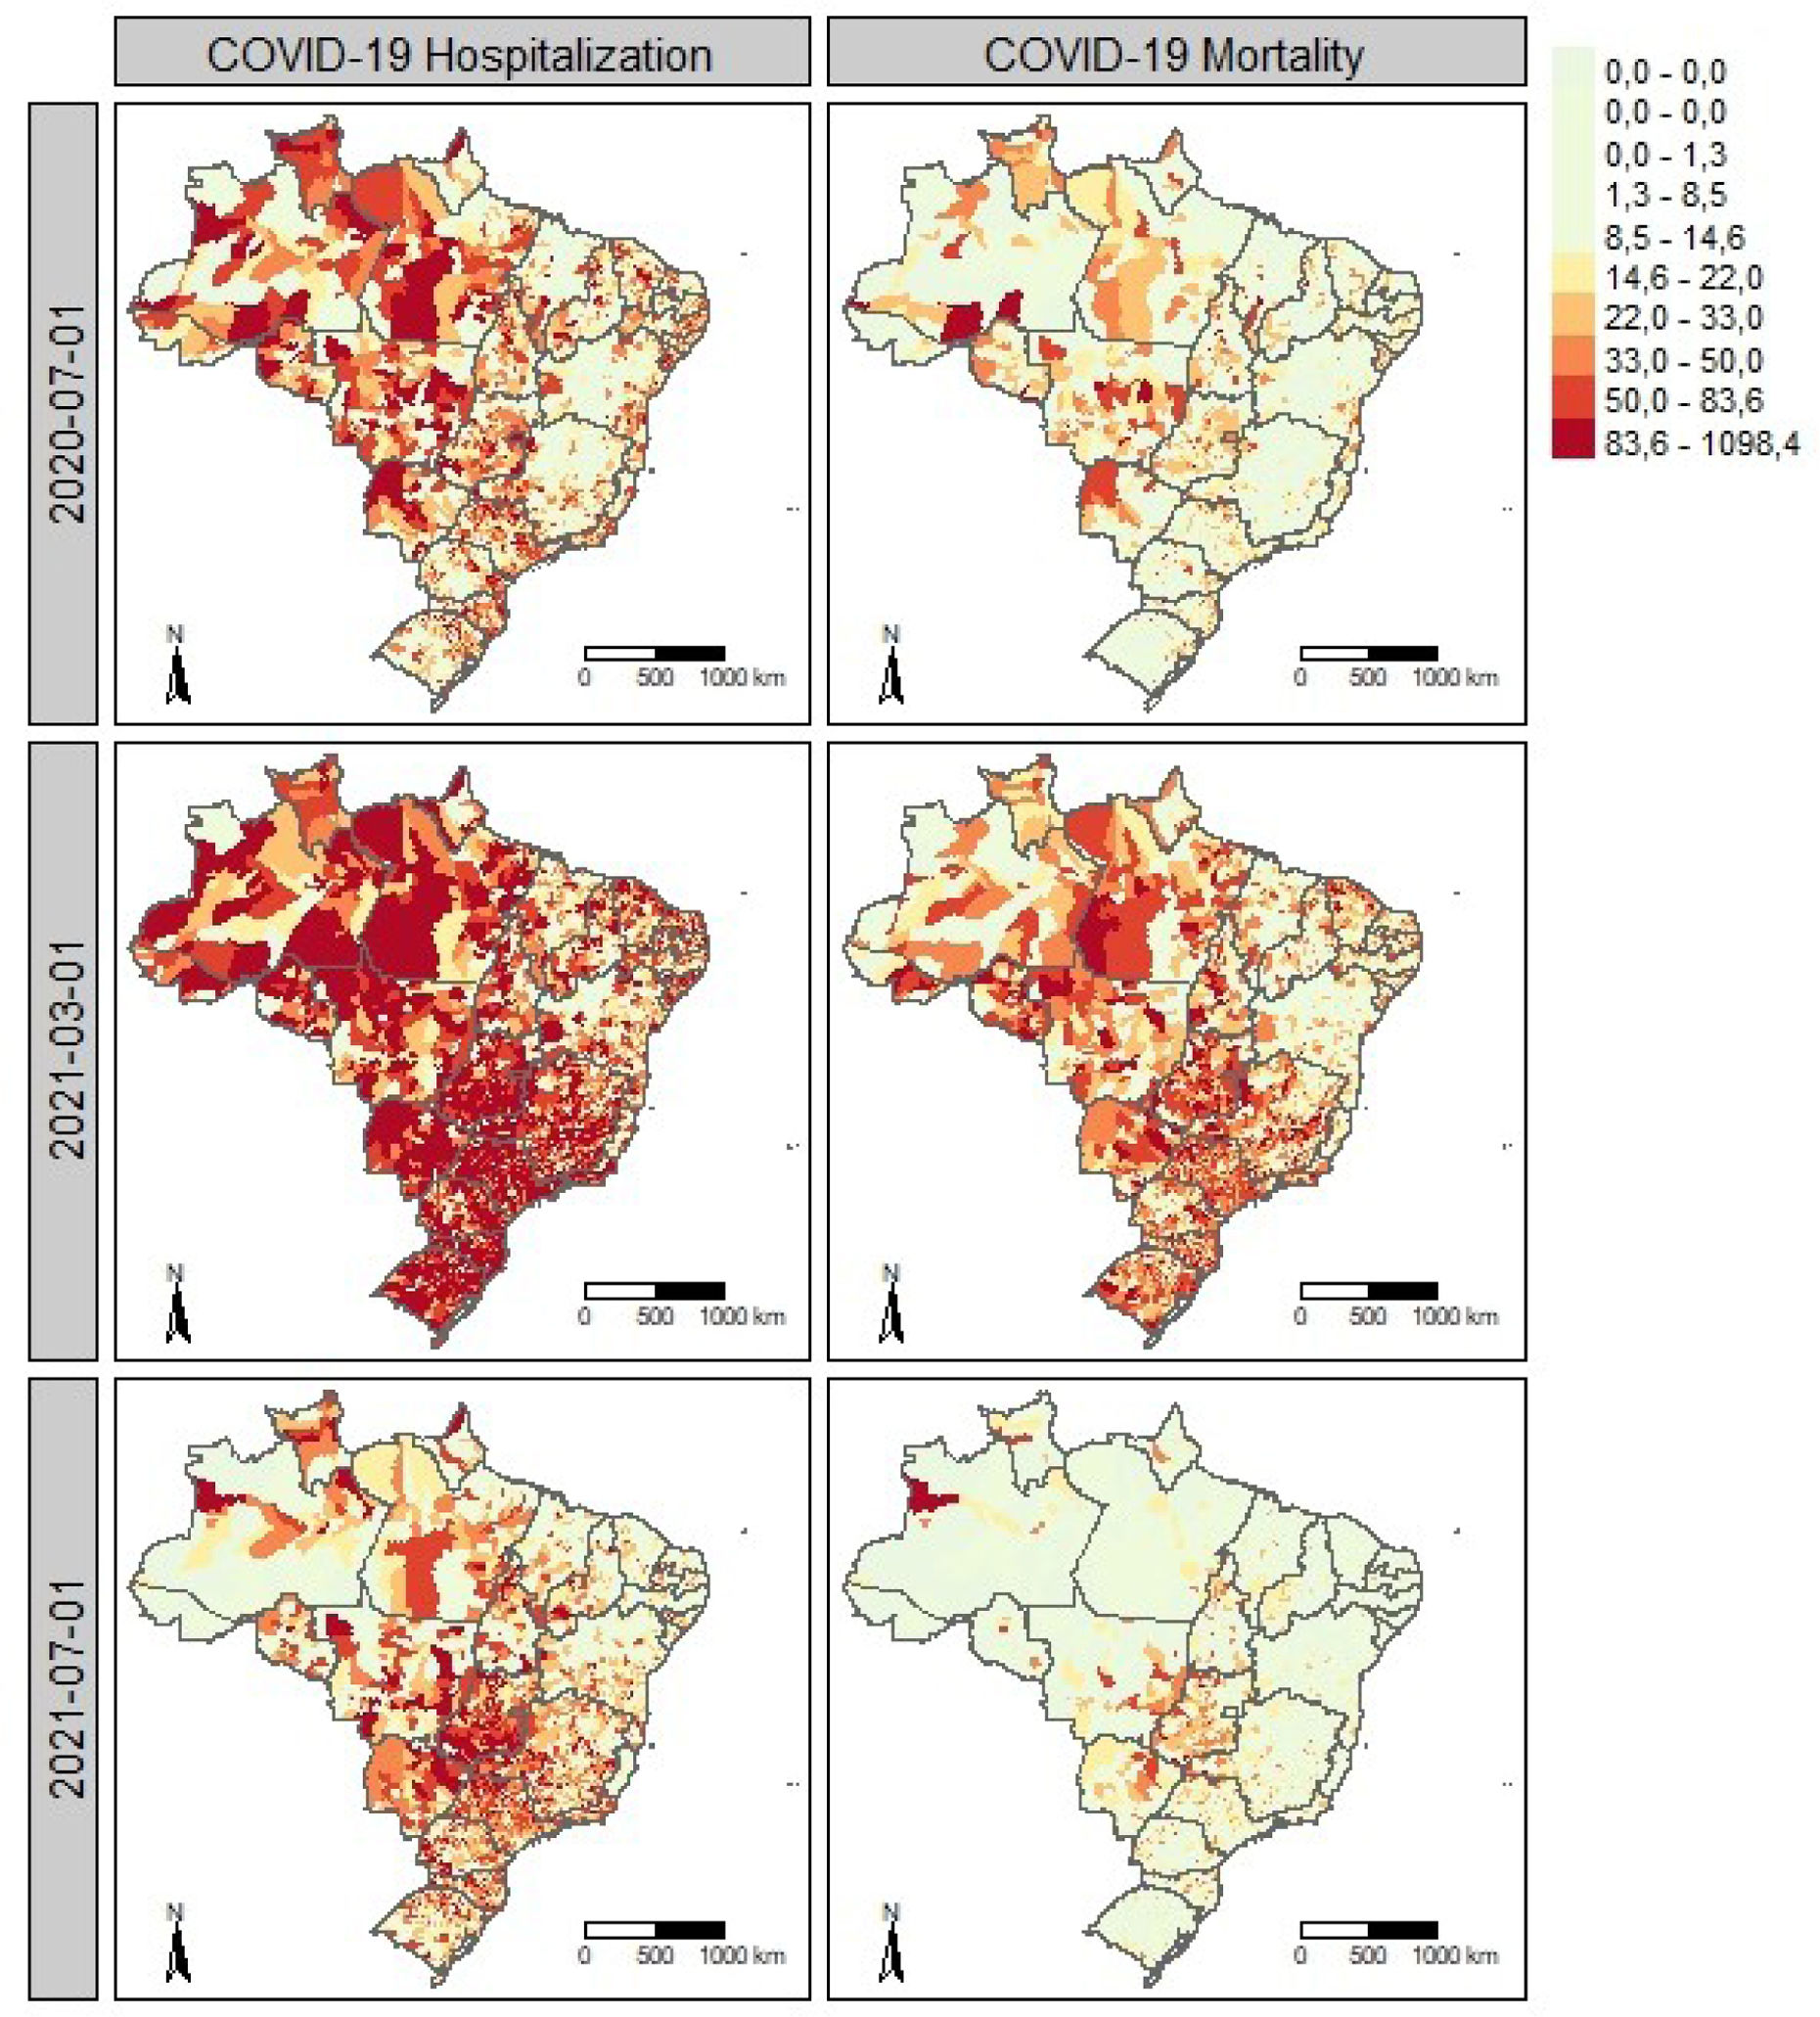
ResultsFigure 1 shows the municipal spatial distribution of hospitalization (left panels) and mortality rates (right panels) per 100,000 inhabitants, standardized by sex and age group, across three periods. Hospitalization maps reveal spatial clustering, with neighboring municipalities showing similar rates. Higher mortality generally coincides with areas of high hospitalization in all periods.

Spatiotemporal patterns of COVID-19 hospitalization and mortality in Brazil. Spatial distribution of COVID-19 hospitalization (left) and mortality (right) rates per 100,000 inhabitants in Brazilian municipalities in July 2020, March 2021, and July 2021. July 2020 marks the first wave with higher rates in western regions, while March 2021 corresponds to the peak of the second wave, with widespread high hospitalization and mortality.
July 2020 (Fig. 1 A) corresponds to the first wave, with the highest numbers of hospitalizations and deaths, particularly in the western regions. In March 2021 (Fig. 1 B), hospitalization and mortality peaked during the second wave, with marked clustering of hospitalization rates exceeding 80 per 100,000 inhabitants in most municipalities, except for lower notifications in parts of the Northeast.
In July 2021 (Fig. 1 C), hospitalization and mortality rates were similar to those in March 2020, but with a different spatial pattern, concentrated mainly in central regions. Overall, the spatial distribution of hospitalization and mortality rates changed markedly over time, in magnitude and clustering, highlighting the relevance of spatiotemporal effects in pandemic analyses. Within municipalities, temporal trends of hospitalizations and deaths followed similar wave patterns (descriptive results not shown).
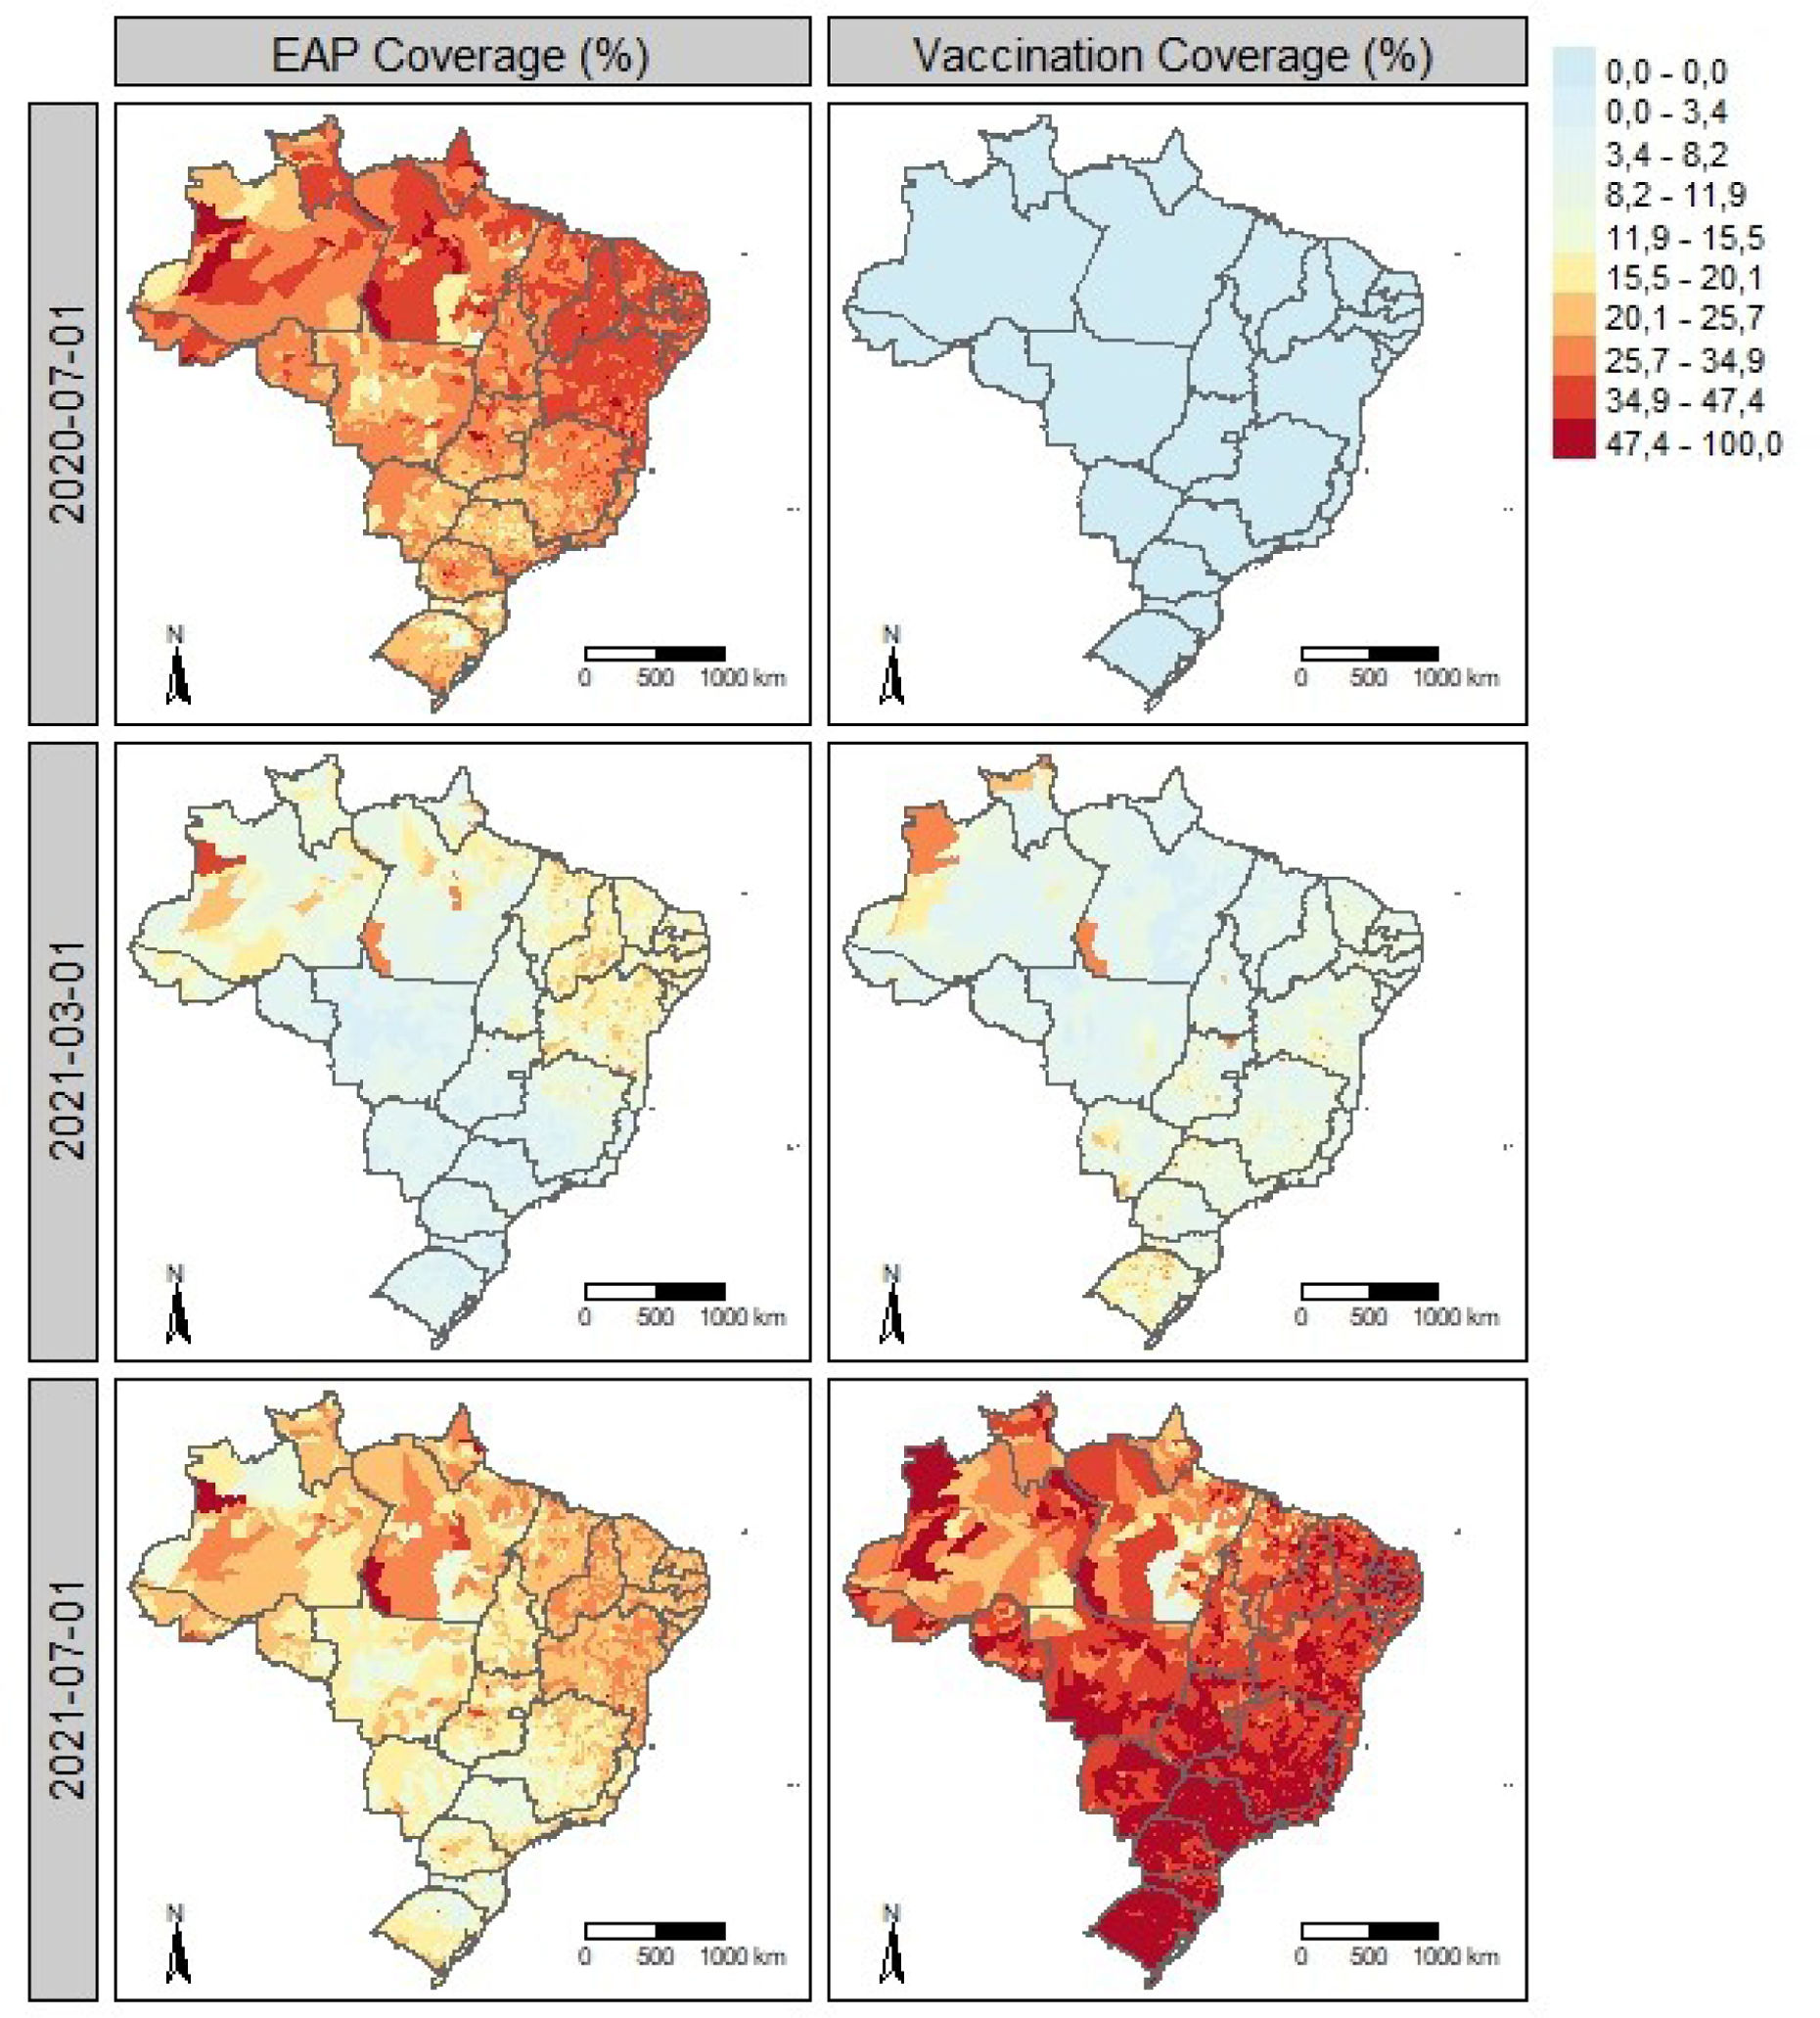
Figure 2 shows the spatial distribution of the EAP (left panels) and first-dose COVID-19 vaccination (right panels) across the same periods. During the first wave (July 2020), EAP coverage exceeded 15% of the population in most municipalities (Fig. 2 A). In March 2021, during peak incidence, coverage declined and was concentrated in the North and Northeast (Fig. 2 B), regions with consistently higher coverage, possibly reflecting prior BFP reach. In July 2021, EAP coverage increased again in the South, Southeast, and Midwest (Fig. 2 C). Vaccination coverage was still limited in March 2021 but expanded substantially nationwide by July 2021 (Fig. 2 C).

After Pearson correlation analysis, one level 2 and six level 3 control variables were excluded from the initial set of 29 (Table 1). Zero-inflated negative binomial GLMM showed the lowest AIC for both outcomes. Significant variables were retained for Bayesian spatiotemporal modeling (12 for hospitalization and 15 for mortality) (Table 1), all with VIF <5. The Zero-inflated negative binomial Bayesian model was selected for both outcomes, as it yielded the lowest DIC.
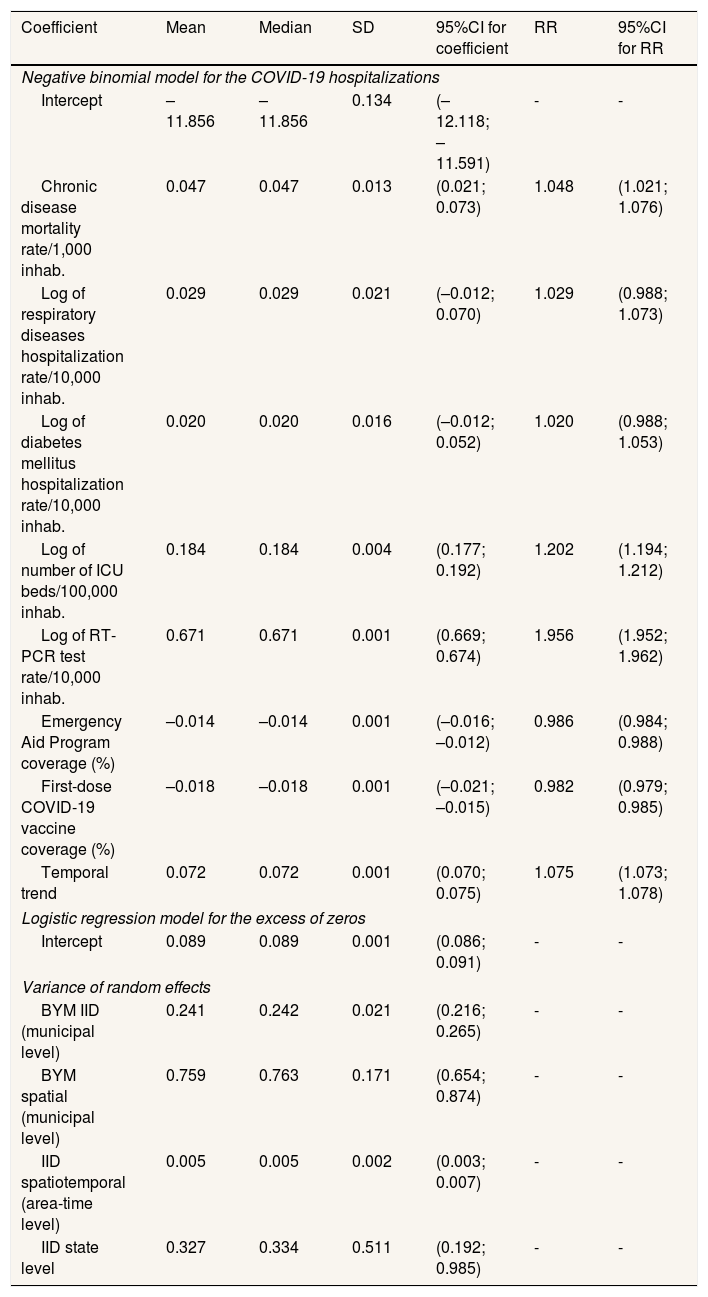
Results of the final Bayesian spatiotemporal model for COVID-19 hospitalizations are shown in Table 2. Chronic disease mortality (risk ratio [RR]: 1.048; 95%CI: 1.021-1.076), number of ICU beds (RR: 1.202; 95%CI: 1.194-1.212), and RT-PCR testing rate (RR: 1.956; 95%CI: 1.952-1.962) were positively associated with hospitalization risk, indicating higher hospitalization volumes in municipalities with greater bed availability and testing capacity, and in populations with higher chronic disease burden.
Results of the Bayesian modela for COVID-19 hospitalization in Brazilian municipalities, March 2020 to December 2021.
| Coefficient | Mean | Median | SD | 95%CI for coefficient | RR | 95%CI for RR |
|---|---|---|---|---|---|---|
| Negative binomial model for the COVID-19 hospitalizations | ||||||
| Intercept | –11.856 | –11.856 | 0.134 | (–12.118; –11.591) | - | - |
| Chronic disease mortality rate/1,000 inhab. | 0.047 | 0.047 | 0.013 | (0.021; 0.073) | 1.048 | (1.021; 1.076) |
| Log of respiratory diseases hospitalization rate/10,000 inhab. | 0.029 | 0.029 | 0.021 | (–0.012; 0.070) | 1.029 | (0.988; 1.073) |
| Log of diabetes mellitus hospitalization rate/10,000 inhab. | 0.020 | 0.020 | 0.016 | (–0.012; 0.052) | 1.020 | (0.988; 1.053) |
| Log of number of ICU beds/100,000 inhab. | 0.184 | 0.184 | 0.004 | (0.177; 0.192) | 1.202 | (1.194; 1.212) |
| Log of RT-PCR test rate/10,000 inhab. | 0.671 | 0.671 | 0.001 | (0.669; 0.674) | 1.956 | (1.952; 1.962) |
| Emergency Aid Program coverage (%) | –0.014 | –0.014 | 0.001 | (–0.016; –0.012) | 0.986 | (0.984; 0.988) |
| First-dose COVID-19 vaccine coverage (%) | –0.018 | –0.018 | 0.001 | (–0.021; –0.015) | 0.982 | (0.979; 0.985) |
| Temporal trend | 0.072 | 0.072 | 0.001 | (0.070; 0.075) | 1.075 | (1.073; 1.078) |
| Logistic regression model for the excess of zeros | ||||||
| Intercept | 0.089 | 0.089 | 0.001 | (0.086; 0.091) | - | - |
| Variance of random effects | ||||||
| BYM IID (municipal level) | 0.241 | 0.242 | 0.021 | (0.216; 0.265) | - | - |
| BYM spatial (municipal level) | 0.759 | 0.763 | 0.171 | (0.654; 0.874) | - | - |
| IID spatiotemporal (area-time level) | 0.005 | 0.005 | 0.002 | (0.003; 0.007) | - | - |
| IID state level | 0.327 | 0.334 | 0.511 | (0.192; 0.985) | - | - |
BYM: Besag-York-Molie; 95%CI: 95% credible interval; ICU: intensive care unit; IID: independent and identically distributed; RR: risk ratio which is obtained as exp(Coefficient); RT-PCR: reverse transcription polymerase chain reaction; SD: standard deviation.
Bayesian mixed-effects regression model based on the negative binomial distribution for COVID-19 hospitalizations, and a logistic regression to model the excess of zeros. In the NB part, spatial and local random effects were included with the BYM approach, besides spatiotemporal random effects and a hierarchical effect for the state level, both with the Gaussian IID approach. DIC: 455.891.10.
In contrast, EAP coverage (RR: 0.986; 95%CI: 0.984-0.988) and first-dose COVID-19 vaccine coverage (RR: 0.982; 95%CI: 0.979-0.985) were inversely associated with hospitalization risk. A 1-percentage-point increase in vaccine coverage was associated with a 1.8% (95%CI: 1.5-2.1) reduction in risk, while a similar increase in EAP coverage corresponded to a 1.4% (95%CI: 1.2-1.6) reduction. Although individual estimates are numerically small, their impact increases with larger coverage changes. Under the log-link negative binomial model, a 10% increase in vaccine and EAP coverage was associated with 16.6% (95%CI: 14.4-18.6) and 13.9% (95%CI: 11.7-14.1) reductions in hospitalization risk, respectively.
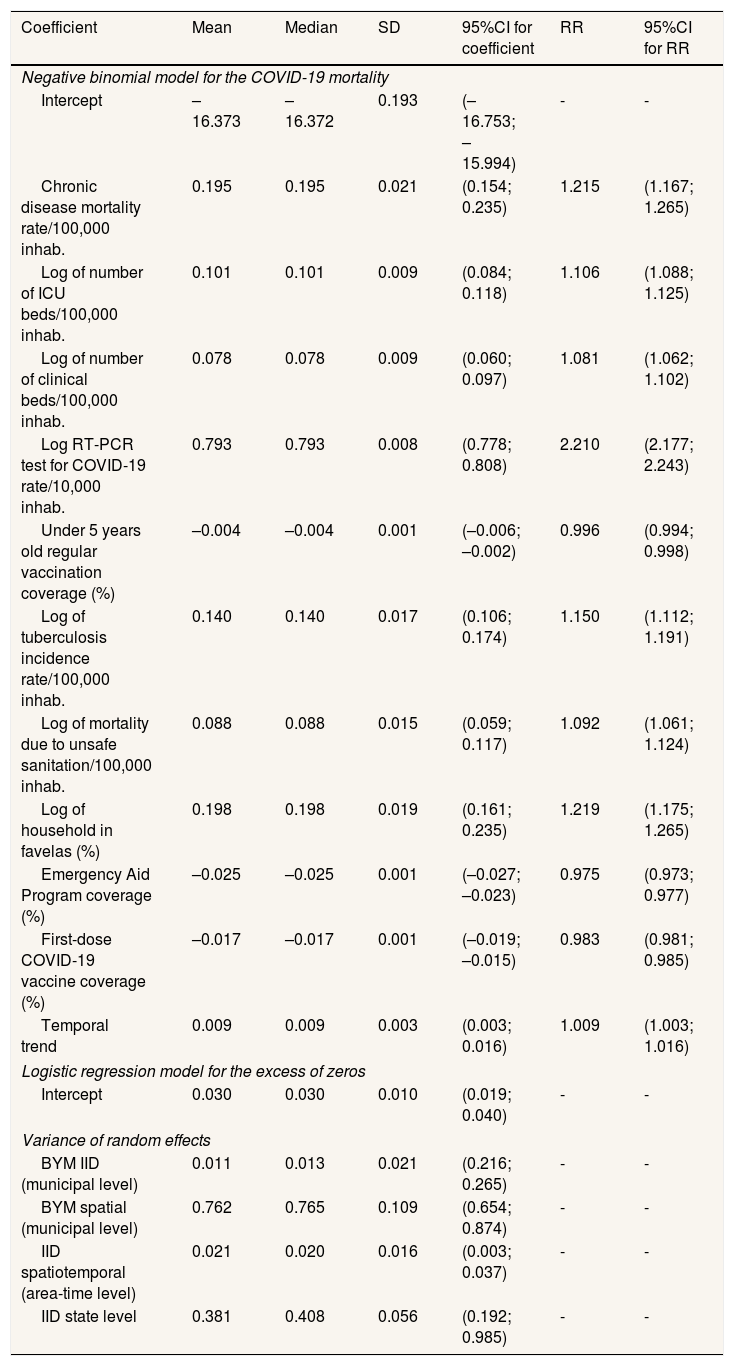
Table 3 presents the results for COVID-19 mortality. Positive associations with mortality risk were observed for chronic disease mortality (RR: 1.215; 95%CI: 1.167-1.265), ICU beds (RR: 1.206; 95%CI: 1.088-1.125), clinical beds (RR: 1.081; 95%CI: 1.062-1.102), RT-PCR testing rate (RR: 2.210; 95%CI: 2.122-2.273], tuberculosis incidence (RR: 1.150; 95%CI: 1.112-1.191), mortality due to unsafe sanitation (RR: 1.092; 95%CI: 1.061-1.124), and the proportion of households in favelas (RR: 1.219; 95%CI: 1.175-1.265). These findings indicate higher mortality in municipalities with greater hospital capacity and testing, and reinforce the role of comorbidity, poor sanitation, and socioeconomic disadvantage, including residence in urban agglomerations.
Results of the Bayesian modela for COVID-19 mortality in Brazilian municipalities, March 2020 to December 2021.
| Coefficient | Mean | Median | SD | 95%CI for coefficient | RR | 95%CI for RR |
|---|---|---|---|---|---|---|
| Negative binomial model for the COVID-19 mortality | ||||||
| Intercept | –16.373 | –16.372 | 0.193 | (–16.753; –15.994) | - | - |
| Chronic disease mortality rate/100,000 inhab. | 0.195 | 0.195 | 0.021 | (0.154; 0.235) | 1.215 | (1.167; 1.265) |
| Log of number of ICU beds/100,000 inhab. | 0.101 | 0.101 | 0.009 | (0.084; 0.118) | 1.106 | (1.088; 1.125) |
| Log of number of clinical beds/100,000 inhab. | 0.078 | 0.078 | 0.009 | (0.060; 0.097) | 1.081 | (1.062; 1.102) |
| Log RT-PCR test for COVID-19 rate/10,000 inhab. | 0.793 | 0.793 | 0.008 | (0.778; 0.808) | 2.210 | (2.177; 2.243) |
| Under 5 years old regular vaccination coverage (%) | –0.004 | –0.004 | 0.001 | (–0.006; –0.002) | 0.996 | (0.994; 0.998) |
| Log of tuberculosis incidence rate/100,000 inhab. | 0.140 | 0.140 | 0.017 | (0.106; 0.174) | 1.150 | (1.112; 1.191) |
| Log of mortality due to unsafe sanitation/100,000 inhab. | 0.088 | 0.088 | 0.015 | (0.059; 0.117) | 1.092 | (1.061; 1.124) |
| Log of household in favelas (%) | 0.198 | 0.198 | 0.019 | (0.161; 0.235) | 1.219 | (1.175; 1.265) |
| Emergency Aid Program coverage (%) | –0.025 | –0.025 | 0.001 | (–0.027; –0.023) | 0.975 | (0.973; 0.977) |
| First-dose COVID-19 vaccine coverage (%) | –0.017 | –0.017 | 0.001 | (–0.019; –0.015) | 0.983 | (0.981; 0.985) |
| Temporal trend | 0.009 | 0.009 | 0.003 | (0.003; 0.016) | 1.009 | (1.003; 1.016) |
| Logistic regression model for the excess of zeros | ||||||
| Intercept | 0.030 | 0.030 | 0.010 | (0.019; 0.040) | - | - |
| Variance of random effects | ||||||
| BYM IID (municipal level) | 0.011 | 0.013 | 0.021 | (0.216; 0.265) | - | - |
| BYM spatial (municipal level) | 0.762 | 0.765 | 0.109 | (0.654; 0.874) | - | - |
| IID spatiotemporal (area-time level) | 0.021 | 0.020 | 0.016 | (0.003; 0.037) | - | - |
| IID state level | 0.381 | 0.408 | 0.056 | (0.192; 0.985) | - | - |
BYM: Besag-York-Molie; 95%CI: 95% credible interval; ICU: intensive care unit; IID: independent and identically distributed; RR: risk ratio which is obtained as exp(Coefficient); RT-PCR: reverse transcription polymerase chain reaction; SD: standard deviation.
Bayesian mixed-effects regression model based on the negative binomial distribution for COVID-19 hospitalizations, and a logistic regression to model the excess of zeros. In the NB part, spatial and local random effects were included with the BYM approach, besides spatiotemporal random effects and a hierarchical effect for the state level, both with the Gaussian IID approach. DIC: 82,588.10.
Conversely, EAP coverage (RR: 0.975; 95%CI: 0.973-0.977), first-dose COVID-19 vaccine coverage (RR: 0.983; 95%CI: 0.981-0.985), and routine vaccination coverage in children under five (RR: 0.996; 95%CI: 0.994-0.996) were inversely associated with mortality. A 10% increase in vaccine and EAP coverage was associated with estimated reductions of 21.9% (95%CI: 19.8-24.0) and 16.6% (95%CI: 14.8-18.3) in mortality risk, respectively.
DiscussionInvestigating regional inequalities in COVID-19 remains highly relevant to inform future pandemic policies.22 This study evaluated associations between socioeconomic and demographic factors, access to health services, and COVID-19 hospitalization and mortality in Brazilian municipalities from March 2020 to December 2021. First-dose COVID-19 vaccine and EAP coverage were associated with reduced relative risks for both outcomes after adjustment for socioeconomic and health conditions. For mortality, regular vaccination coverage in children under five showed a similar association, suggesting that municipalities with stronger routine immunization capacity may be better prepared to implement care protocols during pandemics.
The pandemic disproportionately affected historically marginalized populations with structural vulnerabilities.23,24 Poor living conditions and poverty are key social determinants of health, underscoring the need for public policies to improve living and health conditions.25 Most governments responded with mobility restrictions.1 While closures of restaurants, bars, informal trade, and industrial activities helped contain the pandemic, they increased underemployment and unemployment.26,27 Economists have warned that rising unemployment and inflation would increase poverty and reduce living standards after COVID-19,27 a trend reflected in growing food insecurity.28
Our findings suggest that pandemic impacts could have been further reduced if income support had been more stable and conditional on adherence to disease-prevention measures.2–4
Income transfers to the most vulnerable populations reduce poverty, albeit temporarily. However, broader social policies such as education, housing, sanitation, working conditions, and remuneration directly influence the impact of specific health policies and should be enforced. Despite limitations, our findings indicate that income transfer policies contributed to reducing COVID-19 morbidity and mortality in Brazil, after adjustment for vaccination and other factors.
The proportion of households in favelas was positively associated with mortality, suggesting that urbanization and population density facilitated virus transmission. Tuberculosis incidence and mortality due to unsafe sanitation, also markers of socioeconomic deprivation, were similarly associated with higher risk. These results align with previous evidence showing that socioeconomic conditions strongly influenced COVID-19 morbidity and mortality in Brazil.2
We found evidence that first-dose COVID-19 vaccine coverage reduced hospitalization and mortality in Brazil. Vaccine supply was limited for a period,6,29 and immunization initially prioritized biologically vulnerable and socially disadvantaged groups, such as homeless and incarcerated populations.6,9,29 This strategy did not fully address residents of densely populated and deprived areas, where mobility restrictions were less feasible.6
COVID-19 vaccination substantially influenced pandemic dynamics, reducing severe cases, hospitalizations, and deaths, and remains one of the most effective measures for prevention and mitigation.6–9
For both outcomes, the spatial component and state-level hierarchical effects explained most residual variability after adjustment for socioeconomic, sociodemographic, and health indicators, highlighting spatial dependence between neighboring municipalities and differences in state-level pandemic management. The superior fit of the zero-inflated negative binomial model is consistent with the data structure, given the high proportion of zero counts for hospitalizations (37.5%) and deaths (87.2%), as well as overdispersion and heterogeneity across municipalities.
Finally, despite substantial financial resources, Brazil experienced high mortality and weak social protection. This raises a critical question: what might have occurred if income transfers had been more regular and better coordinated with social distancing measures?
Some limitations should be acknowledged. Ecological studies are useful for hypothesis generation but have limited causal inference, mainly due to ecological fallacy, whereby group-level associations may not apply to individuals. Reliance on aggregated data prevents control for individual-level confounders, reduces exposure precision, and hampers assessment of temporal relationships; therefore, results should be interpreted cautiously. In addition, we did not account for changes in eligibility criteria or benefit values for the EAP, considering only coverage for both EAP and vaccination. We also did not model counterfactual scenarios to estimate potential effects under alternative policy designs. Finally, individual-level factors related to health needs and susceptibility to COVID-19 could not be directly controlled.
In conclusion, this longitudinal ecological analysis shows that EAP coverage and COVID-19 vaccination were independently associated with lower COVID-19 hospitalization and mortality in Brazilian municipalities from March 2020 to December 2021. After adjustment for socioeconomic conditions, health service availability, comorbidities, and spatiotemporal effects, both income transfer and vaccination remained protective, with complementary roles in mitigating severe outcomes. These findings underscore the importance of coordinated social protection and public health policies in reducing the impact of health emergencies, especially in settings of structural inequality.
During the COVID-19 pandemic, many countries implemented or expanded cash transfer programs to alleviate the effects of the economic activity decrease and the potential growth of poverty and socioeconomic inequalities. In Brazil, the program implemented had a political narrative disconnected with the adherence to health preventive measures.
What does this study add to the literature?First dose COVID-19 vaccine coverage and Emergency Aid Programme had a protective effect against hospitalization and mortality, when controlled by socioeconomic variables, access to health services and spatio-temporal effects.
What are the implications of the results?The way the Emergency Aid Programme was implemented presented problems, such as the interruption of aid payments, reductions in amounts over the course of the benefit, and the use of public resources to pay people who did not meet the eligibility criteria.
Alberto Lana.
Transparency declarationThe corresponding author, on behalf of the other authors guarantee the accuracy, transparency and honesty of the data and information contained in the study, that no relevant information has been omitted and that all discrepancies between authors have been adequately resolved and described.
Authorship contributionsM. Silva Monteiro de Castro: conceptualization, study design, data interpretation, writing, review and editing. A. Andrade de Souza: conceptualization, study design, data interpretation, writing, review and editing. G. Lopes de Oliveira: study design, data collection, data analysis, figures, writing, review and editing. G. Drummond Marques da Silva: study design, data collection, data analysis, figures, writing, review and editing. L. Lemos Jardim: literature search, writing, review and editing. W. Debôrtoli Miranda: literature search and editing. R. Paes de Sousa: conceptualization, project administration, writing, review and editing.
FundingNone.
Conflicts of interestNone.


