


To analyse the gap in life expectancy by educational level in the city of Barcelona from 2004 to 2018 and to decompose this gap by age and causes of death.
MethodWe computed abridged life tables at the age of 25 years by sex from 2004 to 2018 using standard methods. Educational level was categorised in two groups (lower secondary or less vs. upper secondary or higher education). The life expectancy gap was further decomposed by age and by causes of death based in Arriaga's method in 5-year age blocks up to the age of ≥ 90 years and broad causes of death using ICD-10 codes.
ResultsThe life expectancy gap at 25 years by educational level oscillated without trend at around 3.08 years for men and 1.93 years for women. Decomposition by age showed a favourable significant shift in the contribution to this gap from young to older ages for men, with few changes for women. Decomposition by causes of death showed that the diseases concentrating the largest share of the contribution were neoplasms and respiratory and circulatory disease. There was a significant downward trend in external causes for men and in infectious diseases for both men and women but a significant upward trend for respiratory disease for both sexes.
ConclusionsThe stability of the life expectancy gap by educational level during the period analysed resulted from a combination of divergent trends by age and causes of death among high and low educational levels.
Analizar la brecha en la esperanza de vida por nivel educativo en la ciudad de Barcelona desde 2004 hasta 2018, y descomponer esta brecha por edad y causas de muerte.
MétodoSe calcularon tablas de vida abreviadas a la edad de 25 años por sexo desde 2004 hasta 2018 utilizando métodos estándar. El nivel educativo se clasificó en dos grupos: secundaria inferior o menor frente a secundaria superior o educación superior. La brecha de la esperanza de vida se descompuso además por edad y por causas de muerte según el método de Arriaga en bloques de edad de 5 años hasta la edad de ≥90 años y causas amplias de muerte utilizando los códigos de la CIE-10.
ResultadosLa brecha de la esperanza de vida a los 25 años por nivel educativo osciló sin tendencia en torno a los 3,08 años para los hombres y 1,93 años para las mujeres. La descomposición por edad mostró un cambio favorable a esta brecha desde las edades jóvenes a las mayores en los hombres, con pocos cambios en las mujeres. La descomposición por causas de muerte mostró una mayor contribución de las neoplasias y las enfermedades respiratorias y circulatorias. Hubo una tendencia a la baja en las causas externas en los hombres, y en las enfermedades infecciosas tanto en los hombres como en las mujeres, pero al alza en las enfermedades respiratorias para ambos sexos.
ConclusionesLa estabilidad de la brecha de la esperanza de vida por nivel educativo durante el periodo analizado fue el resultado de una combinación de tendencias divergentes por edad y causas de muerte entre los niveles educativos altos y bajos.
Determining the gap in life expectancy between the population with high and low educational levels is a useful way to summarise social inequalities in mortality in a single measure. Although mortality rates have followed a downward trend in western European countries in the last few decades, inequalities by educational level have tended to persist or even widen.1,2 Previous studies have reported that the gap in life expectancy at age 35 years across 14 European countries was 6.9 years for men and 3.2 years for women3, with eastern European countries showing larger gaps.4,5
For several decades, the Spanish population has experienced overwhelming sociodemographic and institutional changes along with increases of life expectancy of more than 40 years between 1910 and 2009.6 Pioneering studies have found territorial inequalities in mortality.7–9 However, fewer studies have analysed the gap in life expectancy by educational level in Spain.10–12 Looking at long-term inequalities, one study found that between 1960 and 2015 life expectancy increased for all education groups but particularly among the highly educated, thus widening inequalities between the populations with the lowest and highest educational levels.13
The life expectancy gap between two groups can be expressed through the contribution, positive or negative, of the underlying causes of death and age. Decomposition methods are ideal for determining whether life expectancy gaps are the result of different patterns. For instance, the decomposition of the gap across European countries shows much higher mortality rates from all the main causes of death among low-educated prime-age men, and half of the gap in mortality rate among men in this age group is due to higher death rates from circulatory diseases and cancer and to external causes of death (e.g. accidents and suicide).4 In Spain, the long-term increase in life expectancy by age in 1910 and 2009 has been attributed to the reduction in infant mortality until 1970; since then, the largest contribution has been found at older ages, mainly due to the decrease in mortality from diseases of the circulatory system.6 A 7-year follow-up study performed in Spain in 2001 on decomposition of inequalities in mortality patterns by educational level found that the main contributors for both sexes were cardiovascular and respiratory diseases.14 The relevance of decomposition analysis is that, if the ages or causes of death are sensitive to preventive interventions, decomposition approaches can provide public policy initiatives with evidence on which age groups or causes of death need to be targeted to reduce mortality.15 Because the largest share of the population lives in urban areas, there is increasing interest in the availability of official records of inequalities in life expectancy at the city level, as reflected by several international projects.16,17 In Spain, studies on socio-economic inequalities in life expectancy have been carried out at territorial level, for instance, the mortality atlas MEDEA3 in Spain analyses 26 cities at small area level including Barcelona city. However, a decomposition by age and causes of death by area would represent an excess of information that is difficult to handle and interpret. In contrast, the decomposition by educational level is easier to obtain and meaningful. To our knowledge this is the first study that applies decomposition techniques in a city in Spain. In doing so, we aim to contribute to a better understanding of the inequalities in life expectancy at city level. In this study, we analysed the gap in life expectancy by educational level in the city of Barcelona from 2004 to 2018 and analysed the decomposition of this gap by age and broad causes of death.
MethodPopulation and variablesThe study population consisted of deaths occurring from 2004–2018 among persons aged ≥25 years who were resident in Barcelona city, for whom complete educational level was available due to individual linkage between the mortality register and the municipal census of Barcelona. The population aged ≥25 years consisted of more than 1.2 million persons for each year, of which approximately 53% were women in each year.
Age-standardised mortality rates (with reference to the 2011 population calculated by the direct method) by educational level, sex and year are reported. Death counts were available in 5-year age blocks from the mortality register of Barcelona. The underlying cause of death was classified using International Classification of Diseases, Tenth revision (ICD-10) codes. The analysis was performed for broad causes of death (1 digit) and the results are reported for 11 groups concentrating 98% and 93% of deaths for men and women. The remaining causes were collapsed into a category termed “other”.
We included the highest level of education attained. To obtain reliable estimates of life expectancy and its decomposition by age and cause, educational level was categorised in two groups: medium and low level was defined as no formal education or pre-primary education, primary education and lower secondary education (ISCED 0 to 2), while high educational level was defined as upper secondary education and university education (ISCED from 3 to 8). To identify differences by educational attainment, we restricted the analysis to the population aged 25 years and older, as a person's education is usually complete by that age.
Life expectancy gap by education and its decompositionAbridged (based on 5-year age groups) life tables at the age of 25 years by sex from 2004 to 2018 were computed using standard methods, except for 2009, for which deaths desegregated by educational level were lacking. The cut-off age of 25 years was chosen as the minimum age at which the educational level is sufficiently stable and retains the most information on the cause of mortality. The tables were created using the numbers of deaths registered in calendar years and mid-year population estimates. In the case of small populations, as in our case, a common practice is to introduce uncertainty in the number of deaths. Following Chiang, by modelling the number of deaths as a binomial event for each age group, the standard error for life expectancy can be computed for each year.18 To assess the stability and reliability of life expectancy estimates, we calculated relative standard errors, defined as the ratio of the standard error (RSE) and life expectancy. The higher the RSE, the more unstable the estimate. An RSE of around 30% is considered reliable. A z-score was computed to assess the significance of the gaps in life expectancy by educational level for each year.19
Decomposition of the life expectancy gap is an extension of the decomposition methods in life expectancy developed by Arriaga.20 Briefly, decomposition of life expectancy between high and low educational levels consists of the sum of two effects: the first is the direct number of years that an age group adds to the life expectancy gap, due to higher mortality in that specific age group in each educational level; the second effect consists of the indirect effect on the higher mortality in that age group, leaving fewer survivors and affecting all later age groups in the life table. To decompose by cause of death, the total contribution of a given age group is further divided into the number of years contributed by each cause. The total contribution by causes of death is simply obtained by adding the contributions across age groups. We adapted the life tables and decomposition programmes from Auger et al.15 using Stata version 15 (code in the Supplementary Material). A linear regression was performed to identify whether there was a linear tendency in life expectancy and to determine the contribution of age and cause of death in the period analysed.
ResultsLife expectancy gap by educationData on the population showed a constant decrease over the years among men and women in the medium and low educational level and, conversely, an increase in the population with a high educational level (Table 1). A downward trend was observed in age-standardised mortality rates at 25 years. Mortality rates were higher in men than in women and were also higher in both sexes with a lower educational level.
Population and standardised mortality rate per 100,000 persons at 25 years and older, by educational level and sex, in Barcelona 2004-2018a.
| Men | Women | |||||||
|---|---|---|---|---|---|---|---|---|
| Medium and low educational level | High educational level | Medium and low educational level | High educational level | |||||
| Persons | SMR | Persons | SMR | Persons | SMR | Persons | SMR | |
| 2004 | 288197 | 1940.2 | 283642 | 1654.5 | 385016 | 1079.3 | 279966 | 877.3 |
| 2005 | 289308 | 2048.2 | 290488 | 1683.7 | 381591 | 1145.1 | 289172 | 929.1 |
| 2006 | 290042 | 1858.2 | 297491 | 1525.3 | 377345 | 1038.4 | 298034 | 911.6 |
| 2007 | 283750 | 1898.0 | 297928 | 1612.5 | 369639 | 1053.9 | 301606 | 906.1 |
| 2008 | 286573 | 1812.1 | 305152 | 1500.1 | 367118 | 1044.2 | 311584 | 892.1 |
| 2010 | 276902 | 1698.2 | 314386 | 1429.8 | 353933 | 961.2 | 329441 | 798.8 |
| 2011 | 277398 | 1652.3 | 316616 | 1358.3 | 347512 | 940.5 | 334369 | 813.9 |
| 2012 | 268773 | 1724.8 | 324616 | 1443.8 | 336891 | 980.4 | 345405 | 812.0 |
| 2013 | 253308 | 1588.3 | 335804 | 1291.1 | 319517 | 896.4 | 361456 | 772.6 |
| 2014 | 253308 | 1585.0 | 335804 | 1303.5 | 319517 | 905.7 | 361456 | 776.1 |
| 2015 | 248183 | 1572.4 | 338190 | 1281.5 | 312482 | 909.7 | 366137 | 783.5 |
| 2016 | 240599 | 1526.3 | 342664 | 1267.4 | 303817 | 896.4 | 373841 | 750.5 |
| 2017 | 236082 | 1523.0 | 349163 | 1238.3 | 297280 | 877.0 | 383445 | 684.9 |
| 2018 | 234678 | 1570.3 | 360880 | 1235.9 | 291905 | 898.6 | 397318 | 719.1 |
SMR: standardised mortality rate.
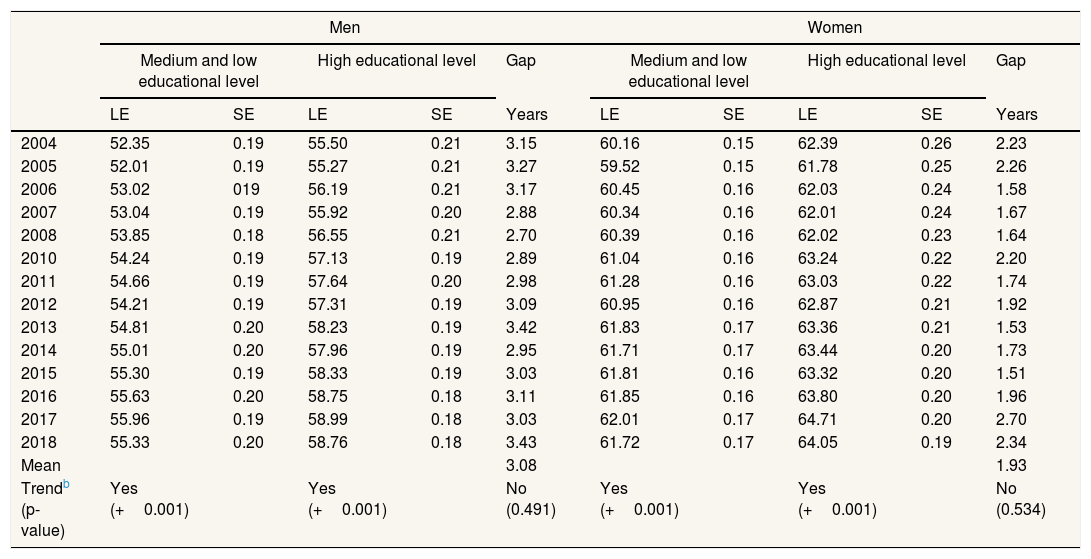
Analogous to mortality rates, life expectancy was higher in women than in men across all years (Table 2). The life expectancy for men and women increased throughout the period with a positive significant trend, except for 2005, 2012 and 2018, when life expectancy slightly decreased for both sexes irrespective of educational level. Life expectancy at 25 years increased between 2004 and 2018 by 2.98 years for men with a high educational level and by 3.27 years for those with a medium and low educational level. The increase for women was lower: 1.55 and 1.66 years, respectively.
Life expectancy gap at 25 years by educational level and sex in Barcelona (2004-2018)a.
| Men | Women | |||||||||
|---|---|---|---|---|---|---|---|---|---|---|
| Medium and low educational level | High educational level | Gap | Medium and low educational level | High educational level | Gap | |||||
| LE | SE | LE | SE | Years | LE | SE | LE | SE | Years | |
| 2004 | 52.35 | 0.19 | 55.50 | 0.21 | 3.15 | 60.16 | 0.15 | 62.39 | 0.26 | 2.23 |
| 2005 | 52.01 | 0.19 | 55.27 | 0.21 | 3.27 | 59.52 | 0.15 | 61.78 | 0.25 | 2.26 |
| 2006 | 53.02 | 019 | 56.19 | 0.21 | 3.17 | 60.45 | 0.16 | 62.03 | 0.24 | 1.58 |
| 2007 | 53.04 | 0.19 | 55.92 | 0.20 | 2.88 | 60.34 | 0.16 | 62.01 | 0.24 | 1.67 |
| 2008 | 53.85 | 0.18 | 56.55 | 0.21 | 2.70 | 60.39 | 0.16 | 62.02 | 0.23 | 1.64 |
| 2010 | 54.24 | 0.19 | 57.13 | 0.19 | 2.89 | 61.04 | 0.16 | 63.24 | 0.22 | 2.20 |
| 2011 | 54.66 | 0.19 | 57.64 | 0.20 | 2.98 | 61.28 | 0.16 | 63.03 | 0.22 | 1.74 |
| 2012 | 54.21 | 0.19 | 57.31 | 0.19 | 3.09 | 60.95 | 0.16 | 62.87 | 0.21 | 1.92 |
| 2013 | 54.81 | 0.20 | 58.23 | 0.19 | 3.42 | 61.83 | 0.17 | 63.36 | 0.21 | 1.53 |
| 2014 | 55.01 | 0.20 | 57.96 | 0.19 | 2.95 | 61.71 | 0.17 | 63.44 | 0.20 | 1.73 |
| 2015 | 55.30 | 0.19 | 58.33 | 0.19 | 3.03 | 61.81 | 0.16 | 63.32 | 0.20 | 1.51 |
| 2016 | 55.63 | 0.20 | 58.75 | 0.18 | 3.11 | 61.85 | 0.16 | 63.80 | 0.20 | 1.96 |
| 2017 | 55.96 | 0.19 | 58.99 | 0.18 | 3.03 | 62.01 | 0.17 | 64.71 | 0.20 | 2.70 |
| 2018 | 55.33 | 0.20 | 58.76 | 0.18 | 3.43 | 61.72 | 0.17 | 64.05 | 0.19 | 2.34 |
| Mean | 3.08 | 1.93 | ||||||||
| Trendb (p-value) | Yes (+0.001) | Yes (+0.001) | No (0.491) | Yes (+0.001) | Yes (+0.001) | No (0.534) | ||||
LE: life expectancy; SE: standard error.
The gap in life expectancy at 25 years by educational level for men and women was fairly stable across the years, oscillating without trend around a mean value of 3.08 years for men and 1.93 years for women. For men, however, the gap decreased from 3.27 years in 2005 to 2.70 years in 2008 and increased again to reach 3.42 years in 2013, and then decreased again until reaching a maximum of 3.43 years in 2018. For women, the gap in life expectancy by education also decreased from 2.26 years in 2005, increased again in 2010, decreased again until 2015, before reaching a new maximum of 2.70 in 2018. The z-scores derived from the ratio between the life expectancy gap and the standard errors strongly rejected the null hypothesis of the equality of life expectancies by education for all years in men and women. The average RSE across years were in the range of 26.5% to 36.0%, showing acceptably reliable life expectancy estimates (not shown).
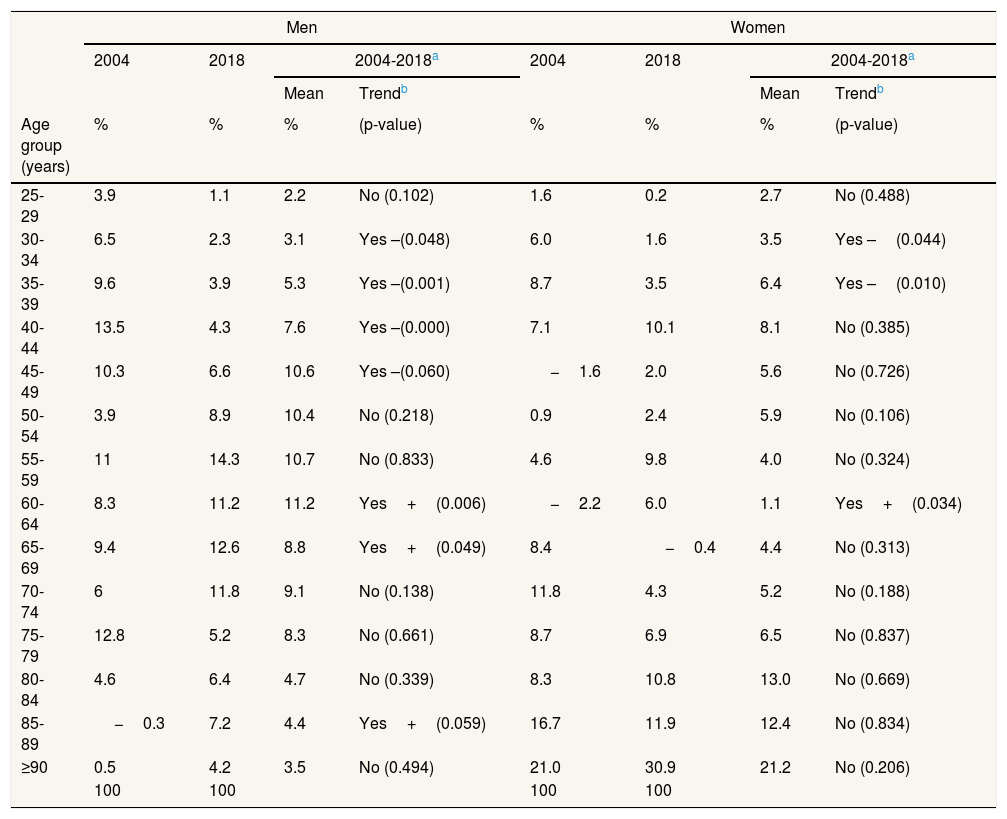
Decomposition by age groupDecomposition by age group of the life expectancy gap at 25 years is shown in percentages in Table 3. For simplicity, the table shows only the contributions for 2004 and 2018 plus the mean values for the overall period with trend. Detailed information for each year is included in Table I of the online Appendix.
Contribution to the life expectancy gap at 25 years by educational level presented by age group in 2004 and 2018 and mean values, and trend for 2004-2018.
| Men | Women | |||||||
|---|---|---|---|---|---|---|---|---|
| 2004 | 2018 | 2004-2018a | 2004 | 2018 | 2004-2018a | |||
| Mean | Trendb | Mean | Trendb | |||||
| Age group (years) | % | % | % | (p-value) | % | % | % | (p-value) |
| 25-29 | 3.9 | 1.1 | 2.2 | No (0.102) | 1.6 | 0.2 | 2.7 | No (0.488) |
| 30-34 | 6.5 | 2.3 | 3.1 | Yes –(0.048) | 6.0 | 1.6 | 3.5 | Yes –(0.044) |
| 35-39 | 9.6 | 3.9 | 5.3 | Yes –(0.001) | 8.7 | 3.5 | 6.4 | Yes –(0.010) |
| 40-44 | 13.5 | 4.3 | 7.6 | Yes –(0.000) | 7.1 | 10.1 | 8.1 | No (0.385) |
| 45-49 | 10.3 | 6.6 | 10.6 | Yes –(0.060) | −1.6 | 2.0 | 5.6 | No (0.726) |
| 50-54 | 3.9 | 8.9 | 10.4 | No (0.218) | 0.9 | 2.4 | 5.9 | No (0.106) |
| 55-59 | 11 | 14.3 | 10.7 | No (0.833) | 4.6 | 9.8 | 4.0 | No (0.324) |
| 60-64 | 8.3 | 11.2 | 11.2 | Yes+(0.006) | −2.2 | 6.0 | 1.1 | Yes+(0.034) |
| 65-69 | 9.4 | 12.6 | 8.8 | Yes+(0.049) | 8.4 | −0.4 | 4.4 | No (0.313) |
| 70-74 | 6 | 11.8 | 9.1 | No (0.138) | 11.8 | 4.3 | 5.2 | No (0.188) |
| 75-79 | 12.8 | 5.2 | 8.3 | No (0.661) | 8.7 | 6.9 | 6.5 | No (0.837) |
| 80-84 | 4.6 | 6.4 | 4.7 | No (0.339) | 8.3 | 10.8 | 13.0 | No (0.669) |
| 85-89 | −0.3 | 7.2 | 4.4 | Yes+(0.059) | 16.7 | 11.9 | 12.4 | No (0.834) |
| ≥90 | 0.5 | 4.2 | 3.5 | No (0.494) | 21.0 | 30.9 | 21.2 | No (0.206) |
| 100 | 100 | 100 | 100 | |||||
For instance, Table 3 shows that, in 2004, men aged 40-44 years made the largest contribution (13.5%) to the life expectancy gap (0.42 years) by educational level (3.1 years). The decomposition showed different pattern by gender. For men, the contribution to the gap was more evenly distributed among age groups. The main consistent finding was a shift in the contribution to older ages throughout the period. The contribution made by persons aged between 35 and 49 years (39.9% in 2004 to 26.6% in 2018) showed a statistically significant shift to the group aged between 60 and 69 years (17.7% in 2004 to 23.8% in 2018). For women, the pattern was quite different, with most of the contribution being concentrated at the age of 70 years and older and the contribution was stable across the study period (around 60%). However, a downward trend was also observed among women aged between 30 and 39 years (14.7% in 2004 to 5.1% in 2018).
Decomposition by cause of deathThere were also gender differences in the decomposition by groups of causes of death in the life expectancy gap by educational level (Table 4). Detailed information for each year is included in Table II of the online Appendix.
Contribution to the life expectancy gap at 25 years by educational level presented by broad causes of death in 2004 and 2018, and mean values and trend for 2004-2018.
| Men | Women | |||||||
|---|---|---|---|---|---|---|---|---|
| 2004 | 2018 | 2004-2018a | 2004 | 2018 | 2004-2018a | |||
| Mean | Trendb | Mean | Trendb | |||||
| Broad causes of death (IDC-10) | % | % | % | (p-value) | % | % | % | (p-value) |
| Circulatory system (I00-I99) | 21.3 | 13.2 | 18.2 | No (0.879) | 22.8 | 29.5 | 28.6 | No (0.766) |
| Neoplasms (C00-D48) | 19.5 | 34.4 | 28.8 | No (0.141) | 11.5 | 6.4 | 5.3 | No (0.514) |
| External causes (V01-Y98) | 14.8 | 7.7 | 9.8 | Yes –(0.007) | 3.5 | 3.5 | 7.4 | No (0.217) |
| Respiratory system (J00-J99) | 14.2 | 19 | 15.3 | Yes+(0.071) | 3.4 | 15.1 | 8.2 | Yes+(0.003) |
| Infectious & parasitic (S00-B99) | 9.1 | 0.1 | 5.5 | Yes –(0.001) | 8.3 | 2.0 | 7.3 | Yes –(0.060) |
| Digestive system (K00-K93) | 8.9 | 9.9 | 8.7 | No (0.442) | 11.4 | 8.6 | 8.8 | No (0.514) |
| Endocrine (E00-E90) | 4.4 | 4.3 | 3.3 | No (0.315) | 5.9 | 4.4 | 8.0 | No (0.234) |
| Mental & health behav. (F00-F99) | 3.9 | 4.2 | 3.6 | No (0.156) | 16.6 | 6.9 | 9.8 | No (0.914) |
| Nervous system (G00-G99) | 1.6 | 3.9 | 3 | Yes+(0.096) | 2.8 | 6.5 | 7.6 | No (0.211) |
| Genitourinary system (N00-N99) | 1.1 | 2 | 1.6 | No (0.197) | 8.5 | 5.1 | 4.6 | No (0.638) |
| Abnormal (R00-R99) | 1.3 | 0.6 | 1.1 | Yes –(0.025) | 3.0 | 2.2 | 1.4 | No (0.526) |
| Others | −0.1 | 0.7 | 1.1 | No (0.872) | 2.3 | 9.8 | 3.0 | No (0.202) |
| 100 | 100 | 100 | 100 | |||||
For men, the causes of death with the largest mean contribution to the life expectancy gap by educational level for the whole period were neoplasms (28.8%), circulatory system diseases (18.2%), respiratory system diseases (15.3%) and external causes (9.8%). There was a significant upward trend in the contribution of respiratory diseases (14.2% in 2004 to 19% in 2018), but a significant downward trend in external causes (14.8% in 2004 to 7.7% in 2018) and infectious diseases (9.1% in 2004 to 0.1% in 2018).
For women, the causes of death making the largest mean contribution to the life expectancy gap by educational level for the whole period were circulatory diseases (28.6%), followed by mental and behavioural disorders (9.8%), gastrointestinal diseases (8.8%) and respiratory system diseases (8.2%). Among women, there was a significant upward trend in the contribution of respiratory diseases (3.4% in 2004 to 15.1% in 2018) and a downward trend for infectious diseases (8.2% in 2004 to 2.0% in 2018), with the other causes contributing around their mean values without significant trend.
DiscussionUsing linked data between mortality registers and the census for Barcelona from 2004 to 2018 (except for 2009), we found a statistically significant gap in life expectancy by educational level for men and women, of 3.08 and 1.93 years, respectively. Decomposition of the gap by age group among men showed a larger contribution in the middle-aged group that shifted to the older age group over time, while the contribution among women was concentrated at older ages and remained stable. Decomposition of the gap by cause of death showed that the main contributor was neoplasms for men and circulatory diseases for women. There was a downward contribution of external causes in men and of infectious disease in men and women, but an upward trend in the contribution of respiratory diseases in both sexes, with a higher increase in women.
Trends were not apparently affected by the potential adverse effect of the economic crisis since 2008. Other studies conducted in the Spanish population during the post-crisis period have also found a constant downward trend in mortality from 2001 to 2011 and consequently an upward trend in life expectancy by educational level.21 Similarly, a study analysing inequalities in mortality through an index of deprivation in small areas in nine Spanish cities between 2001 and 2012 found stable trends, despite some heterogeneity by causes of death, with traffic injuries accounting for the only decrease in the post-crisis period for some cities, including Barcelona.22 For the longer period from 1996 to 2015 in Spain, cuts to medical staff and reductions in hospital beds appear to have significantly increased mortality rates from circulatory diseases and external causes, but not mortality from other causes of death. These increases appear to be driven by deaths occurring during emergency treatment, suggesting accessibility problems,23 which have a limited impact in densely populated cities such as Barcelona.
As already mentioned, prior research has also found similar results to our own in terms of a persistence of social inequalities in life expectancy.1,2 However, even a small gap in years may imply different patterns by age and causes of death. In our study, decomposition methods by age showed an improvement due to a decreasing contribution to the gap by persons aged less than 49 years and a shift to older ages between 2004 and 2018, especially for men. Decomposition by broad causes of death showed a favourable downward trend in the contribution of external causes of death among men (mainly due to traffic injuries and overdoses). Official records show that road traffic injuries decreased by 49.2% for men and 43.2% for women during the period analysed, but data is not available by education level.24 Our results suggest that this downward trend was more favourable among men with a low educational level, thus contributing to a narrowing of the life expectancy gap, but not for women.
Conversely, our finding of the relative importance and the adverse trend in the contribution of respiratory diseases to the life expectancy gap among men and women needs further investigation in relation to risk factors. Obviously, tobacco smoking can affect several causes of death, especially cardiovascular and respiratory diseases and neoplasms. Cardiovascular and respiratory diseases are also the main contributors to inequalities in mortality by educational level for men and women in Spain.14 In turn, tobacco smoking is influenced by social class. The international evidence indicates that tobacco smoking is the leading risk factor contributing to the gap in life expectancy by educational level (19.8% among men and 18.9% among women),25 while relative inequalities in respiratory diseases are often larger in younger age groups.26 In Spain, tobacco smoking is also the leading risk factor in disability-adjusted years lost attributable to neoplasms and cardiovascular and respiratory diseases among men and is the sixth among women, with high body mass index being the first.27 Despite the large reductions in smoking since the introduction of the law restricting smoking in 2005, inequalities in tobacco consumption are still present, with differences by sociodemographic groups and the phase of the epidemic wave.28
The persistence of inequalities in life expectancy is a matter of concern for public health policy to the extent that these inequalities can be reduced by improving the socioeconomic conditions in which people live and work, promote the adoptions of healthier behaviours, facilitate access to appropriate health care and provide healthier urban environments. Decomposition analysis can provide an integrated framework for monitoring inequalities in life expectancy that reflect partial targets for reducing mortality by age and cause.
Our research has several limitations. Official census registers can under-report the immigrant population; in addition, a “healthy migrant effect” has been reported for Barcelona,29 and this phenomenon may have reduced the gap in life expectancy through lower mortality rates among the low-income population. Our results should be interpreted as an initial approach but further analysis by cause-specific deaths is strongly recommended because broad causes of death can hide divergent trends within specific causes. The life expectancy gap reported in the presented study can be interpreted as a conservative estimate as we conflated educational levels in two categories in order to obtain reliable estimates instead of using the extreme categories. Nonetheless, the effect is probably small, as the life expectancy of the conflated categories is very close to our final classification. Finally, other methods have been suggested to account for uncertainty in life expectancy in the final open-ended age30. However, both methods produce almost identical life expectancy estimates across a large range of population sizes31, as is the case in the present study according to the reliability measures of the RSE.
To sum up, the stability in the life expectancy gap by educational level during the period analysed resulted from the combination of divergent trends by age and causes of death among high and low educational levels. Decomposition by age and cause of death may help to compute contrafactual hypotheses and allow the design of policies to reduce inequalities in life expectancy.
Statistical codes to generate life tables and decomposition by cause and age are provided in the online Appendix.
Availability of databases and material for replicatingData available to persons on request to xbartoll@aspb.cat from the Institut d’Investigació Biomèdica Sant Pau, Barcelona (Spain), in accordance with the data policy applicable to the Barcelona health survey.
Although life expectancy has followed an upward trend in the last decade, inequalities by educational level have tended to persist or even widen.
What does this study add to the literature?In Barcelona city, the persistence of a life expectancy gap by educational level decomposes in divergent trends by age and causes of death among high and low educational levels.
What are the implications of the results?Monitoring and computing of contrafactual hypotheses is recommended to allow the design of policies to reduce social inequalities in life expectancy.
Miguel Ángel Negrín Hernández.
Transparency declarationThe corresponding author on behalf of the other authors guarantee the accuracy, transparency and honesty of the data and information contained in the study, that no relevant information has been omitted and that all discrepancies between authors have been adequately resolved and described.
Authorship contributionsX. Bartoll-Roca designed the study and carried it out. M. Rodríguez-Sanz contributed to the methodological discussion. M. Rodríguez-Sanz, E. Sánchez, K. Pérez and C. Borrell have contributed corrections and improvements in the writing and final presentation of the study.
FundingNone.
Conflicts of interestNone.


