


The 3rd International Nursing and Health Sciences Students and Health Care Professionals Conference (INHSP)
Más datosThis study aimed at comparing serum levels of leptin in children with malnutrition and good nutritional status.
MethodThis cross-sectional study included 41 participants consisting of 31 malnutrition, 10 well-nourished children aged between 36 and 60 months. Demographic data of participants were obtained utilizing a questionnaire. Nutritional status was determined by calculating the Z-score of body weight for age, height for age, and body weight for height indices using the WHO classification. Leptin levels were determined by ELISA (Enzyme-Linked Immunosorbent Assay) method.
ResultsMedian serum leptin level for malnutrition children were found to be lower, i.e., 9.23 (6.02–197.2) ng/mL compared to well-nourished children 30.95 (6.02–89.36) ng/mL.
ConclusionSerum leptin levels can be used as indicators to assess nutritional status.
Malnutrition is one of the most common health problems in the world. Growth disorders due to this condition generally occur in post-weaning children, which are caused by a lack of food. Conditions that can interfere with access to children's nutrition, especially energy and protein, will cause growth and development disorders.1
Malnutrition is a disease in which the body cannot get enough nutrition. Malnutrition can also be called a disease caused by an imbalance between food intake and the nutrients needed to maintain health.2
Factors that influence malnutrition include maternal education, family income, family members, birth weight, birth length, environmental sanitation conditions, and exclusive breastfeeding.
Normal growth and development in children also depend on hormonal factors. Normal nutritional status is required for linear growth.3 One of the hormones that affect growth and development is the serum level of leptin, the protein of the Ob gene and a hormone secreted by fat cells, which plays a vital role in the body's energy homeostasis by controlling food intake. Leptin concentration is associated with total fat mass, and levels are higher in obese people. The decrease in leptin after energy restriction is a signal of brain starvation and may have a protective effect.4
Experimental studies have provided evidence to support the hypothesis that leptin acts as a neuromodulator of the GH-GH-IGF-1 release factor axis by linking the hormone system to nutritional status. However, many clinical studies have shown that patients with malnutrition protein-energy have low serum leptin levels, and there is no correlation between leptin and growth factors.5
It is still rare to identify the nutritional status of children with growth-related hormone tests. Although examining growth-related hormones is challenging, there is still a lack of knowledge and research on accurate growth-related hormone testing to determine nutritional status. This is what motivated us to be interested in researching how leptin levels are in malnutrition children.
Research and methodsLocation and research designThe research lasted for August–September 2020 and was carried out in Bara-baraya community health center, and measurement of leptin levels was conducted using ELISA (Enzyme-Linked Immunosorbent Assay) Hasanuddin University Research Laboratory Unit. This study was a prospective observational study with a Cross-Sectional Study design; the aim was to determine the levels of leptin in malnutrition children based on nutritional status. The independent variable was malnutrition; the dependent variable, namely leptin levels, was studied in the same period.
Population and subjectThe population of this study was all children aged 36–60 months in Community health bara-baraya. The sampling technique used in this study was the simple random sampling technique that met the inclusion criteria of Children mothers who are willing to have their children become respondents and children aged 36–60 months. This study has received a recommendation of approval from the Ethical Commission for Health Research of Medical Faculty, Hasanuddin University Makassar with Number 521/UN4.6.4.5.31/PP36/2020 and Protocol Number UH20060266.
Method and data analysisThe instruments used in this study were questionnaires and measurements of leptin levels. The questionnaire was data collected by providing a list of questions to the respondent. Leptin levels were measured using ELISA (Enzyme-Linked Immunosorbent Assay) at the Hasanuddin University RSP Research Laboratory Unit. First, the data were analyzed using the Chi-square and Mann–Whitney.
ResultsThe characteristics of the research respondents included family characteristics, social economy, environmental sanitation, birth history, and morbidity history listed in Tables 1 and 2.
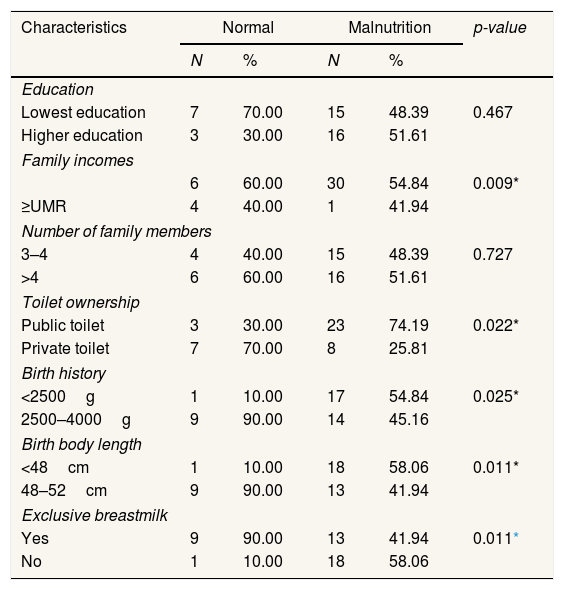
Distribution characteristics of Respondents at Community Health Center (Community health) Bara-Baraya Makassar (n=41).
| Characteristics | Normal | Malnutrition | p-value | ||
|---|---|---|---|---|---|
| N | % | N | % | ||
| Education | |||||
| Lowest education | 7 | 70.00 | 15 | 48.39 | 0.467 |
| Higher education | 3 | 30.00 | 16 | 51.61 | |
| Family incomes | |||||
| 6 | 60.00 | 30 | 54.84 | 0.009* | |
| ≥UMR | 4 | 40.00 | 1 | 41.94 | |
| Number of family members | |||||
| 3–4 | 4 | 40.00 | 15 | 48.39 | 0.727 |
| >4 | 6 | 60.00 | 16 | 51.61 | |
| Toilet ownership | |||||
| Public toilet | 3 | 30.00 | 23 | 74.19 | 0.022* |
| Private toilet | 7 | 70.00 | 8 | 25.81 | |
| Birth history | |||||
| <2500g | 1 | 10.00 | 17 | 54.84 | 0.025* |
| 2500–4000g | 9 | 90.00 | 14 | 45.16 | |
| Birth body length | |||||
| <48cm | 1 | 10.00 | 18 | 58.06 | 0.011* |
| 48–52cm | 9 | 90.00 | 13 | 41.94 | |
| Exclusive breastmilk | |||||
| Yes | 9 | 90.00 | 13 | 41.94 | 0.011* |
| No | 1 | 10.00 | 18 | 58.06 | |
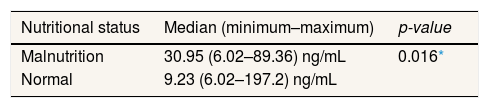
Differences in leptin levels in malnutrition and normal childrens.
| Nutritional status | Median (minimum–maximum) | p-value |
|---|---|---|
| Malnutrition | 30.95 (6.02–89.36) ng/mL | 0.016* |
| Normal | 9.23 (6.02–197.2) ng/mL |
The table above shows the characteristics of the family based on the number of family members, the majority of which has >4 family members. When viewed from the socioeconomic perspective, more respondents have mothers with low education and low family income. Household sanitation, in this case, is ownership of toilets, most of which do not have private toilets. Viewed from the birth history, more people have a birth weight of 2500–4000g, a birth length of 48cm, and get exclusive breastfeeding (Table 1).
The Mann–Whitney statistical test was used to determine the differences in leptin levels in malnutrition and normal children because the leptin level data were not normally distributed. Although the statistical tests showed differences in leptin levels in malnutrition and normal children (p<0.016), leptin levels of malnutrition children are low.
DiscussionThe Mann–Whitney test results showed differences in leptin levels between children with normal nutritional status and malnutrition nutritional status. The most vulnerable age to malnutrition deficiency is two years because this is the transition period from breastfeeding to substitute breast milk. Breastmilk substitutes often have a high carbohydrate content but poor quality and protein content.6
Children aged 3–5 years have the risk of experiencing malnutrition. Food problems often occur because children have started to become active consumers who tend to be picky about the food they want to consume.7
Leptin, an Ob gene protein, is a hormone secreted by adipocytes that plays a vital role in the body's energy homeostasis by controlling food intake.8 Leptin regulates adipose tissue quality and body weight by inhibiting food intake and stimulating energy expenditure. In addition, leptin affects food intake by controlling appetite in the hypothalamus and brainstem.9
Large fat tissue contains more leptin than smaller fat tissue in individuals, whereas leptin resistance is often found in obesity. This situation occurs due to the disruption of leptin transport in the brain so that the hypothalamus in obese individuals becomes leptin-deficient. As a result, the leptin level reaches a maximum value in the morning and a minimum value in the afternoon.10
Serum leptin levels are influenced by nutritional status and energy intake. Hence, it could be an indicator of excess energy storage or chronic nutrition.11 Palacio et al.,5 identified low serum leptin levels in malnutrition children compared with normal children and thought that this increase was due to suppression of leptin secretion due to reduced subcutaneous adipose tissue resulting from reduced energy intake.
This study showed that the median value for malnutrition children was lower by 9.23 (6.02–197.2) ng/mL than normal children by 30.95 (6.02–89.36) ng/mL. This is because, in malnutrition children, loss of adipose tissue due to decreased food intake causes a decrease in leptin secretion, serum leptin levels correlate with malnutrition levels in children by observing that this is a reflection of the loss of adipose tissue.
In malnutrition children, changes in leptin concentration will reduce GH production. In one study, a reduction in the administration of serum leptin to a test object resulted in a decrease in GH secretion. In hungry conditions, there is a decrease in leptin and GH secretion. Leptin has a direct role in growth, that is synergizing with thyroid hormones in regulating chondrocyte differentiation.12
GH binds to the extracellular domain and causes activation of several intracellular signaling pathways. When protein and calories are malnutrition, leptin, responsible for sending out disruptive signals, can reduce calorie restriction on the GH (growth hormone) receptors, leading to weight loss problems. Leptin levels are also influenced by the hormone insulin (IGF-1) and cytokines (IL, TNF-α). Leptin is also known as the anti-obesity hormone. Malnutrition causes a decrease in energy intake, fat mass, and IGF-1, which suppresses leptin production.
ConclusionA cross-sectional study has been conducted, and after statistical analysis, it can be concluded that there is a comparison of leptin levels by showing that the median value of malnutrition children is lower than normal children with a median value of 30.95 (6.02–89.36) ng/mL at Normal children and 9.23 (6.02–197.2) ng/mL in malnutrition children. Levels in malnutrition children are lower than in normal children.
Conflicts of interestThe authors declare no conflict of interest.
Peer-review under responsibility of the scientific committee of the 3rd International Nursing, Health Science Students & Health Care Professionals Conference.


