


To describe the relationship between industry and physicians and to analyze the physician characteristics associated with the probability of receiving benefits from industry in Aragon (Spain).
MethodsWe carried out an observational, cross-sectional study in which Aragonese physicians (north-east region in Spain) from public and private settings completed an anonymous questionnaire on a web page between June and November 2008. Visits/month with industry, samples, gifts, reimbursements and payments were used as dependant variables in the regression analyses. Year of medical license, specialty, work setting, time spent on direct care, articles read/month and being a resident's tutor were used as independent variables.
ResultsA total of 659 questionnaires were considered valid for the analysis. Overall, 87% (n=573) of the respondents reported they had received some benefit in the previous year and 90.1% (n=593) reported having held meetings with industry representatives monthly. Non-clinical specialists received fewer gifts (odds ratio [OR]=0.38; 95% confidence interval [95%CI]: 0.18-0.77), reimbursements (OR=0.14; 95%CI: 0.06-0.35) and payments (OR=0.30; 95%CI: 0.13-0.74) than their clinical colleagues. The probability of receiving reimbursements (OR=0.37; 95%CI: 0.15-0.89) and payments (OR=0.39; 95%CI: 0.20-0.77) was lower in primary care physicians.
ConclusionsThis study, performed in a sample of physicians from a southern European region, demonstrates differences in the intensity of the physician-industry relationship depending on physician specialty and work setting. These results provide important information for improving transparency and for future research on the appropriateness and efficiency of prescription in Spain and other countries with similar health systems.
Describir, en Aragón, la relación entre los médicos y la industria, y analizar las características de los médicos que se asocian con la probabilidad de recibir beneficios.
MétodosEstudio transversal en el cual médicos aragoneses del sector público y privado rellenaron un cuestionario anónimo en una página web, entre junio y noviembre de 2008. El número de visitas/mes con la industria, muestras, regalos, dietas y pagos se incluyeron como variables dependientes en los modelos de regresión. Las variables año de licenciatura, especialidad, lugar de trabajo, tiempo de atención, artículos leídos/mes y ser tutor de residentes se utilizaron como variables independientes.
ResultadosSe consideraron válidos 659 cuestionarios completados. En general, el 87% de los que respondieron contestaron que habían recibido algún beneficio en el último año, y un 90,1% (n=593) respondieron que habían tenido alguna entrevista con representantes de la industria mensualmente. Las especialidades no clínicas recibieron menos regalos (odds ratio [OR]=0,38; intervalo de confianza del 95% [IC95%]: 0,18-0,77), dietas (OR=0,14; IC95%: 0,06-0,35) y pagos (OR=0,30; IC95%: 0,13-0,74) que sus colegas clínicos. La probabilidad de recibir dietas (OR=0,37; IC95%: 0,15-0,89) y pagos (OR=0,39; IC95%: 0,20-0,77) fue menos probable para los médicos de atención primaria.
ConclusionesEste estudio muestra diferencias en la intensidad de la relación médico-industria en función de la especialidad y el lugar de trabajo del médico. Esta información se considera importante para mejorar la transparencia y para desarrollar investigaciones futuras sobre la adecuación y la eficiencia de la prescripción en nuestro país y en otros con sistemas sanitarios similares.
The drug sector represents 1.5% of the gross domestic product in Spain and directly employs approximately 40,000 people.1 Many studies report an increase of drug use and prescription in Spain, even though institutional surveys have shown little variation in use after security/safety alerts.2
Claims about drug use and its impact on the economy are common in the public agendas of developed countries. Populations are aging, and there is a clear increase in drug use in parallel with the age-related burden of disease.3 The medicalization of life is leading to increased spending on drugs and is endangering patients, as the risk-benefit ratio does not always justify the treatment, which is often unwarranted, ineffective and inefficient.4
Drug companies are one of the main sources of information for physicians, and evidence suggests that important bias and problems of veracity, as well as of accuracy, exist in the information they transmit.5,6
Several authors have discussed the influence of promotion on physicians’ prescription practices, referring to doctors’ underestimation of the power of this relationship on their decisions.7,8 Recently, the potential influence of industry activity has come under scrutiny, even reaching decision making institutions such as the World Health Organization whose management of the H1N1 epidemic may have been unduly influenced by the drug industry.9
Several authors have reported physician-industry relationships, such as Campbell et al10 in the USA, Saito et al11 in Japan, and Altisent et al12 in Spain. In addition, some attempts to fight the unlimited growth of drug consumption and expenditure, as well as to avoid “corruption” by pharmaceutical companies have been made.9,13,14 However, quantifying the industry-physician relationship remains important, especially in those health systems predominantly funded by public resources. In Spain, this relationship has only been analyzed in primary care.
This study aims to describe, for the first time, the relationship between the drug industry and physicians and to analyze the characteristics of physicians associated with the probability of receiving benefits from this industry in Aragon, a region of Spain. This report is part of a more general study that analyzed physicians’ opinions and attitudes to industry representatives’ knowledge of their prescribing patterns.15
MethodsWe performed an observational cross-sectional study in which doctors registered in the Aragon Health System, both in public and private practice, were invited to participate by e-mail or post.16 The study population consisted of 5,038 physicians registered in Aragon, a north-east Spanish region, at the beginning of 2008, and who had publicly accessible contact details. Electronic addresses were found for 3,439 participants while the remaining 1,599 were sent a letter by post. The study's protocol was approved by the Ethics and Clinical Investigation Committee of Aragon.
Physicians who agreed to participate filled in an anonymous, ad-hoc questionnaire available on a web page between June and November 2008. A second e-mail was sent as a reminder 2 months after the first invitation. Questionnaires were considered valid when at least 80% of the items were answered. As an incentive to participate, a prize was drawn for a laptop computer.
To ensure the reliability of the answers, each physician was personally invited to participate and, to avoid more than one questionnaire being completed by the same person, the prize was drawn only for those giving personal data.
Measurement toolA Spanish questionnaire was created based on Campbell's questionnaire referring to American physicians’ opinions and attitudes about the medical profession.10 After the validity study, the questionnaire was modified accordingly.16 The questionnaire consisted of four sections: a) professional history, b) professional attitudes, c) professional activities and behavior, and d) personal and professional characteristics. Only the analyses of sections a, c and d are shown.
Study outcomesTo elicit information on benefits, we asked “Have you ever received any of the following in the last year from drug, device or other medically related companies?”. The answer comprised 12 options, each with a yes/no response. Afterwards, four post-hoc categories of physician–industry relationships were created. The first category was free drug samples. The second category was gifts, which included restaurant invitations, free tickets to cultural or sporting events, and gifts given because of prescribing practices and non-medical learning activities. The third category was reimbursements for expenses, including the costs of travel, time, meals, lodging, or other personal expenses for attending meetings and free or subsidized admission to meetings, books or other material for continuing education. The fourth category consisted of payments for consulting, serving on a scientific advisory board or board of directors, speaking at a professional meeting, or enrolling patients in industry-sponsored studies.
To obtain information on the frequency of physician-industry meetings, the following question was used: “In an average month, how many times do you meet with representatives from drug, device, or other medically related companies?”.
All four benefits (samples, gifts, reimbursements and payments, as well as the frequency of meetings) were used as dependent variables for the analyses.
Study variablesMedical specialty and work setting were considered the most important physician characteristics and were included as independent variables for the analyses. Medical specialities were pooled into four categories: hospital medical specialities, surgical specialities (including anesthesiology, gynecology, ophthalmology, otorhinolaryngology, urology and orthopedics), general and primary care, and non-clinical specialities (preventive medicine, and other disciplines including specialty laboratories). Work setting was pooled into three categories: hospital, primary care and other settings (i.e. university, public health, administration).
The following items coded as categorical variables were selected on the basis of the available evidence suggesting their possible role in the physician-industry relationship and were used as confounding factors: age, sex, year of medical license, time spent in the direct provision of care, scientific articles read per month, tutoring a resident physician in the last 3 years, opinion on the physician-industry relationship elicited through the question “What is your opinion about the fact that industry representatives have access to data on the quantity and kinds of drug you prescribe?”.
Statistical analysesTo study the association of the benefits received from industry with physician profile/characteristics, the Chi-square test for categorical data and Student's t-tests for continuous variables were performed. To further study these associations, logistic regression models were applied, using each of the four benefits as dependant variables. In all models, both specialty and work setting were included as independent variables, controlling for the potential confounders listed above.
A negative binomial regression model was used to evaluate the association between the frequency of industry representative visits (meetings) with physician specialty and work setting, adjusted for the same covariates.
Odds ratios (OR) with 95% confidence intervals (95%IC) were calculated and the chosen overall significance level was 0.05 (alpha).
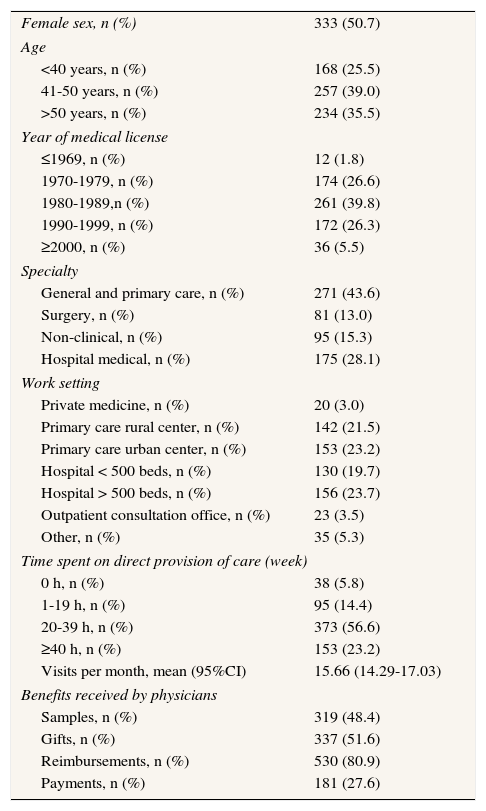
ResultsSix hundred and fifty nine questionnaires were considered valid for analysis (13.1%), when at least 80% of the questions were answered and less than 1% was discarded. The characteristics of the respondents are shown in Table 1.
Characteristics of physician respondents to the questionnaire, Aragon (Spain), 2008
| Female sex, n (%) | 333 (50.7) |
| Age | |
| <40 years, n (%) | 168 (25.5) |
| 41-50 years, n (%) | 257 (39.0) |
| >50 years, n (%) | 234 (35.5) |
| Year of medical license | |
| ≤1969, n (%) | 12 (1.8) |
| 1970-1979, n (%) | 174 (26.6) |
| 1980-1989,n (%) | 261 (39.8) |
| 1990-1999, n (%) | 172 (26.3) |
| ≥2000, n (%) | 36 (5.5) |
| Specialty | |
| General and primary care, n (%) | 271 (43.6) |
| Surgery, n (%) | 81 (13.0) |
| Non-clinical, n (%) | 95 (15.3) |
| Hospital medical, n (%) | 175 (28.1) |
| Work setting | |
| Private medicine, n (%) | 20 (3.0) |
| Primary care rural center, n (%) | 142 (21.5) |
| Primary care urban center, n (%) | 153 (23.2) |
| Hospital < 500 beds, n (%) | 130 (19.7) |
| Hospital > 500 beds, n (%) | 156 (23.7) |
| Outpatient consultation office, n (%) | 23 (3.5) |
| Other, n (%) | 35 (5.3) |
| Time spent on direct provision of care (week) | |
| 0 h, n (%) | 38 (5.8) |
| 1-19 h, n (%) | 95 (14.4) |
| 20-39 h, n (%) | 373 (56.6) |
| ≥40 h, n (%) | 153 (23.2) |
| Visits per month, mean (95%CI) | 15.66 (14.29-17.03) |
| Benefits received by physicians | |
| Samples, n (%) | 319 (48.4) |
| Gifts, n (%) | 337 (51.6) |
| Reimbursements, n (%) | 530 (80.9) |
| Payments, n (%) | 181 (27.6) |
Globally, 87% (n=573) reported having received some kind of benefit from industry during the previous year, and 90.1% (n=593) reported having had some meeting with industry representatives monthly. When asked about their opinion of industry representatives having access to personal data on the quantity and kinds of drug prescribed, 58.6% of physicians reported a negative response and 35.6% were indifferent.
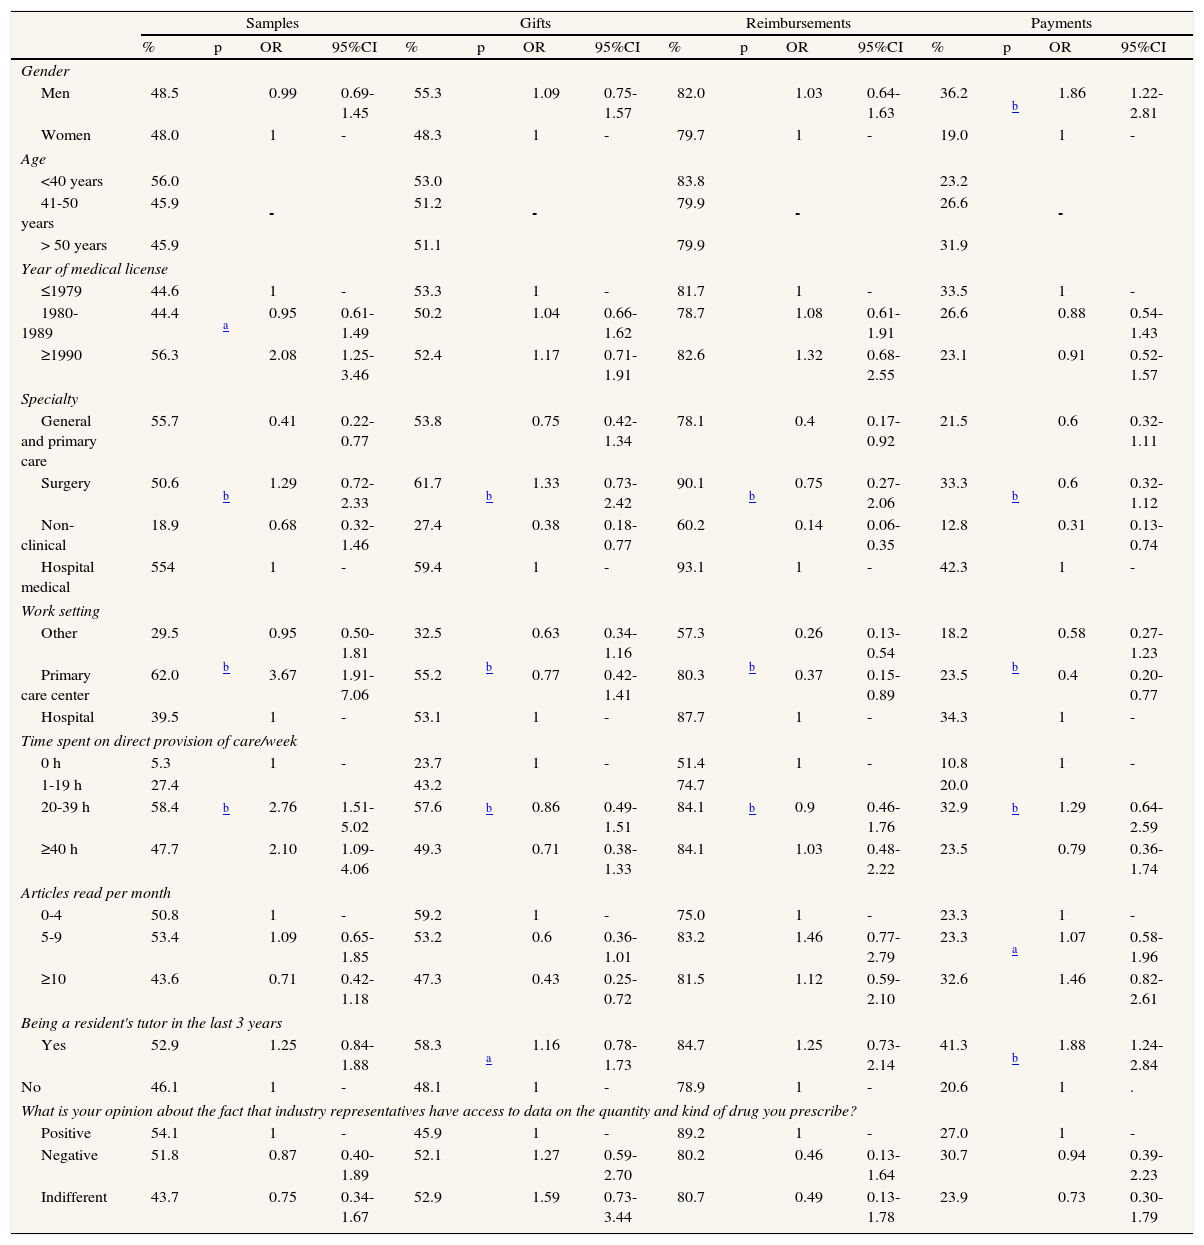
Our results indicate that the physician profile which most likely receives industry benefits corresponds to a young man, with a medical specialty, working in a hospital, spending 20-39hours/week on direct provision of care, who reads fewer than 10 articles per month and who has been a resident's tutor in the last 3 years (Table 2).
Physician characteristics according to the benefit received, Aragon (Spain), 2008
| Samples | Gifts | Reimbursements | Payments | |||||||||||||
| % | p | OR | 95%CI | % | p | OR | 95%CI | % | p | OR | 95%CI | % | p | OR | 95%CI | |
| Gender | ||||||||||||||||
| Men | 48.5 | 0.99 | 0.69-1.45 | 55.3 | 1.09 | 0.75-1.57 | 82.0 | 1.03 | 0.64-1.63 | 36.2 | b | 1.86 | 1.22-2.81 | |||
| Women | 48.0 | 1 | - | 48.3 | 1 | - | 79.7 | 1 | - | 19.0 | 1 | - | ||||
| Age | ||||||||||||||||
| <40 years | 56.0 | - | 53.0 | - | 83.8 | - | 23.2 | - | ||||||||
| 41-50 years | 45.9 | 51.2 | 79.9 | 26.6 | ||||||||||||
| > 50 years | 45.9 | 51.1 | 79.9 | 31.9 | ||||||||||||
| Year of medical license | ||||||||||||||||
| ≤1979 | 44.6 | a | 1 | - | 53.3 | 1 | - | 81.7 | 1 | - | 33.5 | 1 | - | |||
| 1980-1989 | 44.4 | 0.95 | 0.61-1.49 | 50.2 | 1.04 | 0.66-1.62 | 78.7 | 1.08 | 0.61-1.91 | 26.6 | 0.88 | 0.54-1.43 | ||||
| ≥1990 | 56.3 | 2.08 | 1.25-3.46 | 52.4 | 1.17 | 0.71-1.91 | 82.6 | 1.32 | 0.68-2.55 | 23.1 | 0.91 | 0.52-1.57 | ||||
| Specialty | ||||||||||||||||
| General and primary care | 55.7 | b | 0.41 | 0.22-0.77 | 53.8 | b | 0.75 | 0.42-1.34 | 78.1 | b | 0.4 | 0.17-0.92 | 21.5 | b | 0.6 | 0.32-1.11 |
| Surgery | 50.6 | 1.29 | 0.72-2.33 | 61.7 | 1.33 | 0.73-2.42 | 90.1 | 0.75 | 0.27-2.06 | 33.3 | 0.6 | 0.32-1.12 | ||||
| Non-clinical | 18.9 | 0.68 | 0.32-1.46 | 27.4 | 0.38 | 0.18-0.77 | 60.2 | 0.14 | 0.06-0.35 | 12.8 | 0.31 | 0.13-0.74 | ||||
| Hospital medical | 554 | 1 | - | 59.4 | 1 | - | 93.1 | 1 | - | 42.3 | 1 | - | ||||
| Work setting | ||||||||||||||||
| Other | 29.5 | b | 0.95 | 0.50-1.81 | 32.5 | b | 0.63 | 0.34-1.16 | 57.3 | b | 0.26 | 0.13-0.54 | 18.2 | b | 0.58 | 0.27-1.23 |
| Primary care center | 62.0 | 3.67 | 1.91-7.06 | 55.2 | 0.77 | 0.42-1.41 | 80.3 | 0.37 | 0.15-0.89 | 23.5 | 0.4 | 0.20-0.77 | ||||
| Hospital | 39.5 | 1 | - | 53.1 | 1 | - | 87.7 | 1 | - | 34.3 | 1 | - | ||||
| Time spent on direct provision of care/week | ||||||||||||||||
| 0 h | 5.3 | b | 1 | - | 23.7 | b | 1 | - | 51.4 | b | 1 | - | 10.8 | b | 1 | - |
| 1-19 h | 27.4 | 43.2 | 74.7 | 20.0 | ||||||||||||
| 20-39 h | 58.4 | 2.76 | 1.51-5.02 | 57.6 | 0.86 | 0.49-1.51 | 84.1 | 0.9 | 0.46-1.76 | 32.9 | 1.29 | 0.64-2.59 | ||||
| ≥40 h | 47.7 | 2.10 | 1.09-4.06 | 49.3 | 0.71 | 0.38-1.33 | 84.1 | 1.03 | 0.48-2.22 | 23.5 | 0.79 | 0.36-1.74 | ||||
| Articles read per month | ||||||||||||||||
| 0-4 | 50.8 | 1 | - | 59.2 | 1 | - | 75.0 | 1 | - | 23.3 | a | 1 | - | |||
| 5-9 | 53.4 | 1.09 | 0.65-1.85 | 53.2 | 0.6 | 0.36-1.01 | 83.2 | 1.46 | 0.77-2.79 | 23.3 | 1.07 | 0.58-1.96 | ||||
| ≥10 | 43.6 | 0.71 | 0.42-1.18 | 47.3 | 0.43 | 0.25-0.72 | 81.5 | 1.12 | 0.59-2.10 | 32.6 | 1.46 | 0.82-2.61 | ||||
| Being a resident's tutor in the last 3 years | ||||||||||||||||
| Yes | 52.9 | 1.25 | 0.84-1.88 | 58.3 | a | 1.16 | 0.78-1.73 | 84.7 | 1.25 | 0.73-2.14 | 41.3 | b | 1.88 | 1.24-2.84 | ||
| No | 46.1 | 1 | - | 48.1 | 1 | - | 78.9 | 1 | - | 20.6 | 1 | . | ||||
| What is your opinion about the fact that industry representatives have access to data on the quantity and kind of drug you prescribe? | ||||||||||||||||
| Positive | 54.1 | 1 | - | 45.9 | 1 | - | 89.2 | 1 | - | 27.0 | 1 | - | ||||
| Negative | 51.8 | 0.87 | 0.40-1.89 | 52.1 | 1.27 | 0.59-2.70 | 80.2 | 0.46 | 0.13-1.64 | 30.7 | 0.94 | 0.39-2.23 | ||||
| Indifferent | 43.7 | 0.75 | 0.34-1.67 | 52.9 | 1.59 | 0.73-3.44 | 80.7 | 0.49 | 0.13-1.78 | 23.9 | 0.73 | 0.30-1.79 | ||||
OR: odds ratio; 95%CI: 95% confidence interval.
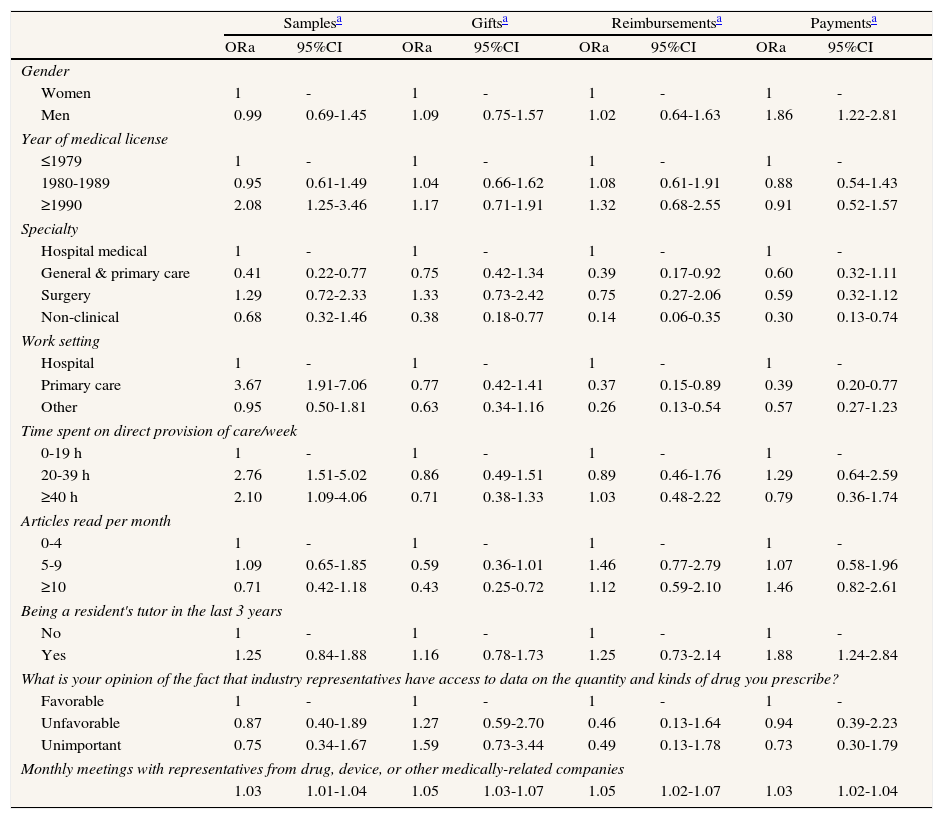
Table 3 shows the probability of receiving each benefit according to physician characteristics. Overall, hospital medical specialities were more likely to receive benefits from industry. Non-clinical specialists received fewer gifts (OR=0.38; 95%CI: 0.18-0.77), reimbursements (OR=0.14; 95%CI: 0.06-0.35) and payments (OR=0.30; 95%CI: 0.13-0.74) than their clinical colleagues. To eliminate an erroneous interpretation, a secondary analysis was re-run without the non-clinical specialty, and no substantial modifications in the results were observed.
Type of benefit according to physician characteristics, Aragon (Spain), 2008 (logistic regression model)
| Samplesa | Giftsa | Reimbursementsa | Paymentsa | |||||
| ORa | 95%CI | ORa | 95%CI | ORa | 95%CI | ORa | 95%CI | |
| Gender | ||||||||
| Women | 1 | - | 1 | - | 1 | - | 1 | - |
| Men | 0.99 | 0.69-1.45 | 1.09 | 0.75-1.57 | 1.02 | 0.64-1.63 | 1.86 | 1.22-2.81 |
| Year of medical license | ||||||||
| ≤1979 | 1 | - | 1 | - | 1 | - | 1 | - |
| 1980-1989 | 0.95 | 0.61-1.49 | 1.04 | 0.66-1.62 | 1.08 | 0.61-1.91 | 0.88 | 0.54-1.43 |
| ≥1990 | 2.08 | 1.25-3.46 | 1.17 | 0.71-1.91 | 1.32 | 0.68-2.55 | 0.91 | 0.52-1.57 |
| Specialty | ||||||||
| Hospital medical | 1 | - | 1 | - | 1 | - | 1 | - |
| General & primary care | 0.41 | 0.22-0.77 | 0.75 | 0.42-1.34 | 0.39 | 0.17-0.92 | 0.60 | 0.32-1.11 |
| Surgery | 1.29 | 0.72-2.33 | 1.33 | 0.73-2.42 | 0.75 | 0.27-2.06 | 0.59 | 0.32-1.12 |
| Non-clinical | 0.68 | 0.32-1.46 | 0.38 | 0.18-0.77 | 0.14 | 0.06-0.35 | 0.30 | 0.13-0.74 |
| Work setting | ||||||||
| Hospital | 1 | - | 1 | - | 1 | - | 1 | - |
| Primary care | 3.67 | 1.91-7.06 | 0.77 | 0.42-1.41 | 0.37 | 0.15-0.89 | 0.39 | 0.20-0.77 |
| Other | 0.95 | 0.50-1.81 | 0.63 | 0.34-1.16 | 0.26 | 0.13-0.54 | 0.57 | 0.27-1.23 |
| Time spent on direct provision of care/week | ||||||||
| 0-19 h | 1 | - | 1 | - | 1 | - | 1 | - |
| 20-39 h | 2.76 | 1.51-5.02 | 0.86 | 0.49-1.51 | 0.89 | 0.46-1.76 | 1.29 | 0.64-2.59 |
| ≥40 h | 2.10 | 1.09-4.06 | 0.71 | 0.38-1.33 | 1.03 | 0.48-2.22 | 0.79 | 0.36-1.74 |
| Articles read per month | ||||||||
| 0-4 | 1 | - | 1 | - | 1 | - | 1 | - |
| 5-9 | 1.09 | 0.65-1.85 | 0.59 | 0.36-1.01 | 1.46 | 0.77-2.79 | 1.07 | 0.58-1.96 |
| ≥10 | 0.71 | 0.42-1.18 | 0.43 | 0.25-0.72 | 1.12 | 0.59-2.10 | 1.46 | 0.82-2.61 |
| Being a resident's tutor in the last 3 years | ||||||||
| No | 1 | - | 1 | - | 1 | - | 1 | - |
| Yes | 1.25 | 0.84-1.88 | 1.16 | 0.78-1.73 | 1.25 | 0.73-2.14 | 1.88 | 1.24-2.84 |
| What is your opinion of the fact that industry representatives have access to data on the quantity and kinds of drug you prescribe? | ||||||||
| Favorable | 1 | - | 1 | - | 1 | - | 1 | - |
| Unfavorable | 0.87 | 0.40-1.89 | 1.27 | 0.59-2.70 | 0.46 | 0.13-1.64 | 0.94 | 0.39-2.23 |
| Unimportant | 0.75 | 0.34-1.67 | 1.59 | 0.73-3.44 | 0.49 | 0.13-1.78 | 0.73 | 0.30-1.79 |
| Monthly meetings with representatives from drug, device, or other medically-related companies | ||||||||
| 1.03 | 1.01-1.04 | 1.05 | 1.03-1.07 | 1.05 | 1.02-1.07 | 1.03 | 1.02-1.04 | |
ORa: adjusted odds ratio; 95%CI: 95% confidence interval.
Samples were three times more likely to be given in primary care settings than in the hospital setting (OR=3.67; 95%CI: 1.91-7.06). The probability of receiving gifts was directly associated with the number of meetings between physicians and industry (OR=1.05; 95%CI: 1.03-1.07) and was inversely associated with the number of articles read per month (OR=0.43; 95%CI: 0.25-0.72). Both reimbursements and payments were associated with the number of meetings between physicians and industry (OR=1.05; 95%CI: 1.02-1.07; OR=1.03; 95%CI: 1.02-1.04); and in both, compared with hospitals, primary care settings were less likely to receive these benefits (OR=0.37; 95%CI: 0.15-0.89; OR=0.39; 95%CI: 0.20-0.77).
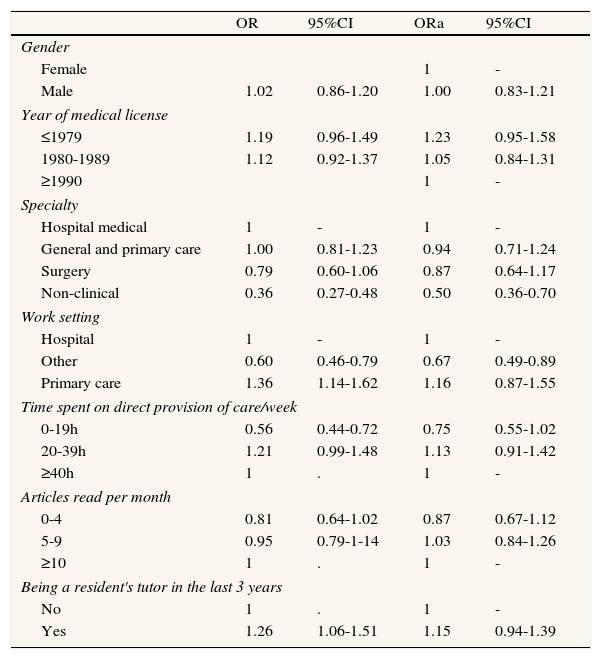
The mean number of representative visits showed statistically significant differences between physicians who reported receiving samples and those who reported not receiving samples (20.6 vs 10.94; p=0.000), gifts (20.96 vs 9.90; p=0.000), reimbursements (17.43 vs 8.33; p=0.000) and payments (23.25 vs 12.79; p=0.000). Compared with medical hospital specialities, non-clinical specialists met significantly less frequently with industry representatives (Table 4).
Number of visits from representatives per month, according to physician characteristics, in Aragon (Spain), 2008 (negative binomial regression model).
| OR | 95%CI | ORa | 95%CI | |
| Gender | ||||
| Female | 1 | - | ||
| Male | 1.02 | 0.86-1.20 | 1.00 | 0.83-1.21 |
| Year of medical license | ||||
| ≤1979 | 1.19 | 0.96-1.49 | 1.23 | 0.95-1.58 |
| 1980-1989 | 1.12 | 0.92-1.37 | 1.05 | 0.84-1.31 |
| ≥1990 | 1 | - | ||
| Specialty | ||||
| Hospital medical | 1 | - | 1 | - |
| General and primary care | 1.00 | 0.81-1.23 | 0.94 | 0.71-1.24 |
| Surgery | 0.79 | 0.60-1.06 | 0.87 | 0.64-1.17 |
| Non-clinical | 0.36 | 0.27-0.48 | 0.50 | 0.36-0.70 |
| Work setting | ||||
| Hospital | 1 | - | 1 | - |
| Other | 0.60 | 0.46-0.79 | 0.67 | 0.49-0.89 |
| Primary care | 1.36 | 1.14-1.62 | 1.16 | 0.87-1.55 |
| Time spent on direct provision of care/week | ||||
| 0-19h | 0.56 | 0.44-0.72 | 0.75 | 0.55-1.02 |
| 20-39h | 1.21 | 0.99-1.48 | 1.13 | 0.91-1.42 |
| ≥40h | 1 | . | 1 | - |
| Articles read per month | ||||
| 0-4 | 0.81 | 0.64-1.02 | 0.87 | 0.67-1.12 |
| 5-9 | 0.95 | 0.79-1-14 | 1.03 | 0.84-1.26 |
| ≥10 | 1 | . | 1 | - |
| Being a resident's tutor in the last 3 years | ||||
| No | 1 | . | 1 | - |
| Yes | 1.26 | 1.06-1.51 | 1.15 | 0.94-1.39 |
OR: odds ratio; ORa: adjusted odds ratio; 95%CI: 95% confidence interval.
This study shows that relationships between industry and physicians do exist and that they are related to specialty and work setting.
Our findings agree with those of previous studies.8,10,11,17 We replicate the findings of a previous study reporting that payments for services were more frequent for men than for women and explain this in terms of the possible effects of physician gender on medical practice.18 Our data also support the idea that the more years of practice, the fewer gifts the physician receives, previously documented in the American and Japanese studies.10,11
The influence of specialty has previously been reported by Campbell et al.10 We observed a tendency of surgical and medical hospital specialities to have more representative visits and to more frequently receive benefits from industry than primary care and non-clinical. The comparison might be limited because the sample analyzed in the present study included non-clinical specialists; however, the secondary analyses without that category contradicts this argument. Therefore, we may conclude that medical specialty is an indicator of the relationship and we provide suggestions for probable context differences among countries.
As found by previous studies,10,17 we found differences between hospital and primary care but the implications differ since Spanish medical care is mainly public and few physicians develop their practice exclusively in private services, as might be the case in the USA. In Spain, primary care physicians were more likely to receive samples but were less likely to be given reimbursements and payments than professionals in hospitals. This finding might be due to the specific Spanish context. Physicians working in hospitals probably attract industry more, as private medical settings often have hospital medical or surgical specialists who work partly in the public sector but very rarely professionals working in public primary care. The peculiarities of the Japanese health system hamper the comparison as primary care does not exist in that country. Saito et al11 used the workplace variable, hospital versus office, and found no significant associations.
The assumption that the more a physician prescribes, the greater the probability of a relationship with the pharmaceutical industry may help to explain why, in our data, non-clinical specialists were less likely to receive gifts, payments or expenses from industry.19 In this sense, “big ticket” prescribers are probably more likely to benefit from industry perks and, therefore, present clear conflicts of interest.20
The variable of time spent on direct care determined only the probability of receiving samples while no statistically significant differences were found in relation to other kinds of benefit. In addition, primary care physicians in Spain do not spend less time on direct care and/or prescribe less than medical hospital specialists. Time spent on direct care, as well as other explanations found in the literature such as the patients’ age, would fail to explain our finding that medical hospital specialists received more benefits.21 A better explanation could be that hospital medical-surgical specialists in Spain frequently work in both the public and private settings.
The inclusion of all kinds of specialists and all kinds of work settings is original and adds strength to our findings, since it allows us to observe that the influence of industry is not limited to prescribers. We found that at least 5.7% of the physicians developed some activity not directly related to the provision of care; 87% of the sample reported having received some benefit from industry in the last year and 90.1% reported having met with representatives various times monthly. The implications of this finding should be highlighted since, reinforcing previous results,19,22,23 education, management, decision making and research might be influenced by the pharmaceutical industry.
The number of articles read per month could be an important indicator of physicians’ attitude and professionalism. The inverse association with the probability of receiving gifts observed in the present study might correspond to a more evidence-based clinical practice.
The present study has some limitations. The literature suggests the effects of “social desirability” in surveys such as ours. However, this study consisted of an anonymous questionnaire and we believe this bias was minimized when questions were asked on practice behavior and opinions. Although the response rate of less than 60% limits the study's validity, low response rates were also obtained in other studies in the literature on the same subject.11 The low response rate and participants’ anonymity hampers generalization of the results.
An important consideration relates to the fourth category of benefits. Although benefits can determine drug prescription, payments might be assumed to be a different relationship between physicians with industry and to have a closer connection with scientific considerations. Future research might include benefits as a specific outcome variable.
Importantly, although physicians answered questions related not only to drug companies but also to other medically related companies, we have presumed that relationships with industry were mostly focused on drugs and thus our interpretations of results refer to pharmaceutical corporations.
More detailed information on working hours, patient characteristics, prescribing behavior and volume should be included in future research, and the policies of hospitals and clinics on physician-industry relationships should be analyzed in our setting, as has been studied elsewhere.24,25
The data presented herein are innovative and useful for decision making in our region and, perhaps, in other regions and countries with similar health systems. Our results are coherent with previous findings; the role of industry and the response of the medical profession seem to be similar in our region and in the USA. However, the implications differ, given the specific characteristics of the two health systems. In Spain, drug costs are shouldered mostly by the public healthcare system, which means that government authorities should make greater efforts to control drug expenditure through medical education or management policies. Recent health reforms in Spain have focused on drugs and new activities such as providing physicians with advice on the rational use of drugs and studying prescription habits, which may pose organizational challenges.26 The data presented herein support the idea of including the study of drug-industry relationships. The different intensity found in physician-industry relationships depending on the physician's specialty and work setting provides important information for future research on the appropriateness and efficiency of prescription and for improving the transparency of the physician-industry relationship, especially in public healthcare systems.27,28
Evidence suggests that drug industry promotion influences physician prescribing in countries such as the USA. It is important to quantify industry-physician relationships in the Spanish health system, predominantly funded by public resources, and to analyze the characteristics of physicians associated with a higher probability of receiving benefits from industry in a southern European country.
What does this study add to the literature?This study demonstrates, for the first time, the extent of the relationship between industry and physicians in distinct specialties, in a southern European country and describes the characteristics of those more likely to receive benefits from industry. The results obtained could be useful for policy and healthcare decision makers, especially those in public healthcare systems, and highlight the need for future research on the appropriateness and efficiency of prescription.
E. Lobo participated in the analysis and interpretation of the data and was involved in the drafting of the manuscript and its final approval. M.J. Rabanaque contributed to the conception and design of the study, helped to review the manuscript and approved the final version to be published. P. Carrera participated in data acquisition and analysis, helped to draft the manuscript and approved the final version. J.M. Abad participated in data interpretation, in critically revising the manuscript and approved the final version. J. Moliner made substantial contributions to the conception and design of the study, data acquisition and the interpretation of the results, helped to revise the manuscript and approved the final version for publication.
FundingThis study received grant support from the Instituto Aragonés de Ciencias de la Salud of Zaragoza (Spain), Reference Number “PIURM07/13”.
Conflicts of interestNone.


