


The 1st International Conference on Safety and Public Health
Más datosThis study wants to evaluate heavy metals pollution and ecological risk level of well water in Pangkajene watershed area.
MethodsThe total concentration of Cd, Cr(VI), Pb and Ni were determined using AAS. We used heavy metal pollution index (HPI), metal index (MI), hazard quotient (HQ) used to estimate metals pollution and ecological risk level. Pearson correlation analysis is executed to evaluate the relationship between all measured parameters.
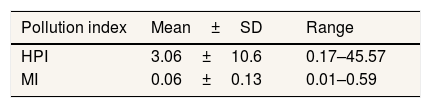
ResultThe concentration of Cd, Ni and Pb are below detection limit value. The mean concentration of Cr(VI) 0.0017±0.0006mgL−1. The mean of HPI and MI value are 3.06 and 0.06, respectively. The upstream area of Pangkajene has HQ value for Cr(VI) is higher than 1, it indicates that exposure of Cr(VI) may cause adverse effects to the ecological system and human health.
ConclusionThe Cr(VI) is the main risk factor for well water contamination surrounds Pangkajene watershed area.
Maros and Pangkajene regency have the second beautiful karst area in the world. Whereas, karst areas are vulnerable to an environmental problem than any other areas.1,2 It may cause by special hydrogeological properties of karst areas.3 Human activities may discharge many pollutants to the environment such as organic and inorganic pollutants (heavy metals). Pollutants are not only come from anthropogenic activities but also it may come from natural phenomena.
The high concentration of heavy metals in aquatic habitat is not only affected by the aquatic organism but it may affect to the quality of human life. High exposure of hexavalent chromium (Cr(VI)) from drinking water is related to carcinogenic effects.4 The cancer formulation caused by chromium exposures is related to activating MAPK which enhances proliferation cell.5 At low doses 0.3–520mg.L−1 in drinking water it may enhance DNA damaging at mice.6 The lead (Pb) may accumulate in bones and cause central nervous system disorders.7 Cd, Pb, and Ni are also classified as carcinogenic metals.5,8 This present study aims to assess heavy metals pollution and the ecological risk level of well water in Pangkajene watershed area.
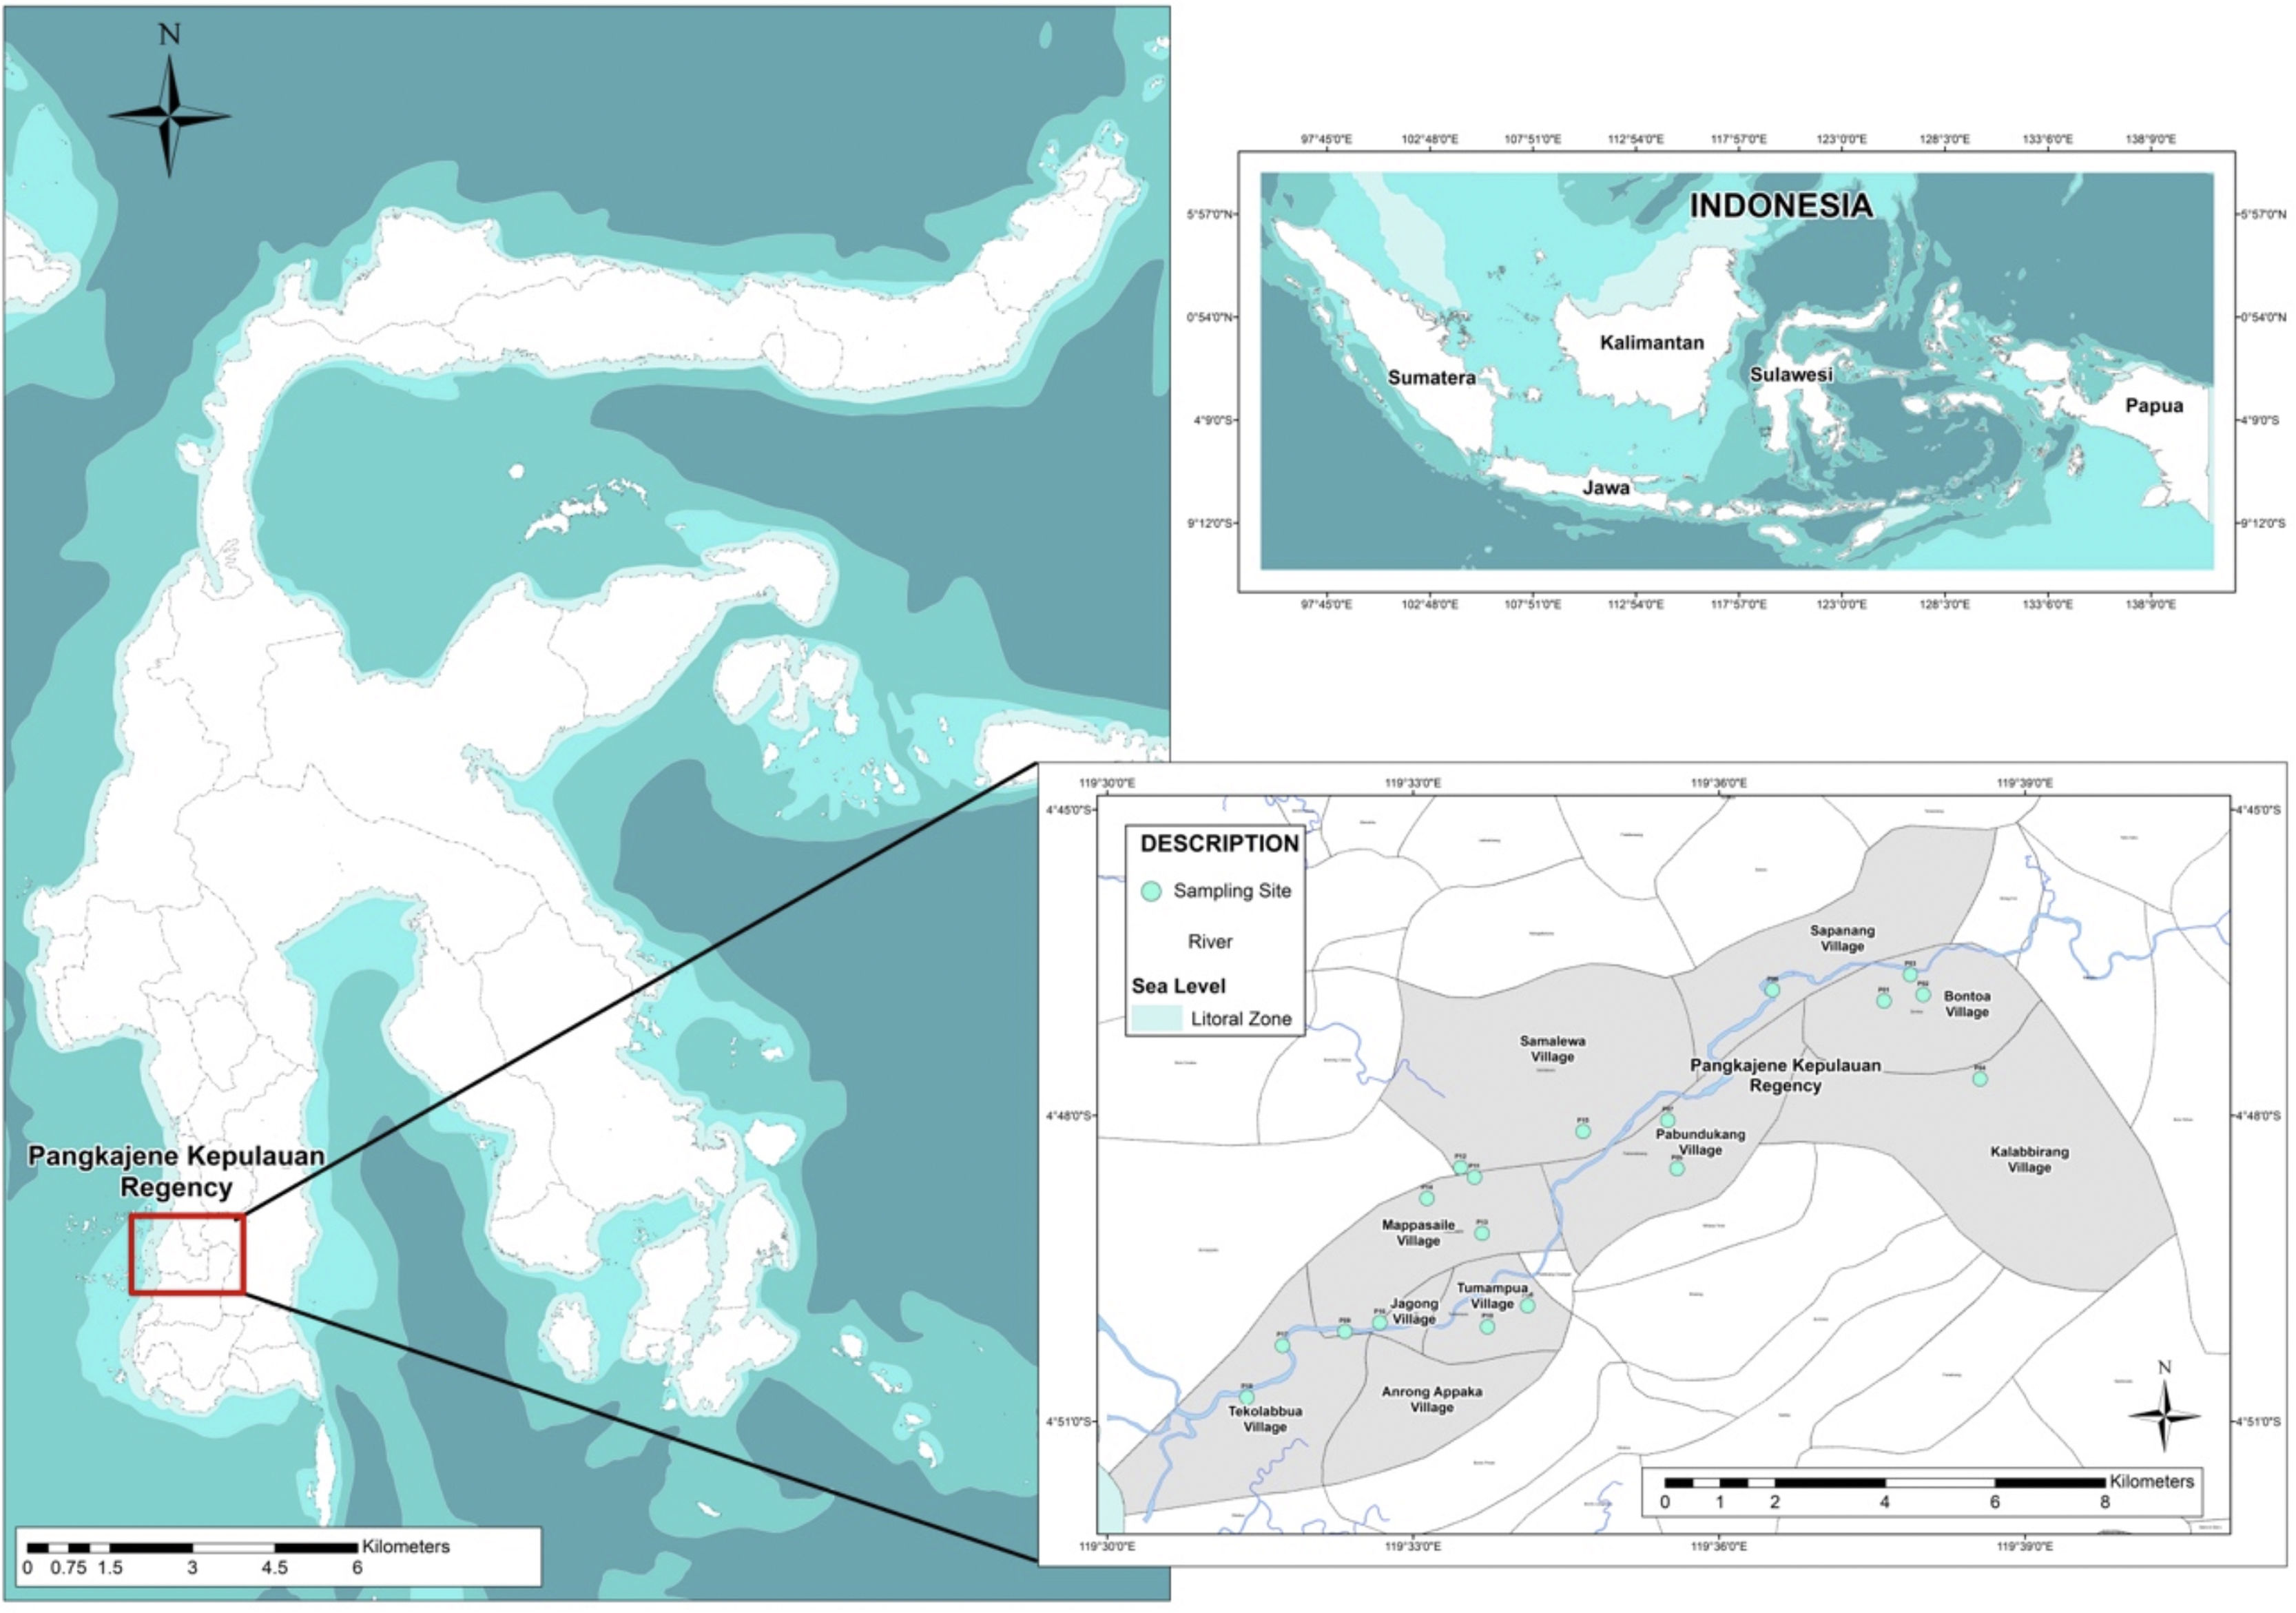
MethodsSampling proceduresThis study focused on the assessment of heavy metal contamination and the estimation of ecological risk related to heavy metal contamination in well water surrounds Pangkajene watershed area. A total number of 18 shallow well water samples distributing from the upstream area to the downstream area of Pangkajene river (Bungoro, Minasatene, and Pangkajene sub-district) were collected using 500ml HDPE bottle and following standard procedures (Fig. 1). Showed the location of sampling sites. Temperature, pH, total dissolved solids (TDS) and electrical conductivity (EC) were directly determined in the sampling field. Temperature was determined using a thermometer. pH, TDS and EC were determined by digital electrode meter. All samples were stored at a cool box with cubed ice.
Sample analysis
Heavy metals in water samples were determined using Indonesian Standard Procedures for Heavy metals Analysis (SNI 6989,16:2009 for Cd; SNI 6989.71:2009 for Cr(VI); SNI 06-6989.8-2009 for Pb; and SNI 6989.18:2009 for Ni). All samples were digested using 5ml of HNO3 and then filtered the solution using filter paper. We used flame atomic absorption spectrophotometry (F-AAS, PerkinElmer, pinAAcle 900H) to determine the total concentration of metals. To assure quality of measurement in the laboratory, three blank samples and U.S NIST reference material 1646a estuary sediment were used.
Assessment methodsHeavy metal pollution assessmentTo evaluate the total water quality relating to the heavy metal contamination in the water column, we used heavy metal pollution index (HPI). The equation to calculate HPI include three steps are9,10:
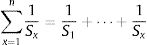
The calculation of weightage parameter

Where W is the unit weightage of each measured heavy metal and S stands for MAC value for specific heavy metal, while k is the constant. We can calculate proportional constant (K) using this equation11:

The estimation of quality grading for each of heavy metal
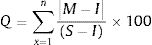
This expression is used to determine individual quality of heavy metal where Q is single heavy metal sub-index, M is the each measured heavy metal, I means ideal value of each heavy metal and S is standard or permissible limit value of heavy metals in water. 100 is critical pollution index which means it has potential harm to organisms.
The total of sub-indices in the whole index
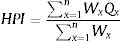
Where, Q is single heavy metal sub-index, W is the unit weightage for single heavy metal. We used WHO standard for heavy metal in drinking water for S value. The values used in this study presented in Table 1.
Adopted standard for calculated indices.
| Heavy Metal | Wx | MAC (mg.L−1) |
|---|---|---|
| Cd | 0.71 | 0.003 |
| Cr | 0.04 | 0.05 |
| Pb | 0.21 | 0.01 |
| Ni | 0.03 | 0.07 |
Reference: 11–13.
Metal index used to evaluate possible summation of heavy metals on public health that help to quickly estimate the overall quality of drinking water.9 The calculation for metal index:
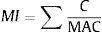
Where C is the average concentration of single heavy metal, while MAC is maximum allowable concentration of specific heavy metal. The MI value >1 is a warning sign. This index is suitable for assessing quality of drinking water.10
Ecological risk indexThe ecological risk was estimated by Hazard Quotient (HQ) equation. The HQ is calculated by comparing the concentration of pollutant to screening benchmark value, according to the following expression:

Where C is a concentration of heavy metals and SB stands for screening benchmark value. Assuming that the HQ value >1, it indicates the concentration may generate adverse risk to the environment. We adopted standard drinking water value by California Environmental Protection Agency as a screening benchmark value for Cr(VI). This value is 2ppb or 0.002mg.L−1.14 Whereas, the screening benchmarks for Pb comes from WHO drinking water guideline as much as 10μg/L or 0.01mg.L−1.13
Statistical analysisAll mathematical and statistical calculations were carried out using Microsoft Excel and SPSS version 24.0. Pearson correlation analysis is also used in the present study to examine the relationship between all of water quality parameters. We also used kriging interpolation as geostatistical analysis to describe the distribution of HQ well water.
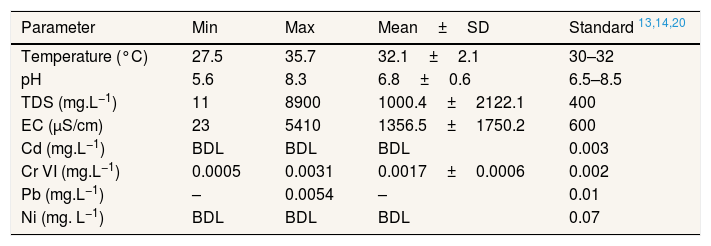
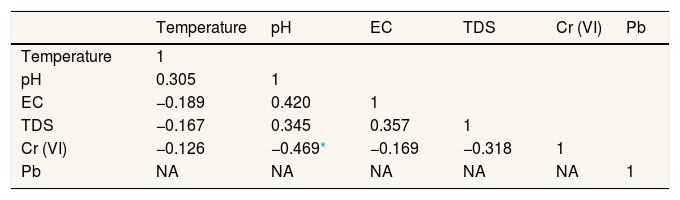
Result and discussionPhysicochemical properties of well waterTable 2 presented the physicochemical properties of well water in Pangkajene watershed area. pH value is an important parameter of water quality and the contamination level in the watershed area. This study revealed that the pH value of well water was varied from 5.6 to 8.3 with a mean value of 6.8. Several well water samples are not within the permissible limit prescribed by WHO's standard for drinking water. Mostly, well water which has acidic properties is located in the upstream area of the Pangkajene river (industrial and agricultural area). Low pH (lower than 6.5) value is most likely to have increased adverse environmental effects. From Table 3, pH and concentration of Cr(VI) in the water column has a negative correlation. It indicates that acidic water will increase the concentration of Cr(VI). These results are in line with a prior study by Izbicki et al., (2015) which mentioned that adsorption of Cr(VI) will decrease when pH value increases15.
Physicochemical properties of well water.
| Parameter | Min | Max | Mean±SD | Standard 13,14,20 |
|---|---|---|---|---|
| Temperature (°C) | 27.5 | 35.7 | 32.1±2.1 | 30–32 |
| pH | 5.6 | 8.3 | 6.8±0.6 | 6.5–8.5 |
| TDS (mg.L−1) | 11 | 8900 | 1000.4±2122.1 | 400 |
| EC (μS/cm) | 23 | 5410 | 1356.5±1750.2 | 600 |
| Cd (mg.L−1) | BDL | BDL | BDL | 0.003 |
| Cr VI (mg.L−1) | 0.0005 | 0.0031 | 0.0017±0.0006 | 0.002 |
| Pb (mg.L−1) | – | 0.0054 | – | 0.01 |
| Ni (mg. L−1) | BDL | BDL | BDL | 0.07 |
BDL: below detection limit.
Sources: Primary Data, 202013,14,20;
Pearson correlation matrix for physicochemical properties of well water in study sites.
| Temperature | pH | EC | TDS | Cr (VI) | Pb | |
|---|---|---|---|---|---|---|
| Temperature | 1 | |||||
| pH | 0.305 | 1 | ||||
| EC | −0.189 | 0.420 | 1 | |||
| TDS | −0.167 | 0.345 | 0.357 | 1 | ||
| Cr (VI) | −0.126 | −0.469* | −0.169 | −0.318 | 1 | |
| Pb | NA | NA | NA | NA | NA | 1 |
NA: not applicable due to below detection limit.
TDS is one of the importance of water quality. Water which has a higher value of TDS indicates that the water is highly mineralized. Based on the WHO guidelines for drinking water, water with low TDS value (400mg.L−1) is acknowledged to be good for drinking water and becomes significantly unpalatable at TDS value is higher than 1000mg.L−1. The mean TDS value of well water in the study area is higher than the WHO guidelines value. The high value of TDS is not harmful to human health. The mean value of EC indicated that well water in this study area was considered ionized and has a higher level of ionic concentration activity. Based on the classification of EC and TDS for water,16,17 the well water of study sites mostly in the permissible level as drinking water.
Mostly, Cd, Ni and Pb concentration in the well water are below detection limit value. Pangkajene regency is known as Karst area in South Sulawesi Province, Indonesia. The transportation of metals in groundwater may influence by hydrogeological and geochemistry properties of karst area.1,2,18,19 In karstic system, there is a higher activity of carbon dioxide causing carbonates to be limiting the insoluble phase. The precipitation of hydroxide or carbonate phase will inhibit the concentration of metal ions in karstic water to low values.18 The other reasons are pollutants will transport rapidly and metals can adsorb onto clays, organic material, iron, and manganese oxides and particulates in water. Karst aquifer has anisotropic permeability structure which may adsorb substance easily onto the aquifer. Moreover, increasing pollutant concentrations in aquifer cause by large groundwater velocity of karst areas than other lands.1,2,19 Compared to other studies, the concentration of Cr(VI) in this study is lower than study conducted by Shang et al. (2020) which has a range concentration of 0.006–0.09.
Estimation of heavy metals contaminationHeavy metal pollution index (HPI) and metal index (MI) are an effective and important method to evaluate the quality of water related to heavy metals contamination. If the HPI value is more than 100, water cannot be used for drinking purpose.21,22 From the classification of HPI value by Shankar (2019), well water surrounds Pangkajene area is low polluted by heavy metal or has excellent quality. The highest value of HPI (45.57) is located in the upstream area of the Pangkajene river. This area is likely affected by agriculture, mining, and industrial activities. The metal index (MI) is the method to rate the quality of drinking water considering the additive effect on human health. It has a critical limit value of MI >1.22 The mean value of MI infers that well water surrounds Pangkajene watershed area categorized as very pure water and hence it suitable for agricultural and domestic purposes (Table 4).
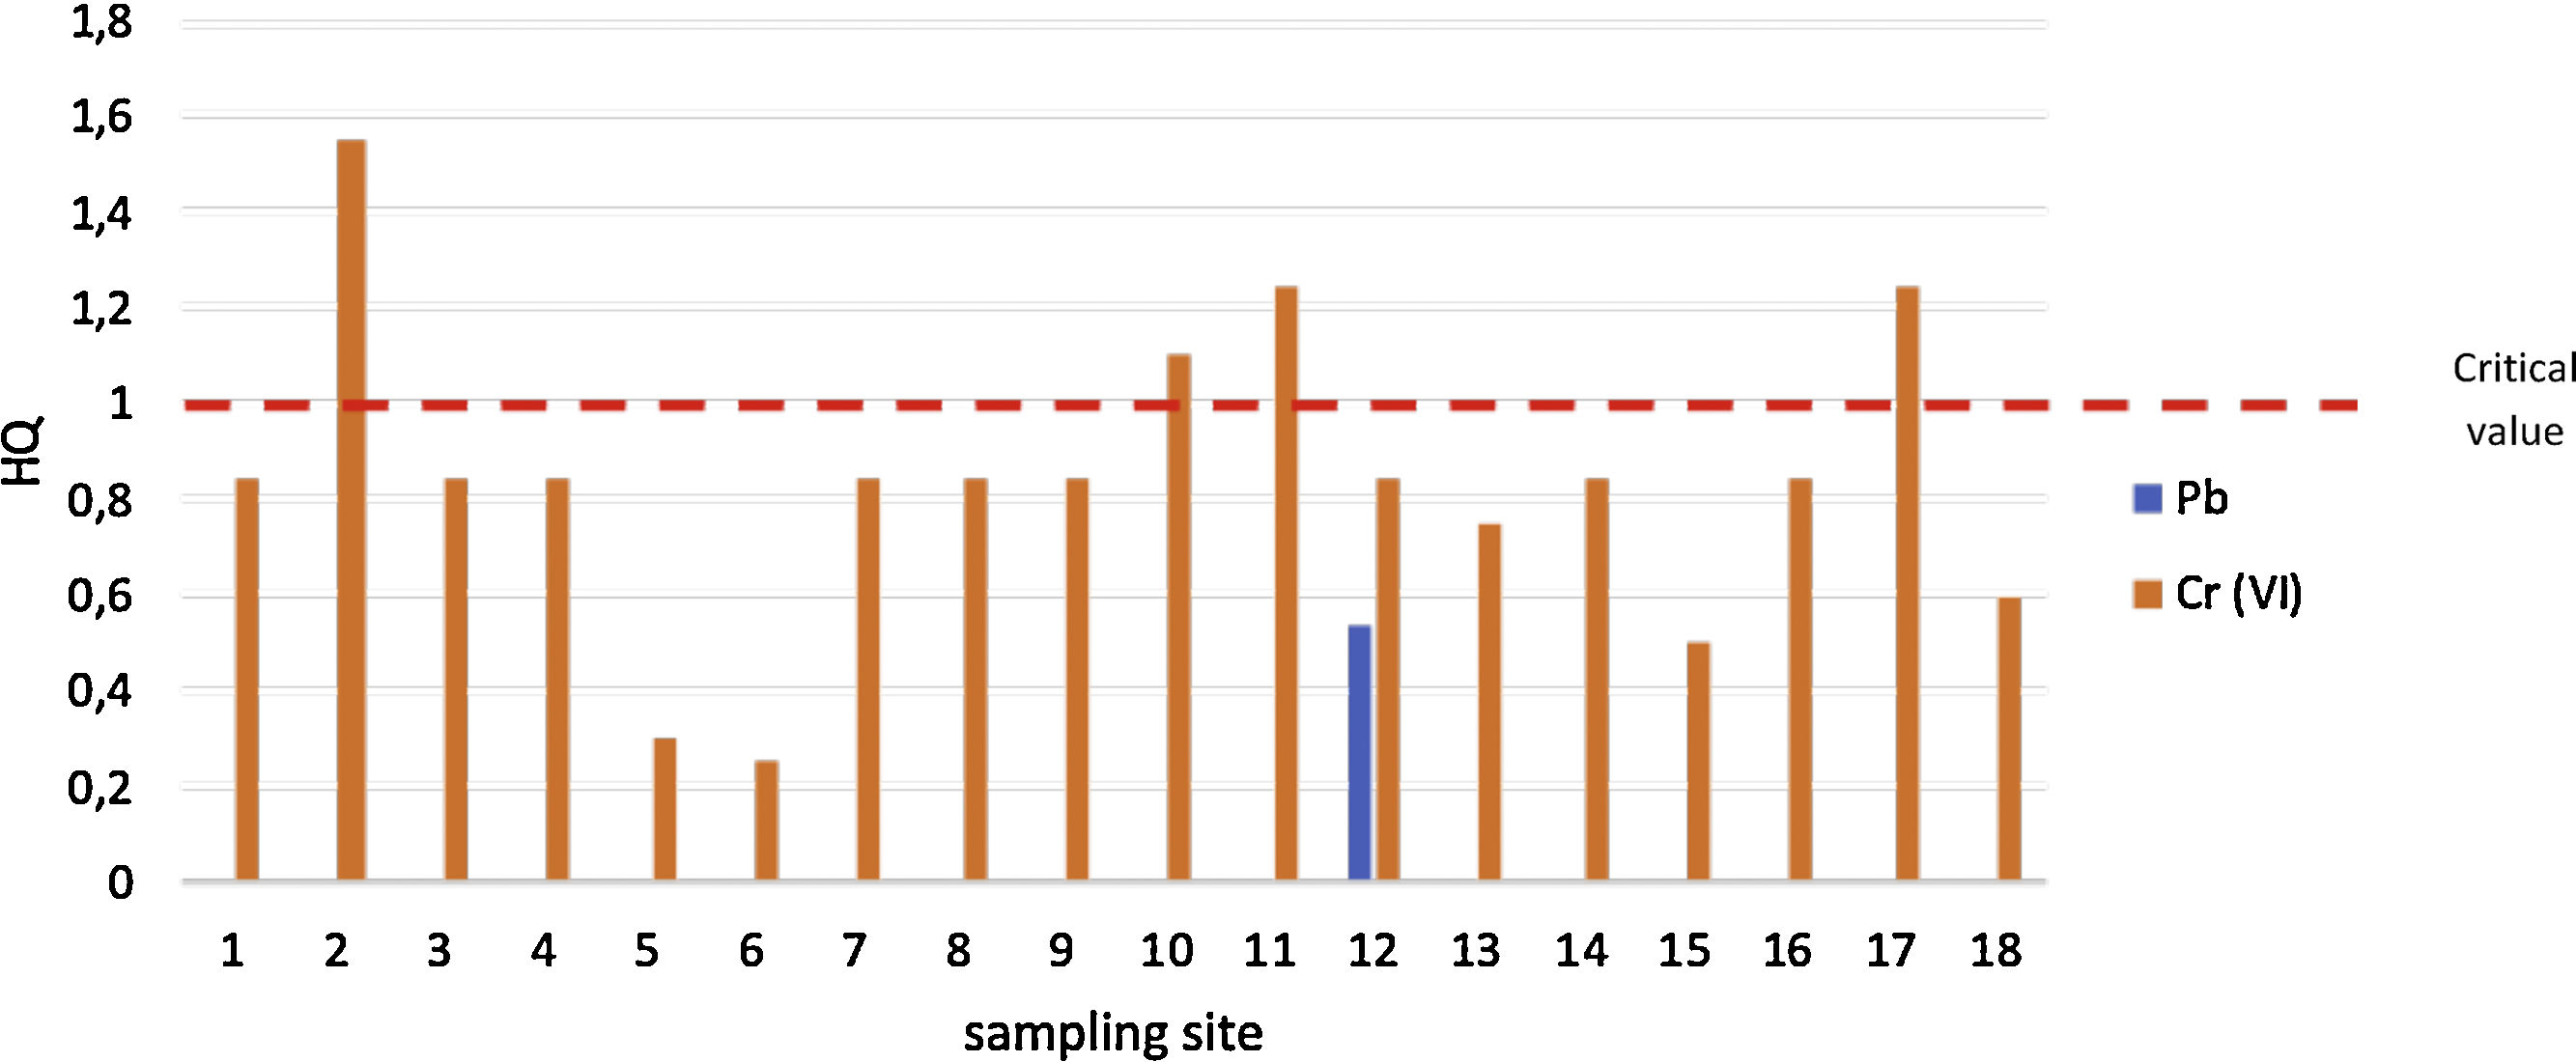
Evaluation of ecological risk levelBased on Fig. 2, it shows that most of the well water has a risk from Cr(VI) contamination (HQ>1). It implies that the exposure of Cr (VI) is possible to induce adverse effects. The sampling sites of 2, 10, 11, and 17 have HQ>1. It indicates that risk management related protection of well water contamination is needed to be done in the sampling sites. The highest value of HQ is located in the mining and industrial zone of Pangkajene regency. While for contamination of Pb has the same risk level (HQ<1). It indicates that the contamination of Pb in well water is acceptable or it does not have any ecological and human health risks.

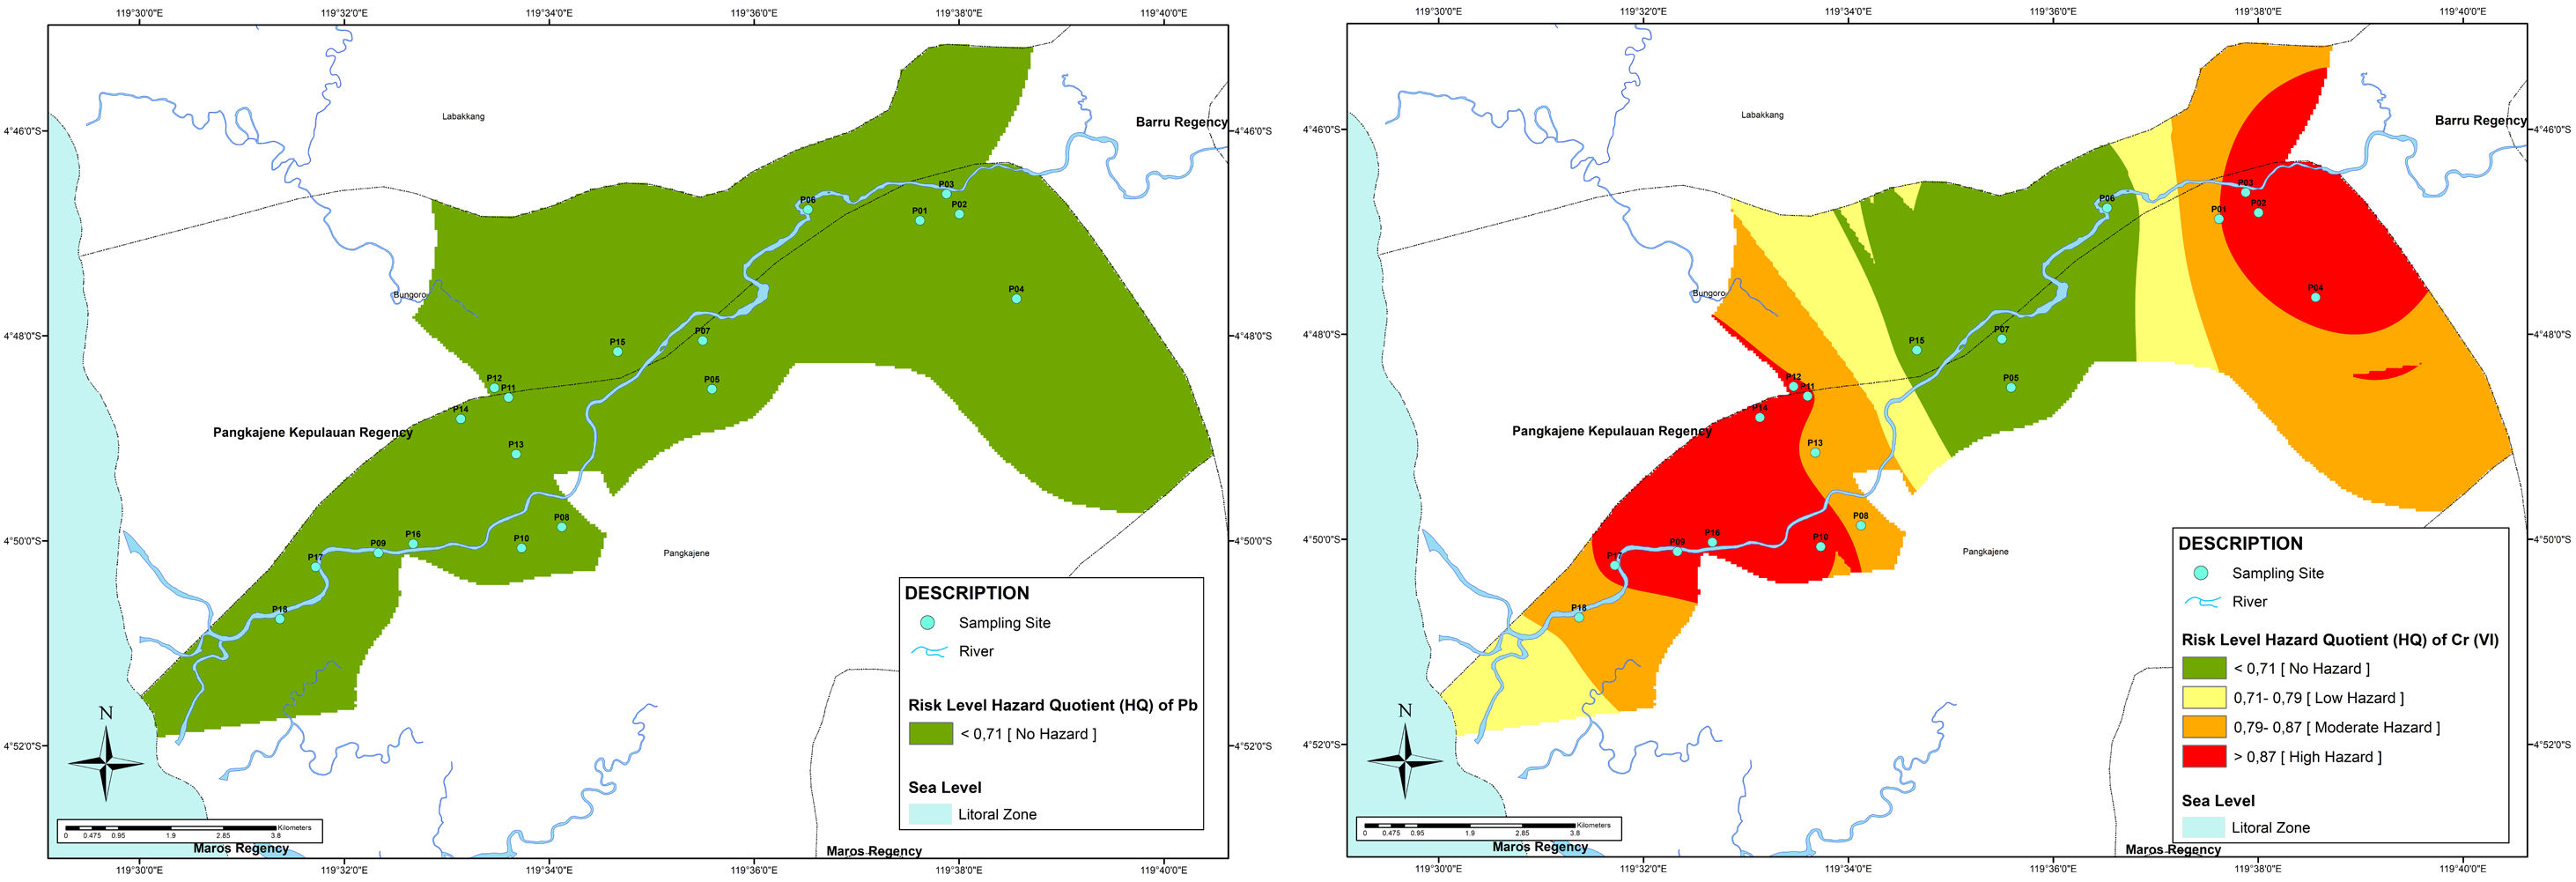
From Fig. 3, it showed that the area which has the highest HQ is distributed in upstream and downstream, an area in the middle stream has low risk for Cr(VI) pollution in well water. The upstream area is dominated by industry and mining areas, it may contribute to heavy metals pollution. A prior study from Mallongi, et al., (2020) showed that the upstream area (Bungoro Sub-district of Pangkep) is contaminated with mercury which comes from the cement plant surround that area23. The coal ash may contribute to Cr(VI) in groundwater.24

The study from Vengosh et al., (2016) demonstrated that high presence of Cr(VI) in groundwater also can be found in wells located far from the pond of coal ash. Moreover, the Cr(VI) also comes from geogenic activities influencing the aquifers.25 The downstream area is dominated with domestic, aquaculture, and agriculture activities. The contamination of Cr (VI) may be influenced by the application of a product that contains chlorinated solvent and solvent stabilizers and agriculture chemicals such as ammonia, nitrate, and DDE.26 Furthermore, due to the ability of heavy metals to accumulate and its persistence characteristic in the environment, the risk may increase in the future. So, monitoring and controlling heavy metals pollution in water resources are need to be conducted.
ConclusionCr(VI) has HQ>1 while other metals are below the standard, it implicates that Cr(VI) contamination in well water is the main risk factor in Pangkajene watershed area.
Conflict of interestThe authors declare no conflict of interest.
Peer-review under responsibility of the scientific committee of the 1st International Conference on Safety and Public Health (ICOS-PH 2020). Full-text and the content of it is under responsibility of authors of the article.


