


To estimate the incidence and 28-day and 5-year survival rates after a first acute myocardial infarction (AMI) in relation to socioeconomic status in the Basque Country (Spain) between 1999 and 2000.
MethodsData from a population-based registry of AMI were used. The study included 3,619 patients to calculate age-standardized incidence by the direct method and 2,003 patients (out-of-hospital deaths were excluded) to calculate observed and relative survival using the Kaplan-Meier and Hakulinen methods, respectively. Socioeconomic status was quantified using a deprivation index ecologically assigned to each patient according to the census tract of residence at diagnosis of AMI and was categorized into quintiles.
ResultsAmong men, the risk of AMI was higher in the lowest socioeconomic group than in the highest socioeconomic group (RR=1.17; 95%CI: 1.02-1.34). In men, a higher risk of death was observed in the middle (Q3; HR=1.60; 95%CI: 1.02-2.51) and low (Q5; HR=1.65; 95%CI: 1.02-2.69) quintiles compared with the least deprived group for age-adjusted survival during the acute phase. In the fully adjusted model, this effect was attenuated and no significant differences were observed in long-term survival. Among women, no significant differences were observed either in incidence or in short- and long-term survival.
ConclusionsSocioeconomic inequalities were only observed in men in incidence and in survival during the acute phase after an AMI.
Estimar la incidencia y la supervivencia a 28 días y 5 años tras un primer infarto agudo de miocardio (IAM) según la posición socioeconómica en el País Vasco entre 1999 y 2000.
MétodosUtilizando datos de un registro poblacional de IAM se incluyeron 3.619 pacientes para estimar la incidencia ajustada por edad por el método directo, y 2003 (excluidas las muertes extrahopitalarias) para la supervivencia observada y relativa con el método de Kaplan-Meier y el de Hakulinen, respectivamente. El nivel socioeconómico se definió por un índice de privación ecológicamente asignado a cada paciente según la sección censal de residencia al diagnóstico del IAM, y se categorizó en quintiles.
ResultadosLos hombres del nivel socioeconómico más bajo tuvieron un mayor riesgo de IAM que los del más alto (RR=1,17; IC95%: 1,02-1,34). En la supervivencia en la fase aguda ajustada por edad, los hombres de los quintiles medio (Q3; HR=1,60; IC95%: 1,02-2,51) y bajo (Q5; HR=1,65; IC95%: 1,02-2,69) presentaron un mayor riesgo de muerte en comparación con el grupo más favorecido. Este efecto se vio atenuado en los modelos completamente ajustados, y no hubo diferencias significativas en la supervivencia a largo plazo. En la mujeres no se hallaron diferencias significativas en la incidencia ni en la supervivencia a corto y largo plazo.
ConclusionesSólo se han observado desigualdades socioeconómicas en los hombres en la incidencia y la supervivencia durante la fase aguda.
Social inequalities in health are well established and are worse in the most deprived groups.1–3 Coronary heart disease is one of the main causes of death in men and women in industrialized countries4 and has been reported to be related to socioeconomic status.5,6 In recent decades, mortality has decreased, mainly due to a reduction in the incidence of this disease and improvements in medical treatment.7,8
For Spain, unlike for other countries, data on the relationship between socioeconomic status and acute myocardial infarction (AMI) are scarce.9 Nevertheless, in Europe, socioeconomic inequalities in mortality from ischemic heart disease have been found to have a geographic pattern from north to south.3,10 The magnitude of these inequalities tends to be small in southern countries and larger in north eastern European populations.
Mortality after an AMI has been analyzed in multiple studies.6,11–13 Nonetheless, to date, these studies have mainly focused on observed survival, whereas relative survival, commonly used in cancer research, has been little studied in the context of coronary heart disease.14,15 Furthermore, several studies have reported higher acute6,11 and long-term mortality12,13 after myocardial infarction in the lowest socioeconomic groups, as well as in women.16,17 Poorer patients have a greater number of cardiovascular risk factors and have also been found to be likely to receive less medical treatment during hospitalization or not to be treated with specialized cardiac surgery.13,18,19
The aim of this study was to determine the magnitude of social inequalities in the incidence and 28-day and 5-year survival in men and women after a first AMI in the Basque Country (Spain) between 1999 and 2000.
MethodsDesignAMI data for the Basque Country are part of the IBERICA (Investigación, Búsqueda Específica y Registro de Isquemia Coronaria Aguda) population-based register, a project started in 1997, in which eight Spanish regions participate. The identification of hospitalized AMI patients and description of variables and quality controls have previously been reported in detail.20
Study populationThe subjects of our study consisted of all the patients resident in the Basque Country who had a first AMI between 1999 and 2000 and were registered in the IBERICA database. This population register included individuals aged 25 years or more and covered around 80% of the population in the Basque Country, corresponding to five of the seven Basque health areas. The estimated mean population resident in the Basque Country covered by IBERICA for 2001 (aged ≥ 25 years) was 636,920 men and 679,509 women.
All first definite “fatal and non-fatal cases”, “fatal possible cases” and “fatal insufficient data events” classified according to the MONICA study criteria were included.21 Non-fatal possible cases (n=62) (most of which clinically corresponded to angina) and cases without socioeconomic information were excluded from the incidence analysis (n=355), while all patients who died before being admitted to any private or public hospital in the area of study were excluded from the survival analysis (n=1,616).
Monitoring of cases from symptom onset to day 28 was undertaken via an active search of hospital clinical records. Survival at 5 years was cross-checked using the Spanish National Death Index (including manual checking), individual health records and hospital clinical records.
Explanatory variablesThe following variables were taken into account: sex, age at disease onset, the presence of classical coronary risk factors (diabetes, hypercholesterolemia, hypertension and smoking), history of prior angina, AMI characteristics [typical symptoms, location, Killip class on admission, left ventricular ejection fraction (LVEF) and exercise test results], time from symptom onset to first monitoring and time from symptom onset to thrombolytic treatment, hospital complications during the acute phase (severe arrhythmia, postinfarction angina, reinfarction, and maximum Killip class during hospitalization), the therapeutic approach adopted during hospitalization and at discharge (antiplatelet therapy, beta blockers, angiotensin converting enzyme inhibitors [ACEI], early revascularization [thrombolysis within 6h of symptom onset and primary angioplasty on the day of infarction] and cardiac surgery), and place of treatment (admission or not to an intensive care unit [ICU]).
Deprivation indexSES was studied using a deprivation index ecologically assigned to each patient according to the census tract (average population of 1,226) of the residence at diagnosis of AMI. The deprivation index for each census tract was calculated using four socioeconomic indicators derived from the 2001 census:22 proportion of active people unemployed, proportion of manual workers with no qualification, proportion of people with education only to the primary level or below and proportion of houses with a low level of comfort.23 A principal-components analysis was used to obtain a summary score, in such a way as to explain as much of the total variation in the data as possible. Despite its ecological nature, this index has been proven to perform well as a measure socioeconomic differences.24 Patients were categorised into quintiles (Q1 being the least deprived quintile and Q5 the most deprived) according to the deprivation index of their census tract of residence. For clarity, individuals were classified into three groups as a function of the deprivation index: (Q1 [highest], Q2-Q3-Q4 [medium] and Q5 [lowest]) for the figures presented in this study.
Statistical analysisContinuous variables were described as means (with standard deviations), and discrete variables as absolute and relative frequencies. The Chi-squared test was used to check the equality of distributions by socioeconomic status, and an ANOVA was employed to test the equality of means. The Levene and Kolmogorov-Smirnov tests were used to check for homocedasticity and the normality of continuous variables.
The reference population of each socioeconomic level stratum consisted of all persons aged 25 years or more living in the census tracts to which that level was assigned. The populations were categorised by sex and 5-year age group (from 25-29 years to 85 or more years). Age-standardized incidence rates were calculated by direct methods using the Basque Country population in 2001 as the standard population. Relative risks were calculated for every quintile of the deprivation index with respect to the highest socioeconomic group, using Poisson models. Ninety-five percent confidence intervals were estimated for these incidence rates and relative risks.
Observed survival was estimated for the acute phase (first 28 days) and relative survival for the late phase (5 years). Deaths occurring in the acute phase were assumed to be directly related to AMI, with the expected mortality in the general population virtually null (thus observed survival and relative survival are very similar).
The Kaplan-Meier estimator was used to calculate observed survival and the log-rank test to assess univariate intra-group differences. Relative survival (with 95% confidence intervals) was calculated using the Hakulinen method,25 employing age-, sex- and deprivation index (quintile)-specific life tables for the general population in the area. Specifically, relative survival was the ratio of the observed survival to the expected survival of the corresponding general population and expresses the probability of AMI survival after adjustment for competing causes of death, a figure which is known to have a good performance for long follow-up periods.14
Mortality and population tables for the two periods 1999-2001 and 2002-2005 for the Basque Country, stratified by age (single year), sex and socioeconomic group were obtained from the Basque Statistics Institute.22
Data analysis showed a very different pattern with respect to the cardiovascular event in the first 28 days compared with the remainder of the follow-up period (from 29 days to 5 years). Since the usual proportional hazard assumption was violated for the whole follow-up, we decided to study the two periods separately. All variables were considered for multivariate analysis in long-term survival whereas treatments prescribed at hospital discharge were excluded from analysis of the first 28 days.
For the acute phase, a Cox proportional hazards model was used to study the effects on risk of the different covariates considered and the Akaike information criterion was used as a covariate exclusion criterion. The models satisfied (p>0.150) the proportional hazards hypothesis; this assumption was verified using the test based on Schoenfeld residuals.26
For the period from 29 days to 5 years, a multivariate model was constructed from the generalization for relative survival of the proportional hazards model proposed by Andersen.27 The test proposed by Stare was used to verify the hazards proportionality hypothesis28 (p>0.250) and again the Akaike information criterion was used as the covariate exclusion criterion.
All the analysis was performed using STATA 10, R 2.6.2 (relsurv package29) and SAS 9.2 software. Ninety-five per cent confidence intervals were also calculated for hazard ratios and the level of significance was set at p<0.05.
ResultsIncidenceA total of 3,974 incident AMI events were included from the period 1999 to 2000. Socioeconomic data were missing for 355 (8.9%) of these events. Comparison of patients with socioeconomic information with those without this information revealed some differences. The patients with no socioeconomic data were younger (mean age 67.8 vs 71.7 years, p<0.001) and showed lower mortality (17.5% vs 55.1%, p<0.001) and there was a smaller proportion of AMI cases with insufficient data (7.3% vs 31.3%, p<0.001); furthermore, most of these patients were from the Gipuzkoa health area (92.3% vs 40.2%, p<0.001).
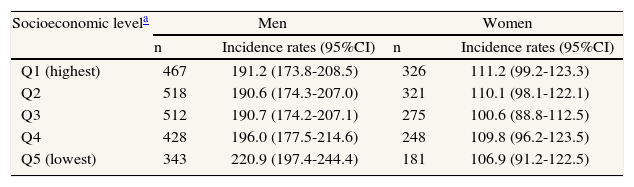
This study included 3,619 patients: 62.7% men and 37.3% women. Age-standardized incidence rates by socioeconomic group and sex are listed in table 1. These rates were higher in men than in women across the five socioeconomic quintiles considered, increased with increasing deprivation in men and showed a non-clear trend in women; the highest rates were found in the most privileged group compared with the remaining groups. In men, the risk of AMI was higher in the lowest socioeconomic group (RR=1.17; 95%CI: 1.02-1.34) than in the most privileged group, but in women no significant differences in any of the quintiles compared with the reference group (Q1) were observed (data not shown).
Age standardized incidence rates (per 100,000 inhabitants) after a first acute myocardial infarction by socioeconomic level and sex (data for the Basque Country from the IBERICA project, 1999-2000).
| Socioeconomic levela | Men | Women | ||
| n | Incidence rates (95%CI) | n | Incidence rates (95%CI) | |
| Q1 (highest) | 467 | 191.2 (173.8-208.5) | 326 | 111.2 (99.2-123.3) |
| Q2 | 518 | 190.6 (174.3-207.0) | 321 | 110.1 (98.1-122.1) |
| Q3 | 512 | 190.7 (174.2-207.1) | 275 | 100.6 (88.8-112.5) |
| Q4 | 428 | 196.0 (177.5-214.6) | 248 | 109.8 (96.2-123.5) |
| Q5 (lowest) | 343 | 220.9 (197.4-244.4) | 181 | 106.9 (91.2-122.5) |
95%CI: 95% confidence interval; Q: quintile.
The data from 2,003 patients was used for survival analysis, after excluding 1,616 out of hospital deaths. The data for this analysis included 1,391 (69.4%) men and 612 (30.6%) women. The mean age at disease onset was higher in women (75.0 [12.5] years) than in men (63.8 [13.4] years). Excluded patients had a higher mean age (77.9 [12.3] years), 54.0% were men, and distribution differed by socioeconomic status in both men and women, with a gradient from the highest socioeconomic group (Q1: 25.1% in men and 29.1% in women) to the lowest (Q5: 13.5% and 11.2%, respectively).
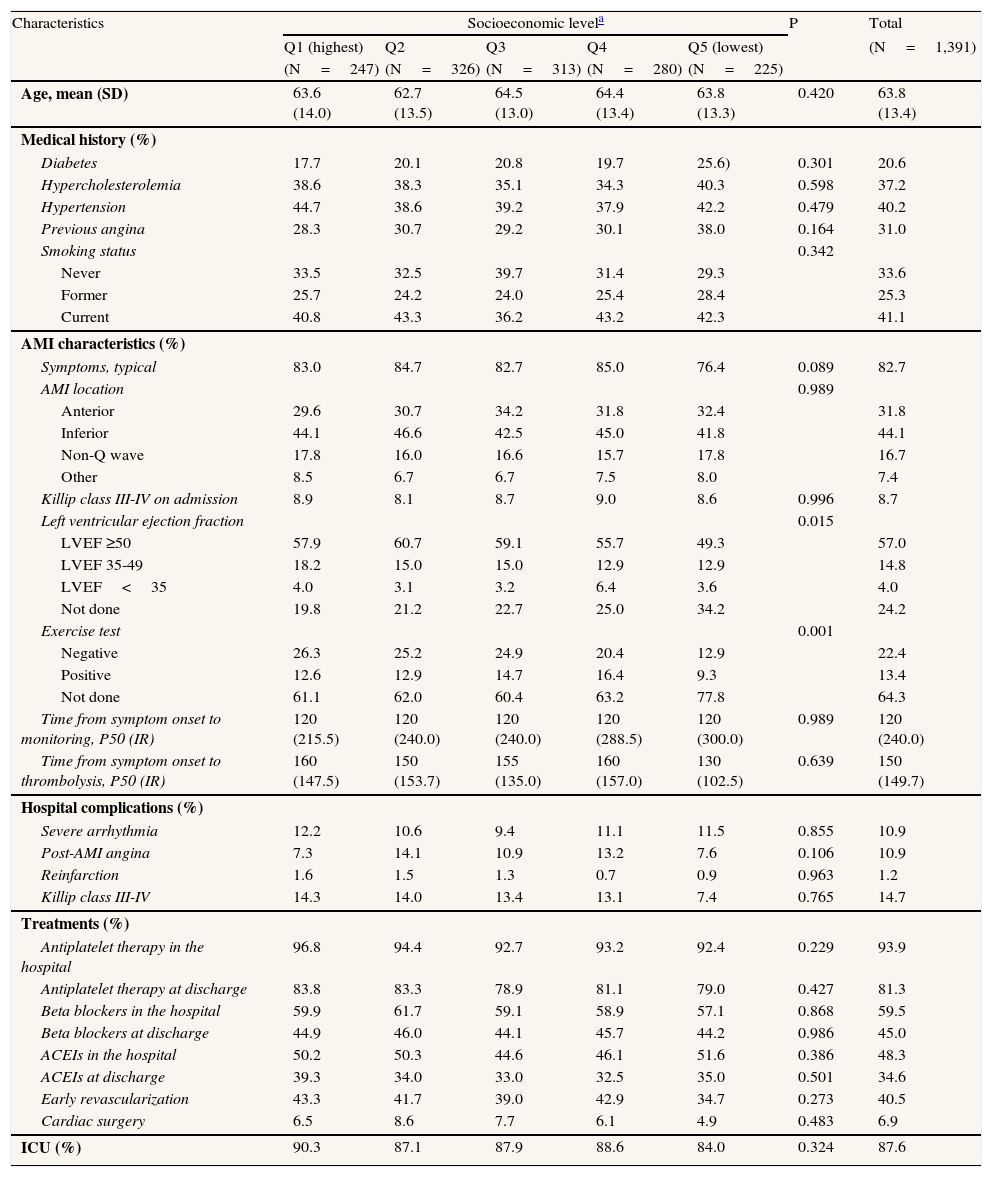
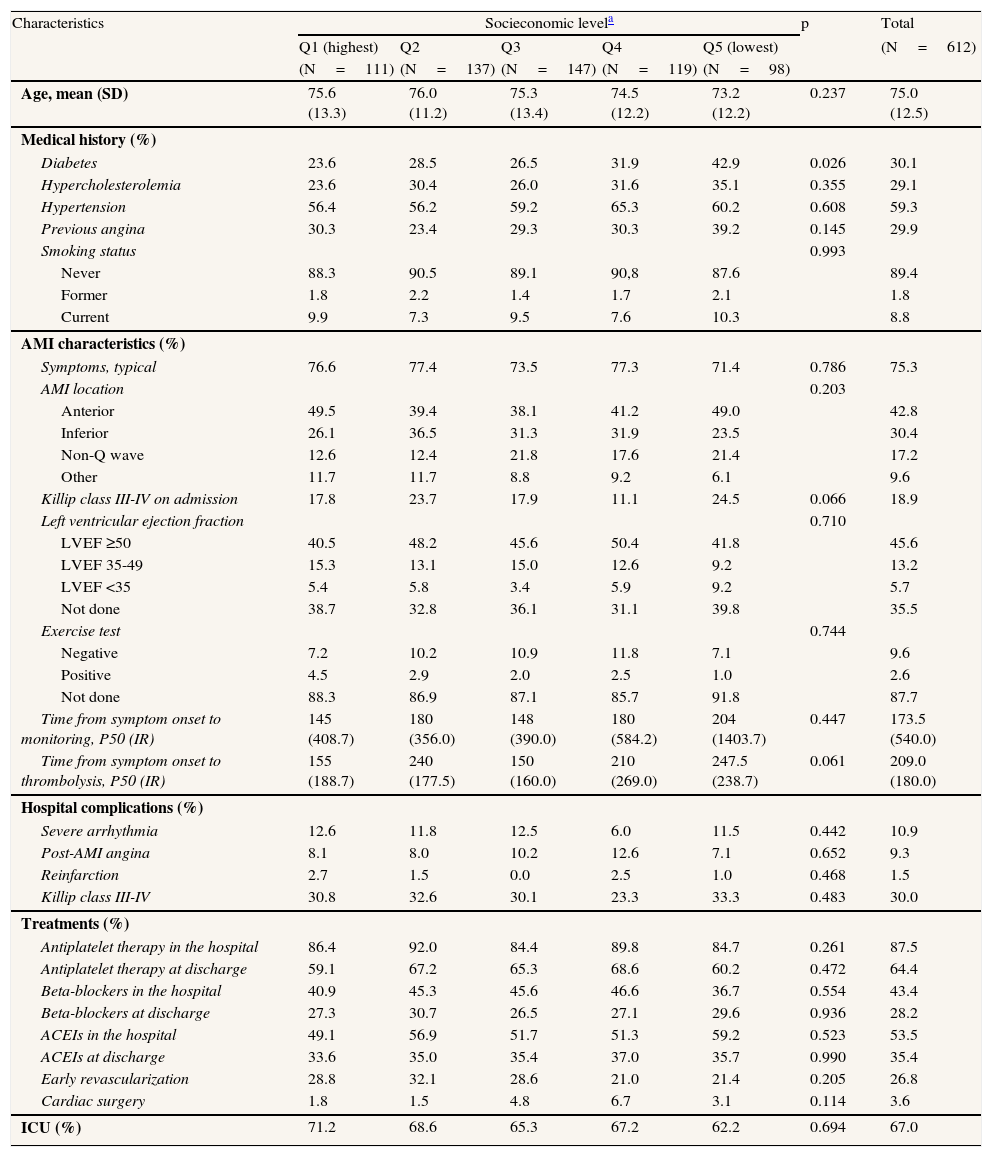
Tables 2 and 3 show the distribution of baseline characteristics by socioeconomic group in men and women, respectively, after their first AMI. In men, the proportion who never underwent exercise tests or left ventricular ejection fraction tests significantly increased from the most privileged socioeconomic groups to the most deprived groups, while among women, diabetes showed a socioeconomic gradient with a significantly higher proportion of women with diabetes in the most deprived groups (42.9% Q5 vs 23.6% Q1).
Baseline characteristics for survival analyses in men after a first acute myocardial infarction by socioeconomic level (data for the Basque Country from the IBERICA project, 1999-2000).
| Characteristics | Socioeconomic levela | P | Total | ||||
| Q1 (highest) | Q2 | Q3 | Q4 | Q5 (lowest) | (N=1,391) | ||
| (N=247) | (N=326) | (N=313) | (N=280) | (N=225) | |||
| Age, mean (SD) | 63.6 (14.0) | 62.7 (13.5) | 64.5 (13.0) | 64.4 (13.4) | 63.8 (13.3) | 0.420 | 63.8 (13.4) |
| Medical history (%) | |||||||
| Diabetes | 17.7 | 20.1 | 20.8 | 19.7 | 25.6) | 0.301 | 20.6 |
| Hypercholesterolemia | 38.6 | 38.3 | 35.1 | 34.3 | 40.3 | 0.598 | 37.2 |
| Hypertension | 44.7 | 38.6 | 39.2 | 37.9 | 42.2 | 0.479 | 40.2 |
| Previous angina | 28.3 | 30.7 | 29.2 | 30.1 | 38.0 | 0.164 | 31.0 |
| Smoking status | 0.342 | ||||||
| Never | 33.5 | 32.5 | 39.7 | 31.4 | 29.3 | 33.6 | |
| Former | 25.7 | 24.2 | 24.0 | 25.4 | 28.4 | 25.3 | |
| Current | 40.8 | 43.3 | 36.2 | 43.2 | 42.3 | 41.1 | |
| AMI characteristics (%) | |||||||
| Symptoms, typical | 83.0 | 84.7 | 82.7 | 85.0 | 76.4 | 0.089 | 82.7 |
| AMI location | 0.989 | ||||||
| Anterior | 29.6 | 30.7 | 34.2 | 31.8 | 32.4 | 31.8 | |
| Inferior | 44.1 | 46.6 | 42.5 | 45.0 | 41.8 | 44.1 | |
| Non-Q wave | 17.8 | 16.0 | 16.6 | 15.7 | 17.8 | 16.7 | |
| Other | 8.5 | 6.7 | 6.7 | 7.5 | 8.0 | 7.4 | |
| Killip class III-IV on admission | 8.9 | 8.1 | 8.7 | 9.0 | 8.6 | 0.996 | 8.7 |
| Left ventricular ejection fraction | 0.015 | ||||||
| LVEF ≥50 | 57.9 | 60.7 | 59.1 | 55.7 | 49.3 | 57.0 | |
| LVEF 35-49 | 18.2 | 15.0 | 15.0 | 12.9 | 12.9 | 14.8 | |
| LVEF<35 | 4.0 | 3.1 | 3.2 | 6.4 | 3.6 | 4.0 | |
| Not done | 19.8 | 21.2 | 22.7 | 25.0 | 34.2 | 24.2 | |
| Exercise test | 0.001 | ||||||
| Negative | 26.3 | 25.2 | 24.9 | 20.4 | 12.9 | 22.4 | |
| Positive | 12.6 | 12.9 | 14.7 | 16.4 | 9.3 | 13.4 | |
| Not done | 61.1 | 62.0 | 60.4 | 63.2 | 77.8 | 64.3 | |
| Time from symptom onset to monitoring, P50 (IR) | 120 (215.5) | 120 (240.0) | 120 (240.0) | 120 (288.5) | 120 (300.0) | 0.989 | 120 (240.0) |
| Time from symptom onset to thrombolysis, P50 (IR) | 160 (147.5) | 150 (153.7) | 155 (135.0) | 160 (157.0) | 130 (102.5) | 0.639 | 150 (149.7) |
| Hospital complications (%) | |||||||
| Severe arrhythmia | 12.2 | 10.6 | 9.4 | 11.1 | 11.5 | 0.855 | 10.9 |
| Post-AMI angina | 7.3 | 14.1 | 10.9 | 13.2 | 7.6 | 0.106 | 10.9 |
| Reinfarction | 1.6 | 1.5 | 1.3 | 0.7 | 0.9 | 0.963 | 1.2 |
| Killip class III-IV | 14.3 | 14.0 | 13.4 | 13.1 | 7.4 | 0.765 | 14.7 |
| Treatments (%) | |||||||
| Antiplatelet therapy in the hospital | 96.8 | 94.4 | 92.7 | 93.2 | 92.4 | 0.229 | 93.9 |
| Antiplatelet therapy at discharge | 83.8 | 83.3 | 78.9 | 81.1 | 79.0 | 0.427 | 81.3 |
| Beta blockers in the hospital | 59.9 | 61.7 | 59.1 | 58.9 | 57.1 | 0.868 | 59.5 |
| Beta blockers at discharge | 44.9 | 46.0 | 44.1 | 45.7 | 44.2 | 0.986 | 45.0 |
| ACEIs in the hospital | 50.2 | 50.3 | 44.6 | 46.1 | 51.6 | 0.386 | 48.3 |
| ACEIs at discharge | 39.3 | 34.0 | 33.0 | 32.5 | 35.0 | 0.501 | 34.6 |
| Early revascularization | 43.3 | 41.7 | 39.0 | 42.9 | 34.7 | 0.273 | 40.5 |
| Cardiac surgery | 6.5 | 8.6 | 7.7 | 6.1 | 4.9 | 0.483 | 6.9 |
| ICU (%) | 90.3 | 87.1 | 87.9 | 88.6 | 84.0 | 0.324 | 87.6 |
Q: quintile; SD: standard deviation; P50: median; IR: interquartile range; LVEF: left ventricular ejection fraction; AMI: acute myocardial infarction; ACEI: angiotensin converting-enzyme inhibitors; ICU: intensive care unit.
Time onset symptoms to monitoring and time onset symptoms to thrombolysis: in minutes.
Baseline characteristics for survival analysis in women after a first acute myocardial infarction by socioeconomic level (data for the Basque Country from the IBERICA project, 1999-2000).
| Characteristics | Socieconomic levela | p | Total | ||||
| Q1 (highest) | Q2 | Q3 | Q4 | Q5 (lowest) | (N=612) | ||
| (N=111) | (N=137) | (N=147) | (N=119) | (N=98) | |||
| Age, mean (SD) | 75.6 (13.3) | 76.0 (11.2) | 75.3 (13.4) | 74.5 (12.2) | 73.2 (12.2) | 0.237 | 75.0 (12.5) |
| Medical history (%) | |||||||
| Diabetes | 23.6 | 28.5 | 26.5 | 31.9 | 42.9 | 0.026 | 30.1 |
| Hypercholesterolemia | 23.6 | 30.4 | 26.0 | 31.6 | 35.1 | 0.355 | 29.1 |
| Hypertension | 56.4 | 56.2 | 59.2 | 65.3 | 60.2 | 0.608 | 59.3 |
| Previous angina | 30.3 | 23.4 | 29.3 | 30.3 | 39.2 | 0.145 | 29.9 |
| Smoking status | 0.993 | ||||||
| Never | 88.3 | 90.5 | 89.1 | 90,8 | 87.6 | 89.4 | |
| Former | 1.8 | 2.2 | 1.4 | 1.7 | 2.1 | 1.8 | |
| Current | 9.9 | 7.3 | 9.5 | 7.6 | 10.3 | 8.8 | |
| AMI characteristics (%) | |||||||
| Symptoms, typical | 76.6 | 77.4 | 73.5 | 77.3 | 71.4 | 0.786 | 75.3 |
| AMI location | 0.203 | ||||||
| Anterior | 49.5 | 39.4 | 38.1 | 41.2 | 49.0 | 42.8 | |
| Inferior | 26.1 | 36.5 | 31.3 | 31.9 | 23.5 | 30.4 | |
| Non-Q wave | 12.6 | 12.4 | 21.8 | 17.6 | 21.4 | 17.2 | |
| Other | 11.7 | 11.7 | 8.8 | 9.2 | 6.1 | 9.6 | |
| Killip class III-IV on admission | 17.8 | 23.7 | 17.9 | 11.1 | 24.5 | 0.066 | 18.9 |
| Left ventricular ejection fraction | 0.710 | ||||||
| LVEF ≥50 | 40.5 | 48.2 | 45.6 | 50.4 | 41.8 | 45.6 | |
| LVEF 35-49 | 15.3 | 13.1 | 15.0 | 12.6 | 9.2 | 13.2 | |
| LVEF <35 | 5.4 | 5.8 | 3.4 | 5.9 | 9.2 | 5.7 | |
| Not done | 38.7 | 32.8 | 36.1 | 31.1 | 39.8 | 35.5 | |
| Exercise test | 0.744 | ||||||
| Negative | 7.2 | 10.2 | 10.9 | 11.8 | 7.1 | 9.6 | |
| Positive | 4.5 | 2.9 | 2.0 | 2.5 | 1.0 | 2.6 | |
| Not done | 88.3 | 86.9 | 87.1 | 85.7 | 91.8 | 87.7 | |
| Time from symptom onset to monitoring, P50 (IR) | 145 (408.7) | 180 (356.0) | 148 (390.0) | 180 (584.2) | 204 (1403.7) | 0.447 | 173.5 (540.0) |
| Time from symptom onset to thrombolysis, P50 (IR) | 155 (188.7) | 240 (177.5) | 150 (160.0) | 210 (269.0) | 247.5 (238.7) | 0.061 | 209.0 (180.0) |
| Hospital complications (%) | |||||||
| Severe arrhythmia | 12.6 | 11.8 | 12.5 | 6.0 | 11.5 | 0.442 | 10.9 |
| Post-AMI angina | 8.1 | 8.0 | 10.2 | 12.6 | 7.1 | 0.652 | 9.3 |
| Reinfarction | 2.7 | 1.5 | 0.0 | 2.5 | 1.0 | 0.468 | 1.5 |
| Killip class III-IV | 30.8 | 32.6 | 30.1 | 23.3 | 33.3 | 0.483 | 30.0 |
| Treatments (%) | |||||||
| Antiplatelet therapy in the hospital | 86.4 | 92.0 | 84.4 | 89.8 | 84.7 | 0.261 | 87.5 |
| Antiplatelet therapy at discharge | 59.1 | 67.2 | 65.3 | 68.6 | 60.2 | 0.472 | 64.4 |
| Beta-blockers in the hospital | 40.9 | 45.3 | 45.6 | 46.6 | 36.7 | 0.554 | 43.4 |
| Beta-blockers at discharge | 27.3 | 30.7 | 26.5 | 27.1 | 29.6 | 0.936 | 28.2 |
| ACEIs in the hospital | 49.1 | 56.9 | 51.7 | 51.3 | 59.2 | 0.523 | 53.5 |
| ACEIs at discharge | 33.6 | 35.0 | 35.4 | 37.0 | 35.7 | 0.990 | 35.4 |
| Early revascularization | 28.8 | 32.1 | 28.6 | 21.0 | 21.4 | 0.205 | 26.8 |
| Cardiac surgery | 1.8 | 1.5 | 4.8 | 6.7 | 3.1 | 0.114 | 3.6 |
| ICU (%) | 71.2 | 68.6 | 65.3 | 67.2 | 62.2 | 0.694 | 67.0 |
Q: quintile; SD: standard deviation; P50: median; IR: interquartile range; LVEF: left ventricular ejection fraction; AMI: acute myocardial infarction; ACEI: angiotensin converting enzyme inhibitors; ICU: intensive care unit.
Time from symptom onset to monitoring and time from symptom onset to thrombolysis: in minutes.
Of the 2,003 patients with a first AMI included in this study, 384 patients (200 men and 184 women) died within the first 28 days following their AMI, and a further 667 patients (381 men and 286 women) died within 5 years.
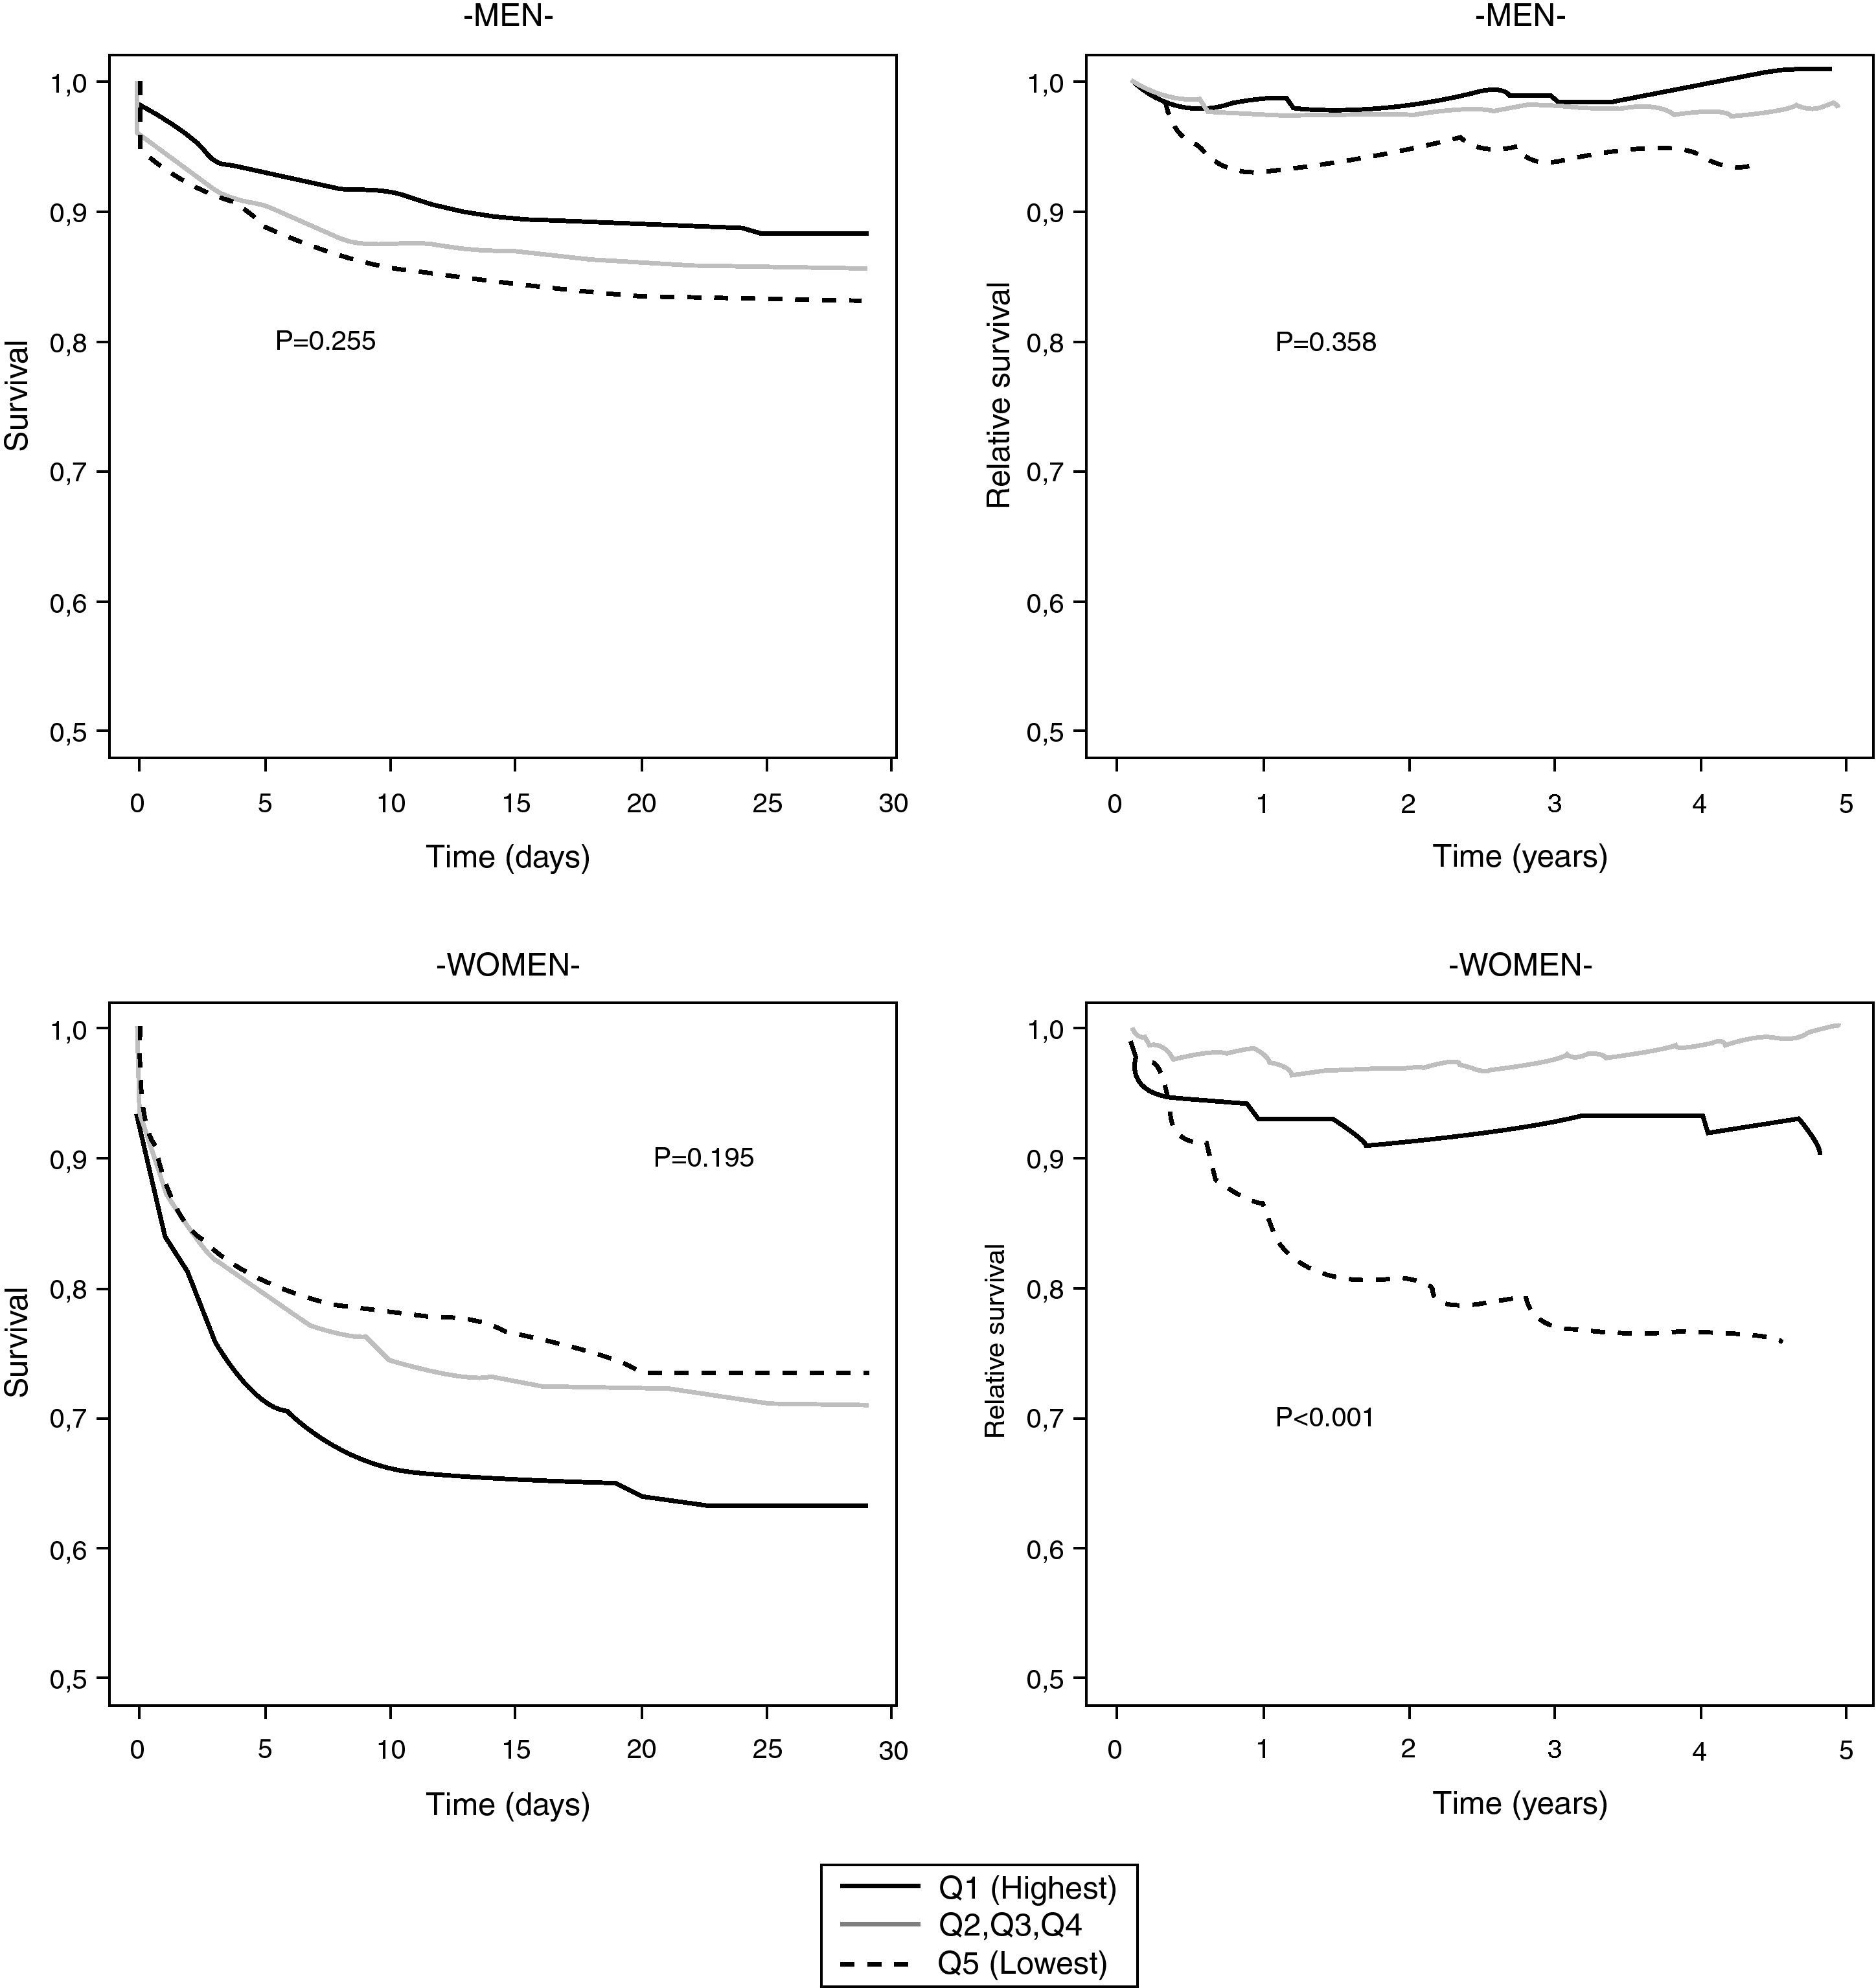
Figure 1 shows the observed survival curves in the first 28 days following a first AMI (left) and the relative survival curves from day 29 to 5 years (right), by socioeconomic level in men and women. During the acute phase, men in the most privileged quintile and women in the most deprived quintile had better rates of survival than persons in the remaining quintiles (although these differences were not significant). In the late phase, relative survival was higher for quintile 1 in men (non-significant) and for quintiles 2, 3 and 4 in women (p<0.001) compared with the remaining socioeconomic groups.

Observed survival curves over the first 28 days (left) and relative survival curves from day 29 to five years (right) after a first myocardial infarction by socioeconomic levela and sex, IBERICA-Basque Country 1999-2000.
Q: quintile
aSocioeconomic level assigned at census tract of residence.
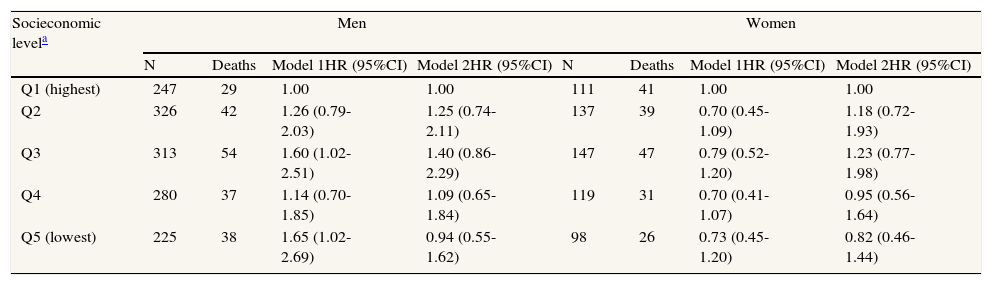
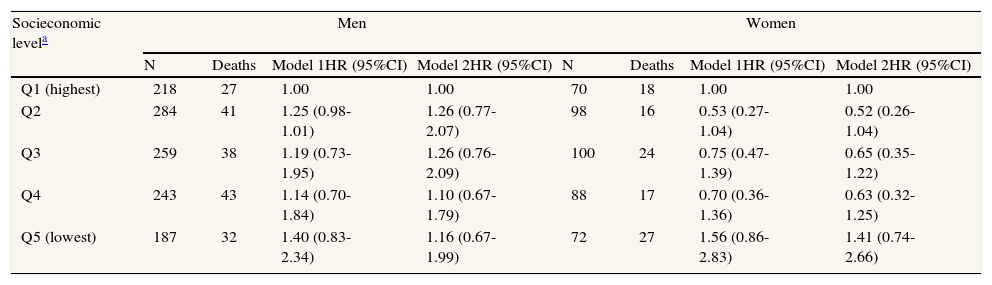
Tables 4 and 5 show the results of the hazard ratio for short- and long-term survival, respectively. In men, the age-adjusted model in the first 28 days following a first AMI identified a significantly higher relative risk of death in quintiles 3 (HR=1.60; 95%CI: 1.02-2.51) and 5 (HR=1.65; 95%CI: 1.02-2.69) compared with the highest socioeconomic group. After adjustment for age and for the most statistically relevant variables plus health area, this effect was reduced (the differences became non-significant). In women, there were no significant differences or clear gradients in either of the models. In the late phase, no significant differences were observed in either men or women.
Relative risk of death in the first 28 days after a first acute myocardial infarction in men and women (data for the Basque Country from the IBERICA project, 1999-2000).
| Socieconomic levela | Men | Women | ||||||
| N | Deaths | Model 1HR (95%CI) | Model 2HR (95%CI) | N | Deaths | Model 1HR (95%CI) | Model 2HR (95%CI) | |
| Q1 (highest) | 247 | 29 | 1.00 | 1.00 | 111 | 41 | 1.00 | 1.00 |
| Q2 | 326 | 42 | 1.26 (0.79-2.03) | 1.25 (0.74-2.11) | 137 | 39 | 0.70 (0.45-1.09) | 1.18 (0.72-1.93) |
| Q3 | 313 | 54 | 1.60 (1.02-2.51) | 1.40 (0.86-2.29) | 147 | 47 | 0.79 (0.52-1.20) | 1.23 (0.77-1.98) |
| Q4 | 280 | 37 | 1.14 (0.70-1.85) | 1.09 (0.65-1.84) | 119 | 31 | 0.70 (0.41-1.07) | 0.95 (0.56-1.64) |
| Q5 (lowest) | 225 | 38 | 1.65 (1.02-2.69) | 0.94 (0.55-1.62) | 98 | 26 | 0.73 (0.45-1.20) | 0.82 (0.46-1.44) |
HR: hazard ratio; Q: quintile; Quintile 1 is the reference category
Model 1: adjusted for age.
Model 2: adjusted for the most statistically important variables plus health area. For men; age, left-ventricular ejection fraction (LVEF), post-acute myocardial infarction (AMI) angina, Killip class III-IV during hospitalization, beta-blockers in the hospital, angiotensin converting-enzyme inhibitors (ACEI) in the hospital, early revascularization; for women: age, LVEF, severe arrhythmia, post-AMI angina, Killip class III-IV during hospitalization, beta-blockers in the hospital, ACEI in the hospital and early revascularization.
Relative excess risk of death from day 29 to 5 years after a first acute myocardial infarction in men and women (data for the Basque Country from the IBERICA project, 1999-2000).
| Socieconomic levela | Men | Women | ||||||
| N | Deaths | Model 1HR (95%CI) | Model 2HR (95%CI) | N | Deaths | Model 1HR (95%CI) | Model 2HR (95%CI) | |
| Q1 (highest) | 218 | 27 | 1.00 | 1.00 | 70 | 18 | 1.00 | 1.00 |
| Q2 | 284 | 41 | 1.25 (0.98-1.01) | 1.26 (0.77-2.07) | 98 | 16 | 0.53 (0.27-1.04) | 0.52 (0.26-1.04) |
| Q3 | 259 | 38 | 1.19 (0.73-1.95) | 1.26 (0.76-2.09) | 100 | 24 | 0.75 (0.47-1.39) | 0.65 (0.35-1.22) |
| Q4 | 243 | 43 | 1.14 (0.70-1.84) | 1.10 (0.67-1.79) | 88 | 17 | 0.70 (0.36-1.36) | 0.63 (0.32-1.25) |
| Q5 (lowest) | 187 | 32 | 1.40 (0.83-2.34) | 1.16 (0.67-1.99) | 72 | 27 | 1.56 (0.86-2.83) | 1.41 (0.74-2.66) |
HR: hazard ratio; Q: quintile; Quintile 1 is the reference category
Model 1: Adjusted for age.
Model 2: Adjusted for the most statistically important variables plus health area. For men: age, hypercholesterolemia, exercise test, acute myocardial infarction (AMI) location, Killip III-IV class during hospitalization, intensive care unit (ICU) admission, beta-blockers at discharge and cardiac surgery; for women: age, smoking status, AMI location, Killip class III-IV on admission and ICU admission.
Socioeconomic inequalities in incidence and survival after a first myocardial infarction in the Basque Country were studied on the basis of the ecologically-derived estimation of a deprivation index. Based on the incidence obtained, the risk of AMI was significantly higher in men from the lowest socioeconomic group than in those in the highest socioeconomic group, while differences in women were non-significant and showed a non-clear trend. In survival, socioeconomic differences were only seen in men during the acute phase, with a significantly higher relative risk of death in the middle (Q3) and low (Q5) socioeconomic groups compared with the least deprived group when the model was adjusted by age.
Comparison of our results with those of previous studies must take into account the substantial differences in the definition of the cases, the study populations, the research period, patients’ baseline characteristics and the type of deprivation index used, as well as the analytical approach.
Although socioeconomic inequalities in incidence and survival after an AMI have been described in several studies, differences in their gradient and magnitude have also been found. Specifically, most studies have found a socioeconomic gradient in incidence rates in both men and women. However, a study in Glasgow30 and others in Finland6 and Rome5 found steeper effects among women than among men. In all cases, socioeconomic status accounted for more coronary events among men than among women as the absolute risk among women was much lower.
Lethality due to acute myocardial infarction has also been found to be higher in people with lower socioeconomic status. Nevertheless, in contrast with our finding of a significantly higher risk of death during the acute phase for men from the more deprived groups, a study from Rome5 found a similar tendency but in women. Similar to our study, the same study found no differences between socioeconomic level and 1-year mortality in either men or women. In a study from Glasgow,30 neither socioeconomic status nor sex differences were found in short-term mortality, but in a Swedish study of patients who survived 28 days after an AMI, both men and women showed significantly increased 5-year mortality with decreasing income, even after further adjustment for previous hospitalizations.13
In a universal healthcare system in which medical services are available to all citizens regardless of income, most of these inequalities have been attributed to differences in the prevalence of cardiovascular risk factors in populations with distinct socioeconomic levels. Nonetheless, in our data, no differences in risk factors, except in diabetes for women, were observed. However, the determinants of inequalities go beyond biological differences, because there are underlying causes that condition exposure to risk factors. Thus, differences between the sexes could be explained by differences in occupational exposure, as well as in health-related behavior.31
Other factors to consider would be differences in the in-hospital management of patients with AMI, such as implementation of revascularization procedures, considered to be the treatment of choice in both men and women. In particular, primary angioplasty is more effective than thrombolysis in terms of outcome by improving coronary flow and reducing residual stenosis.32 Not only have inequalities been found in early revascularization treatment but also a less intense use of diagnostic and treatment procedures has been described in patients with lower socioeconomic status,5,12 with worse long-term survival in patients with no revascularization.13 In our study, social and organizational factors underlying inequalities in the access to healthcare procedures seem to go beyond socioeconomic status, considering that time to revascularization also depends on the availability of the procedure near the area of residence. During the study period, not all hospitals offered a 24-hour service for angioplasty, and thus distance to the referral hospital may have masked the social gradient in a society where health inequalities have been described as being small.3 In addition, out-of-hospital deaths showed different characteristics and an inverse socioeconomic gradient that would have attenuated the small socioeconomic gradient found in men or even reversed it.
One of the strengths of this study is that it explores socioeconomic inequalities in terms of incidence and relative survival after AMI. The figures analyzed were drawn from a population-wide register of AMI events with quality control over data entry,20 thus guaranteeing the reliability and validity of the data and making selection or information bias unlikely. The study population consisted of all persons living in the selected geographic area who met the inclusion criteria. Although this population included around 80% of the population in the Basque Country, it was representative of the Basque health areas included in the study.
Despite all the aforementioned characteristics, this study has certain limitations. Compliance with treatment and any changes in treatment after hospital discharge are unknown, as no active follow-up was undertaken. The deprivation index used was area-based and, as has been suggested by Picciotto et al,5 may not accurately represent the true socioeconomic status of an individual. The use of socioeconomic indicators by area of residence may underestimate the magnitude of inequalities, as reported by Esnaola et al,,23 who found smaller socioeconomic differences in Basque Country mortality when using an ecologically assigned deprivation index as compared with individually assigned socioeconomic level.3 Nevertheless, the results from this European study3 with individual socioeconomic data showed that the inequalities in mortality for all causes and, more specifically, for cardiovascular and ischemic heart diseases were small in the Basque Country compared with other regions of Europe. However, there was no socioeconomic data for 8.9% of the patients. Although a high percentage of the patients without socioeconomic data were from Gipuzkoa health area, an additional analysis of survival models excluding data from this health area revealed no substantial changes in the gradient observed for all the health areas considered. In addition, the distribution of quintiles by health areas in the patients studied was similar to that of the general population. Finally, the high number of out-of-hospital deaths reduced the number of the study population analyzed.
Overall, although various explanations for the relationship between socioeconomic status and outcomes following AMI have been proposed,33 such as the presence of a greater number of cardiovascular risk factors or the administration of fewer treatments after an AMI in lower socioeconomic groups,12,13 to date, the mechanisms behind this complex association remain unclear. Consequently, a greater understanding of differences in health outcomes related to socioeconomic status could be used to design and implement policies to reduce these inequalities.2 The literature on health inequalities in Spain is extensive23,34 but less is known about interventions applied in this field.35,36 Further research in this health area in Spain could improve our understanding of socioeconomic inequalities in healthcare and our ability to address this issue.
In conclusion, the Basque Country, a region with a low AMI incidence, like most southern European countries, has shown few socioeconomic differences in incidence in men and none in women. Similar results were observed for survival during the acute phase and no socioeconomic differences were identified in long-term survival in either men or women.
The Basque Country is one of the European regions with the lowest socioeconomic differences in mortality, although no studies have assessed the association between socioeconomic level and the incidence of acute myocardial infarction and associated mortality. Lethality in the first 28 days is influenced by the quality and timeliness of the care received as well as by the ability of the affected individual to identify the symptoms clearly and early. Mortality after the acute phase is mainly related to the quality of secondary prevention. A health system that covers almost all the population would certainly reduce health inequalities, although there are external factors apart from the health system itself that can influence equitable access to services.
What this study adds to the literature?Using the IBERICA database of the Basque Country, a higher incidence of acute myocardial infarction and lethality during the acute phase was observed in men from the most disadvantaged socioeconomic group. No differences were observed in women. Long-term mortality was studied using relative survival, which allowed the excess risk of dying in persons with acute myocardial infarction to be estimated, taking into account the mortality of the reference population. This estimation showed that the socioeconomic differences observed disappeared as soon as the acute phase was over. This is the first population study on socioeconomic differences in survival after an acute myocardial infarction in the Basque Country or elsewhere in Spain using this method and therefore the results should be confirmed in future studies. Survival trends should be studied over time, especially in the current economic crisis, which could have a greater impact on the poorest groups.
M. Machón, E. Aldasoro, P. Martínez-Camblor, M. Calvo, M. Basterretxea and N. Larrañaga designed the study and analysed the data. C. Audicana, E. Alonso and M. Tobalina revised the design of the study and the results. M. Machon redacted the manuscript and the other authors participated in the review of the different drafts and approved the final version.
FundingThe study was not supported by any grants and no external institutions have been involved.
Conflict of interestThe authors have no conflict of interest to declare.
The authors would like to thank researchers involved in the Basque Country part of the IBERICA project.


