


The 3rd International Nursing and Health Sciences Students and Health Care Professionals Conference (INHSP)
More infoThe COVID-19 pandemic has disrupted people's normal life as a result of strict policies applied to slow down the pandemic. To find out how extensive the virus spread is, most countries increase their daily testing rates.
MethodThis simple modelling work uses stringency index and daily testing (including the lagged version up to the previous 14 days) to predict daily COVID-19 cases in India and Indonesia. A Stepwise Multiple Regression (SWMR) subroutine is used in this modelling to select factors based on a 0.01 significant level affecting daily COVID-19 cases before the epidemic peaks.
ResultThe models have high predictability close to 94% (Indonesia) and 99% (India). Increasing number of daily COVID-19 cases in Indonesia is associated with the country's increased testing capacity. On the other hand, stringency indices play more important role in determining India's daily COVID-19 cases.
CloclusionOur finding shows that one question remains to be answered as to why testing and strict policy differ in determining daily cases in both Asian countries.
Coronavirus Disease 2019 (COVID-19) pandemic, caused by SARS-CoV-2 virus,1 brings about multiple disruptive effects in our normal life, mainly in health and socio-economic aspects.2–6 The transmission is facilitated both by symptomatic and asymptomatic infected individuals.7,8 The high transmissibility of this virus9,10 has created various responses from governments to stop or at least to slow down its spreading. This leads to most countries taking aggressive quarantine and lockdown measures. China's lockdown measure, for example, demonstrates that the response is effective to slow down the spread of COVID-19.11 In addition, China also applied other means of controlling this pandemic such as: travel restrictions, closing entertainment venues, and banning public gatherings during the early outbreak.12,13 Travel restrictions, however, may be less effective once the outbreak is more widespread.14 There is also a contention that increasing number of daily coronavirus cases are caused by high testing frequency.15,16
In this work, virus containment and testing efforts in India and Indonesia are used in modeling the daily Covid-19 cases. India applies several measures such as sealing the borders by canceling almost all travelling visas, closing schools and colleges in certain states, and applying a nation-wide lockdown starts in effect on 25th March till 3rd May 2020.17,18 Indonesia's government has resisted a full national lockdown. Instead, a Large-Scale Social Restrictions (in Indonesian language: Pembatasan Sosial Berskala Besar) was approved on the 31st March 2020. DKI Jakarta province was the first to practice it on the 7th April 2020.19 On the 13th April 2020, central government required provincial and regional governments to follow national policies in their response to COVID-19.20 On the 24th May 2020, the president of Indonesia announced the term “new normal” for economic recovery badly affected by the large-scale social restrictions.21 The “new normal” is a condition where people should apply strict health protocol such as: wearing face masks, maintaining a physical distance, and washing hands with sanitizer.22
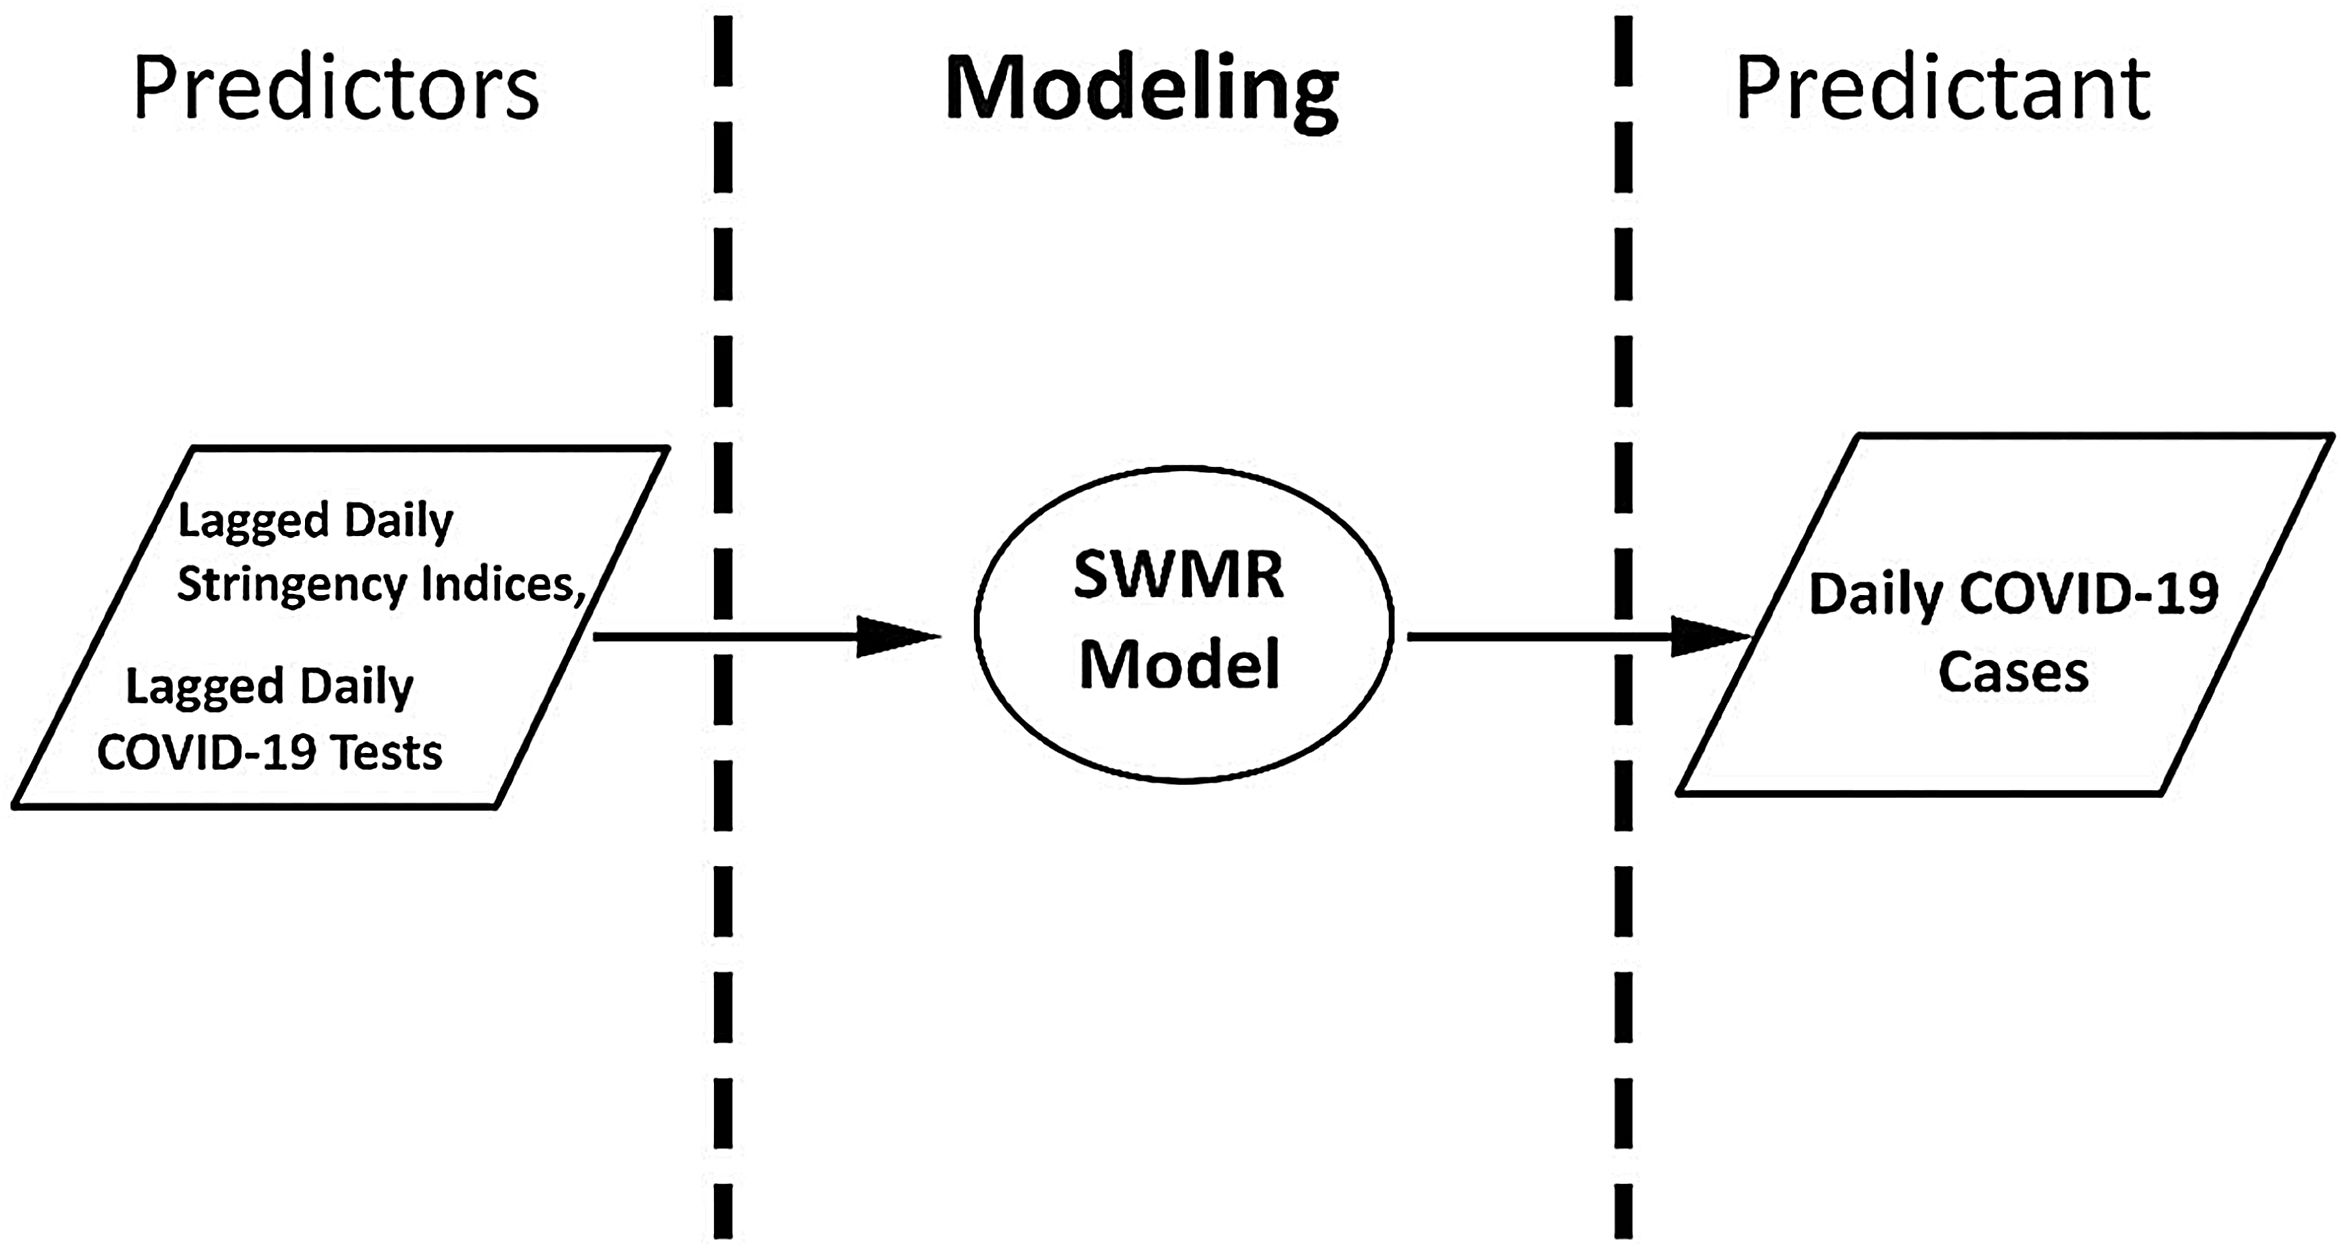
The model uses for examining the effect of testing and containment efforts on daily Covid-9 confirmed cases is a Stepwise Multiple Regression (SWMR). The inputs or predictors are lagged daily stringency indices (SI) and COVID-19 tests (T). The stringency index is a composite measure of several response indicators that includes school closures, workplace closures, travel bans, public gathering restrictions, and stay at home requirements.23 The model is developed and tested for data before the epidemic peak.24 The model is then verified using two prediction skill metrics: predictability (R2) and root mean squared error (RMSE). Here R is the correlation coefficient between observations and predictions.
MethodsStudy sitesThis work attempts to determine significant factors affecting the daily COVID-19 cases in Indonesia and India. All datasets for developing the model are using observations from 23rd March to 27th May 2020.
Data acquisitionAll data used in developing the model are publicly available. These data sets can be accessed from the Our World in Data website.25 These data sets are converted into days-lagged data. The lagged days are from the previous 14-days to the present day. For instance, SI-14 and SI0 represents the SI value at 14 days before the present day and the SI at the present day, respectively (see Table 1). Both the lagged daily COVID-19 tests and daily COVID-19 cases are smoothed using a 7-day moving average.
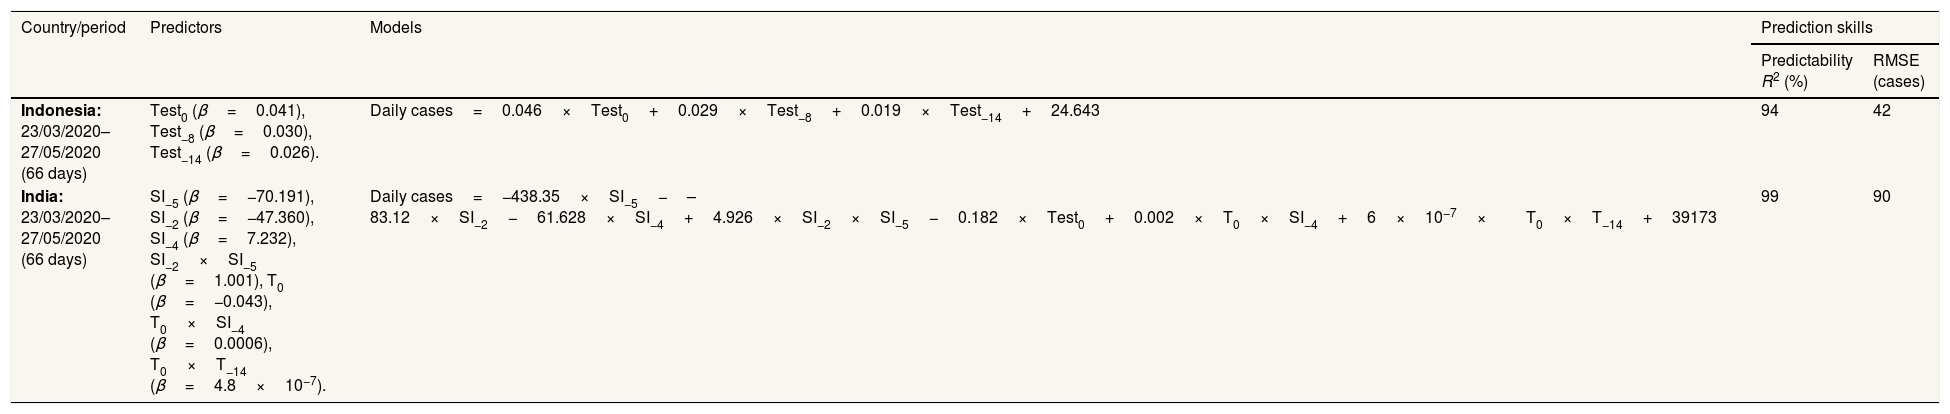
Lagged predictors used in the models sketched in Fig. 1 and their resulting skill in predicting the daily COVID-19 cases. The model's skill is determined using the determination coefficient R2 and RMSE.
| Country/period | Predictors | Models | Prediction skills | |
|---|---|---|---|---|
| Predictability R2 (%) | RMSE (cases) | |||
| Indonesia: 23/03/2020–27/05/2020 (66 days) | Test0 (β=0.041), Test−8 (β=0.030), Test−14 (β=0.026). | Daily cases=0.046×Test0+0.029×Test−8+0.019×Test−14+24.643 | 94 | 42 |
| India: 23/03/2020–27/05/2020 (66 days) | SI−5 (β=−70.191), SI−2 (β=−47.360), SI−4 (β=7.232), SI−2×SI−5 (β=1.001), T0 (β=−0.043), T0×SI−4 (β=0.0006), T0×T−14 (β=4.8×10⁻⁷). | Daily cases=−438.35×SI−5−–83.12×SI−2−61.628×SI−4+4.926×SI−2×SI−5−0.182×Test0+0.002×T0×SI−4+6×10⁻⁷×T0×T−14+39173 | 99 | 90 |
All data sets are provided in Supplementary data which includes: lagged daily stringency indices, lagged daily COVID-19 tests, and daily COVID-19 cases. The stringency indices are based on a combination of several policies taken by governments such as school closures, travel bans, public gathering restrictions, etc. on a scale from 0 to 100. Here the scale of 100 is the strictest response.23
Associated with daily COVID-19 cases based on p-value of 0.01. The prediction skill of models is summarized in Table 1.
Data modelling and predictionOur model uses lagged daily Stringency Indices (SI) and lagged daily Testing (T) as predictors and daily COVID-19 cases as its predictant. The predictor/predictant pairs are modelled using a Stepwise Multiple Regression (SWMR; see Fig. 1) available in MATLAB®. The SWMR selects the significant predictors based on the p-value of 0.01. The selected predictors are arranged in descending order based on their standardized β coefficients where the strongest predictor appears first in Table 1.

Our models use lagged daily stringency index (SI) and lagged daily testing (T) and their associated skill as predictors and daily COVID-19 cases used as model inputs or predictors. Our models use the SWMR (stepwise multiple regression) subroutine for selecting a set of significant predictors.
The skills of both models described above in predicting the daily COVID-19 cases are measured using predictability—the coefficient of determination R2 and RMSE. The modelling scheme and the model skills are presented in Fig. 1 and Table 1.
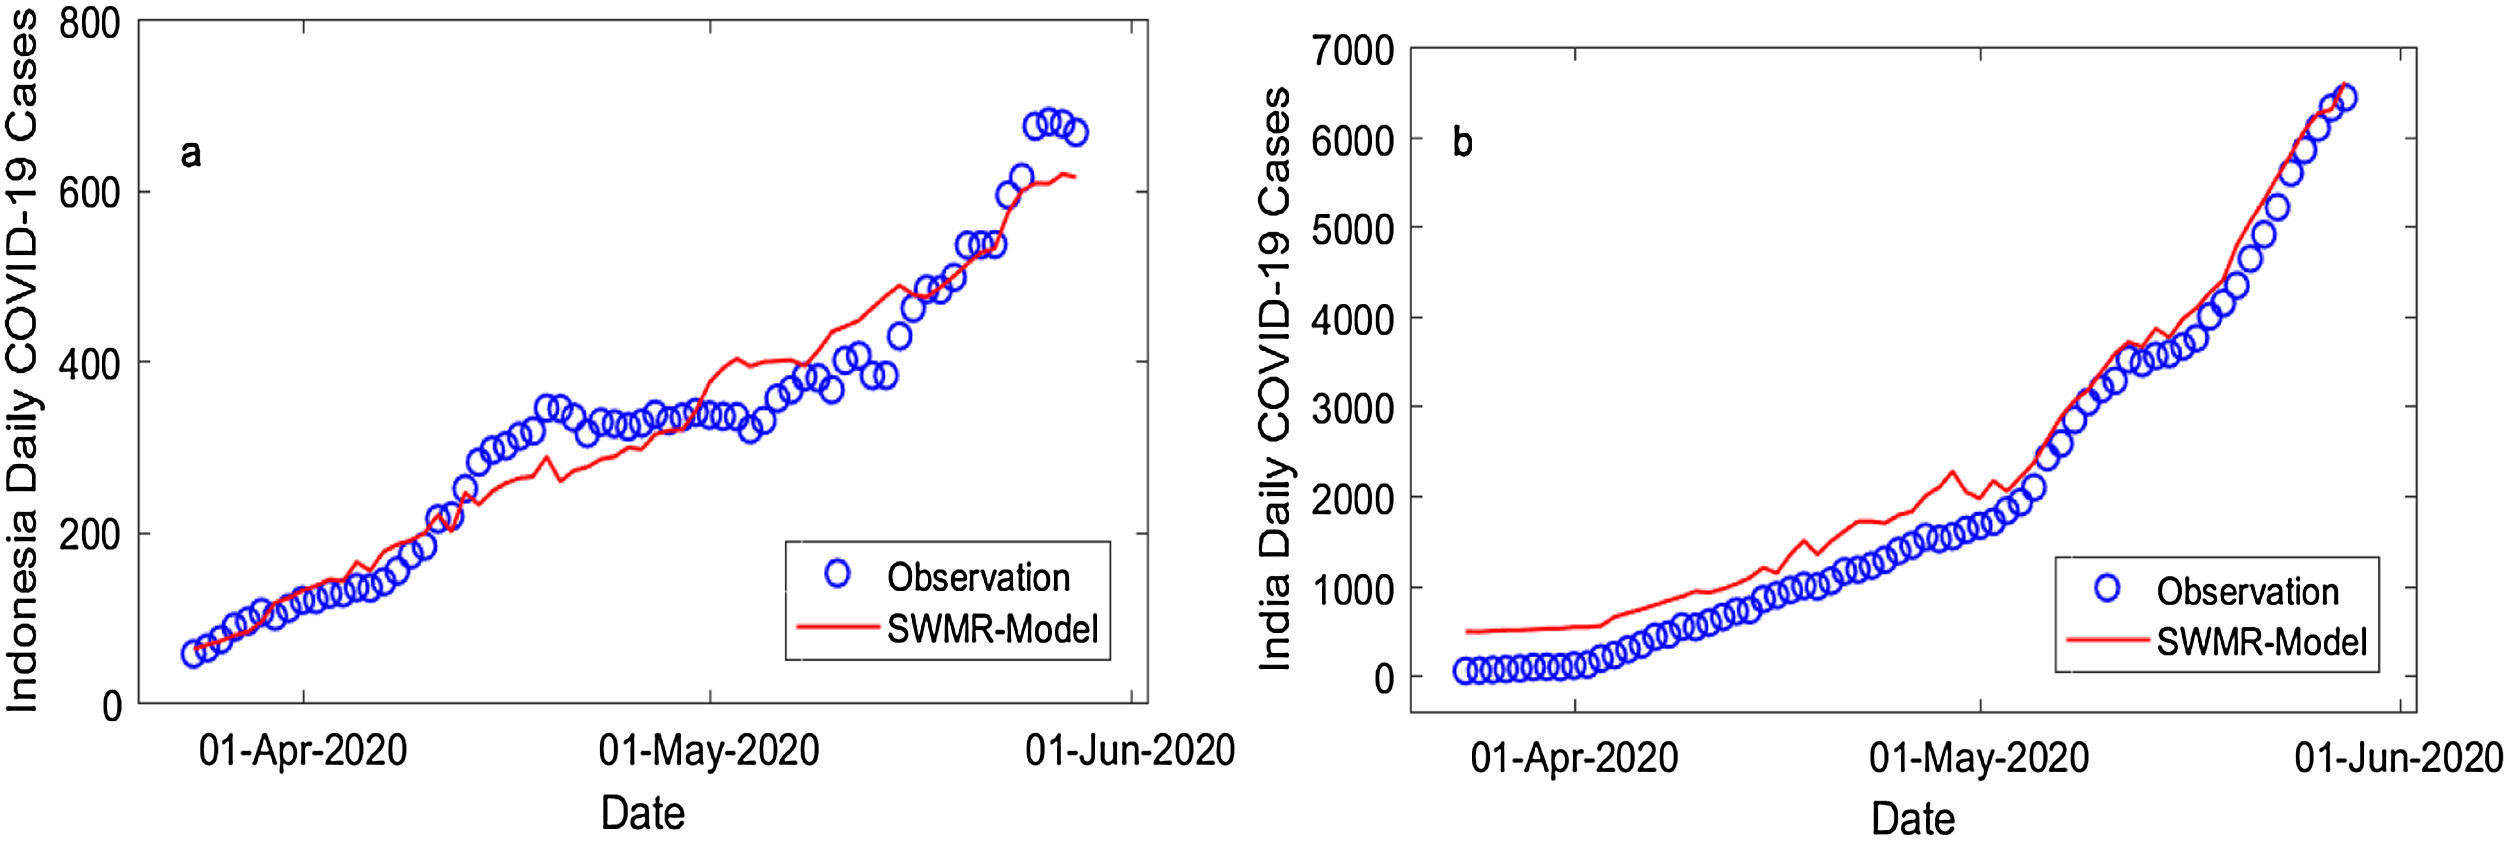
Result and discussionThe prediction skill of the models used for the Indonesia and India daily COVID-19 confirmed cases are summarized in Table 1. Table 1 shows significant factors that are related to the daily COVID-19 cases. It also shows the predictability of models is high, i.e. above 90% (see Fig. 2). The strength of the significant factors is determined by the standardized coefficient β.

The significant factors affecting daily COVID-19 cases in Indonesia are the daily COVID-19 test, i.e. T0, T−8, and T−14. It is found that there is a positive correlation between the numbers of testing daily confirmed cases. This means that as the number of daily COVID-19 tests increases, the number of daily COVID-19 cases rises. On the other hand, it is shown that the Stringency indices effects on daily cases are found to be insignificant. This shows that many people violate the social restriction (PSBB) order. This could be due to their effort to earn some money for the family.26 In addition, applying long period of social distancing and stay at home measures causes loneliness and isolation. As a result, people are forced to leave their homes.27 This brings a dire consequence to Indonesia. Its daily confirmed cases are still on the rise and as of the 5th of September, the daily case is 3128.28
The India model has different sets of significant factors relating to the daily confirmed cases. These factors involve both linear and nonlinear terms. The linear terms are: the previous fifth, second, and fourth days Stringency indices SI−5, SI−2, SI−4 and the present testing T0. The nonlinear terms are the multiplication between two inputs such as: SI−2×SI−5, T0×SI−4, and T0×T−14. There are negative correlations between COVID-19 cases and stringency indices. The daily COVID-19 cases for India is also still rising to 90,600 cases as of the 5th September.29 This rising could be due to people, who lost their livelihoods, abandoned the government rules of staying at home.30 On 8th June 2020, India also slowly began to open up from the coronavirus lockdown (termed as “unlock 1.0”) with an economic focus.31
Two types of containment measures differently practised by Indonesia and India fail to curb the spread of Covid-19. In order to slow-down the virus spread, they have to combine these measures of testing followed by contact-tracing and treatment of the sick, large-scale social restriction and other NPI (non-pharmaceutical interventions) such as face-masking, physical distancing, and hand-washing.32–34
ConclusionsHigh predictability is found in modelling the daily COVID-19 cases in Indonesia and India before their epidemic peaks. Increasing number of daily COVID-19 cases in Indonesia is caused by having more testing while the stringency indices are the leading factors in determining the daily COVID-19 cases in India. Both containment measures, i.e. testing and strict movement, however, fail to slow-down the virus spread. The combination of these measures with other non-pharmaceutical interventions is highly recommended in order to control Covid-19.
Supplementary DataThe supplementary data (the datasets of lagged daily stringency indices, lagged daily COVID-19 tests, and daily COVID-19 cases) can be found on this GitHub repository: https://github.com/Andika9807/supplementary_data_stringency.
Conflicts of interestThe authors declare that they have no conflict of interest.
We thank Our World in Data for providing the daily COVID-19 cases, daily COVID-19 tests, and the stringency indices of Indonesia and India through its website available for the public.
Peer-review under responsibility of the scientific committee of the 3rd International Nursing, Health Science Students & Health Care Professionals Conference. Full-text and the content of it is under responsibility of authors of the article.


