


The 3rd International Nursing and Health Sciences Students and Health Care Professionals Conference (INHSP)
More infoOne way of detecting the heart disease is to determine the presence of abnormalities in PQRST interval on ECG signals. Therefore, it is expected to be used as a preliminary diagnosis of heart health and to prevent or decrease the mortality rate due to heart attack.
MethodsThis paper uses three main processes: data acquisition, signal preprocessing, and feature extraction. The experiment was done to eighteen subjects recorded for 2min in a relaxed condition to obtain P wave points, QRS complexes, and T waves.
ResultBased on the data obtained from the 18 subjects, the average accuracy of point P detection is 98.31%, point Q=98.7%, point R=99.12%, point S=86.27%, and point T=97.99%.
ConclusionThe extraction of used features proved capable of detecting P waves, QRS complexes, T waves, as well as the amount of heart rate on all subjects.
An electrocardiogram (ECG) is a graph of voltage versus time of the electrical activity of the heart using electrodes placed on the skin.1 ECG analysis is done to determine the condition of cardiac arrhythmias, atrial and ventricular hypertrophy, myocardial ischemic and infarction, the effects of drugs, and the assessment of pacemaker functions.2,3
According to WHO (World Health Organization), heart disease is one of the leading causes of death in the world.3-6 Therefore, the making of this PQRST and heart rate detection tool is expected to be used as a preliminary diagnosis of heart health and to prevent or decrease the mortality rate due to heart attack.
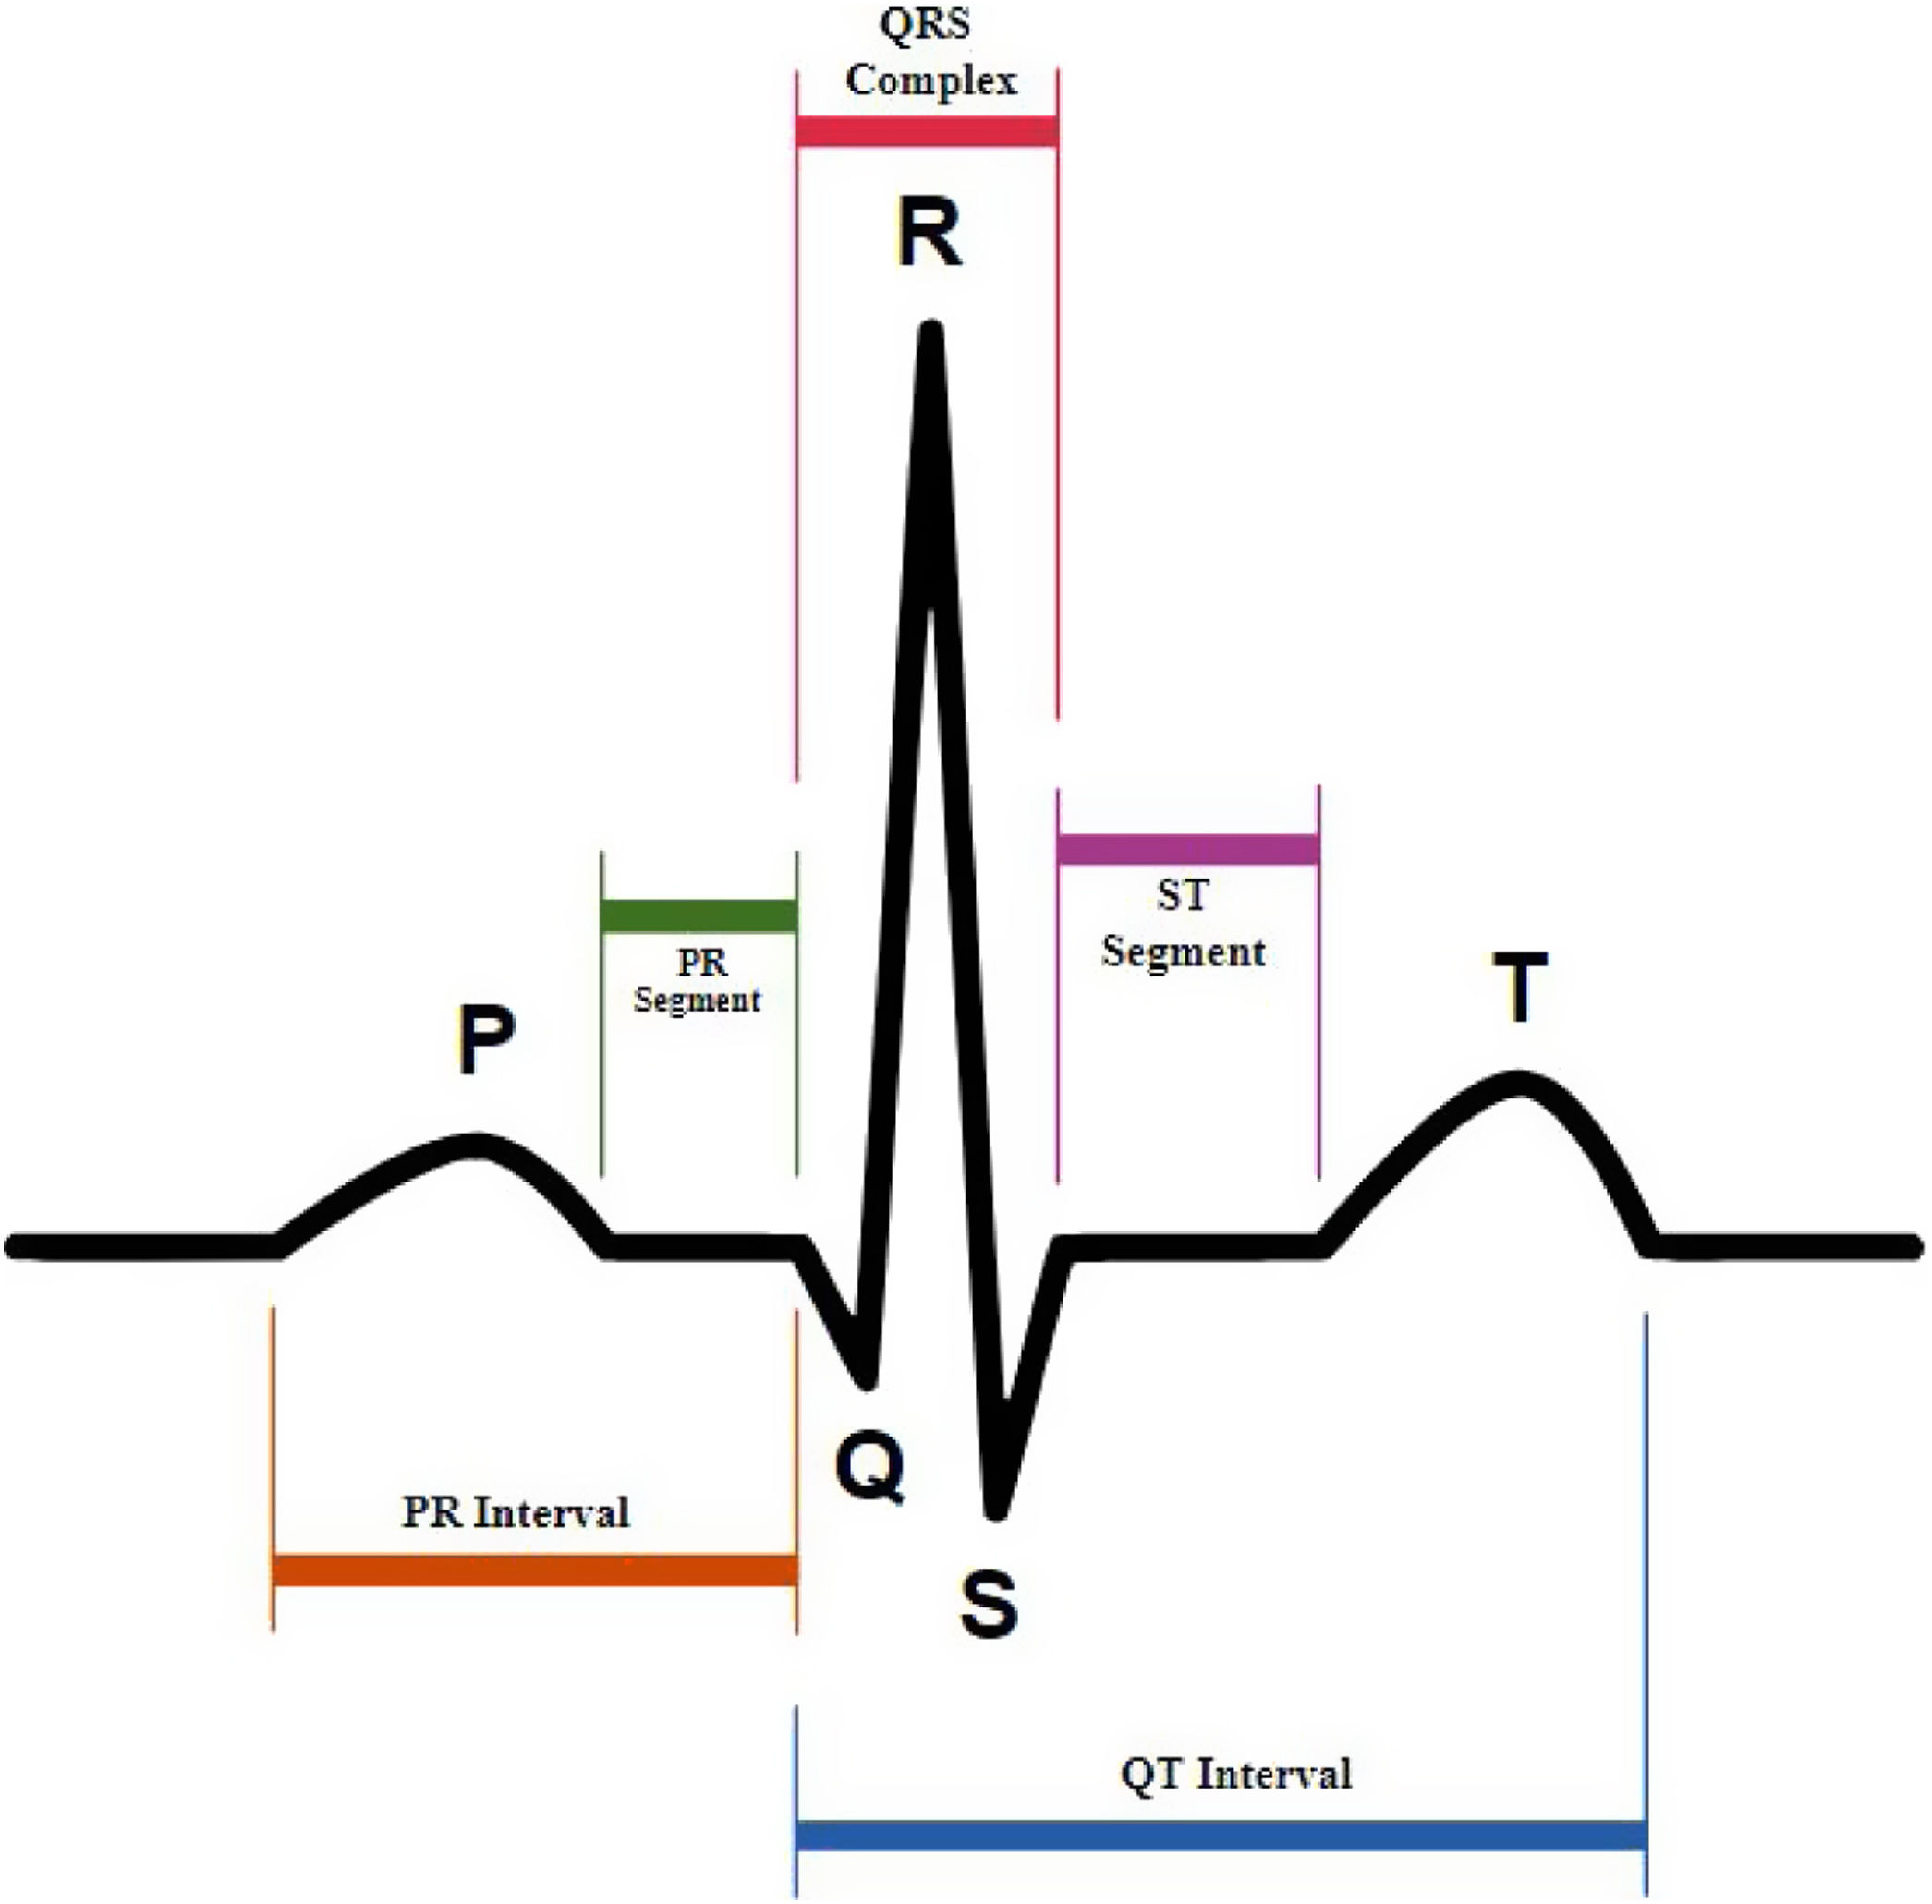
ECG signals consist of several waves representing various activities as shown in Fig. 1.7,8 There are ECG waves, namely:
- 1.
P wave, an image arising from the depolarization of the atrium. This wave is ≤0.3mV when the heart is in a normal state. It has a width of ≤0.12s. This wave always has positive value in lead II and always has negative value in aVR.
- 2.
QRS wave, an image arising from the depolarization of the ventricle. When the heart is in a normal state, this QRS wave has a width of 0.06–0.12s, and its height depends on the lead being measured.
- 3.
T wave, a wave arising from the repolarization of the ventricle. In a normal heart condition, T wave has positive value in all leads.
- 4.
PR interval, measured from the beginning of P wave – QRS wave. In a normal heart condition, this wave is 0.12–0.20s of width.
- 5.
ST segment, measured from the end of QRS wave – the beginning of T wave.

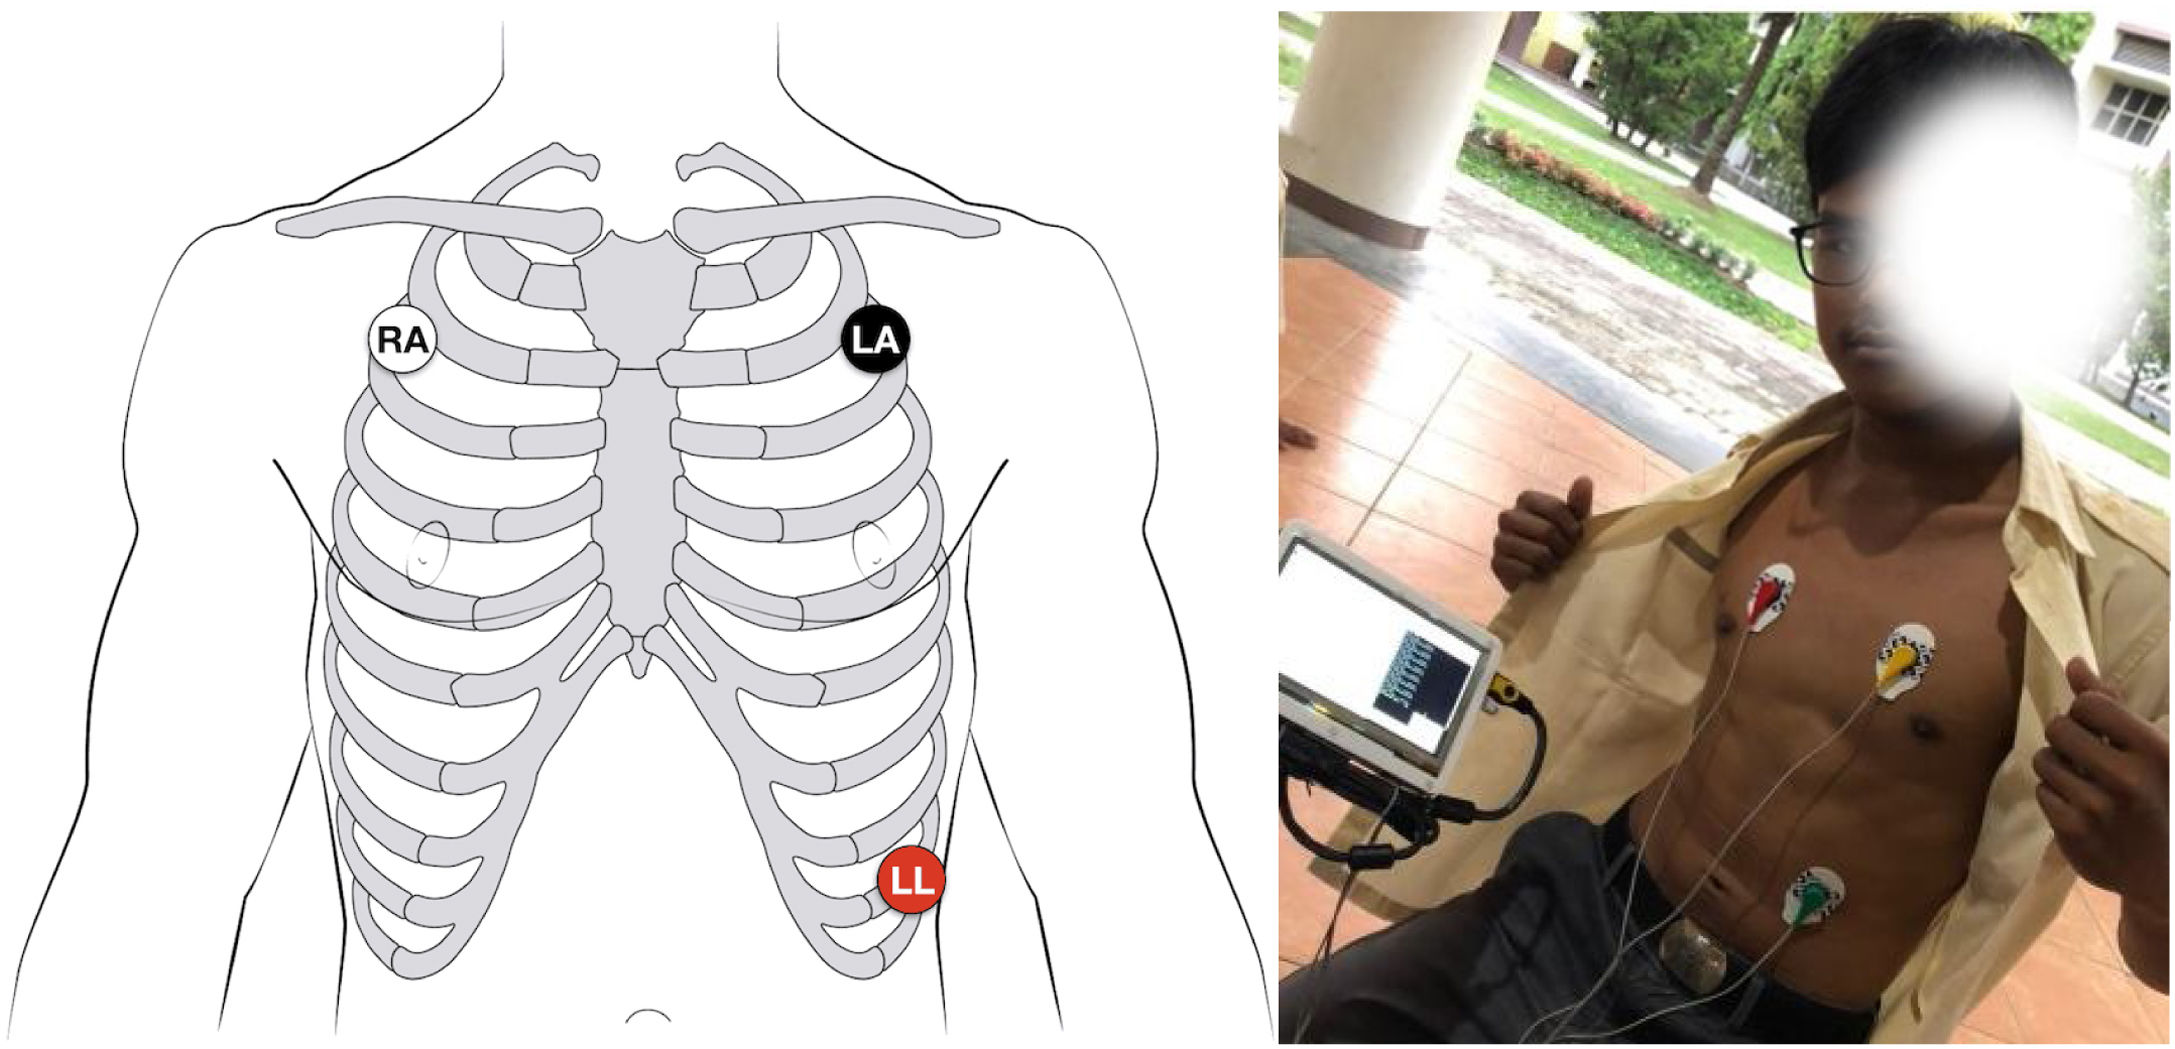
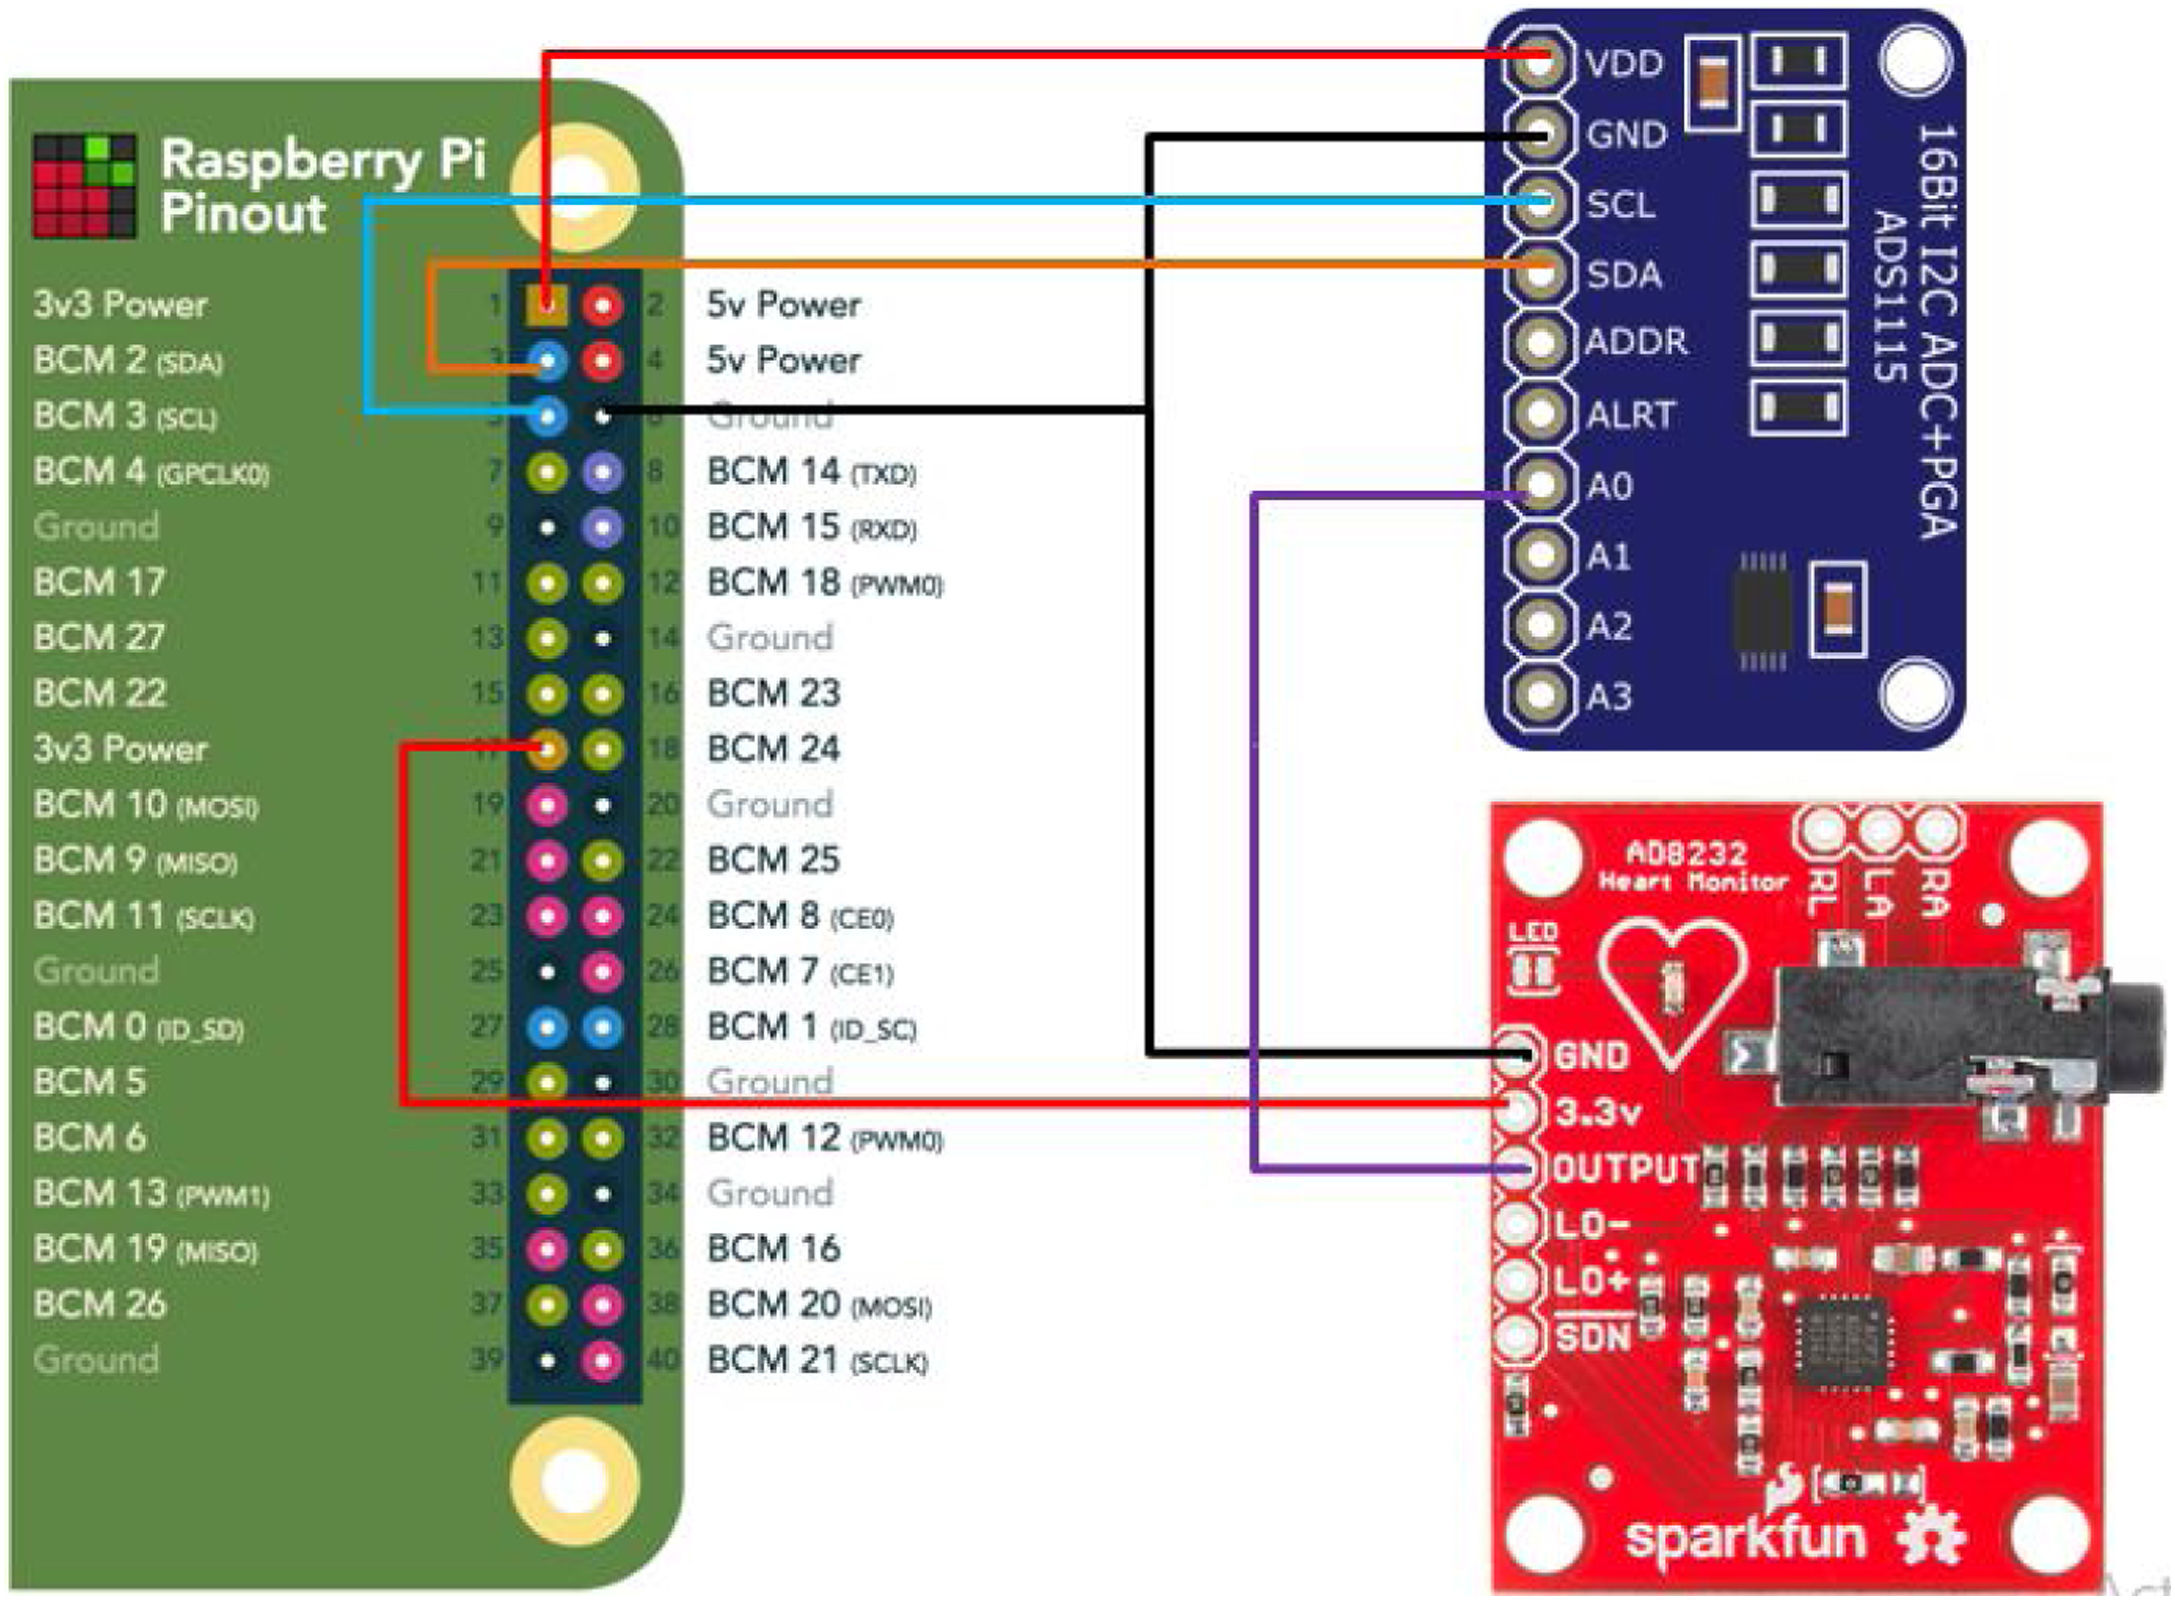
Signal acquisition is a process of retrieving data on the electrical activity of the heart from each lead. The signal recording process uses 3 electrodes connected to the AD8232 module. The ECG signal read by AD8232 will be received and recorded by Raspberry Pi. In the experiment process, the lead must correctly be installed so that there is no signal error and no noise on ECG signals.
Experiment preparationIn this research, there are 18 subjects from which the ECG signals are taken. The subjects are males and females aged 18–22 years old, and each is recorded in relaxed condition. For data retrieval, portable ECG equipment consisting of Raspberry Pi+LCD, electrode, AD8232 module and others is needed.
The lead used in the process of ECG signal retrieval is a 3-lead electrode system because all waves, namely PQRST waves, will be seen in this lead, and the diagnosis experienced by the subject will be determined faster. Fig. 2 shows how ECG electrode is mounted on the subject.
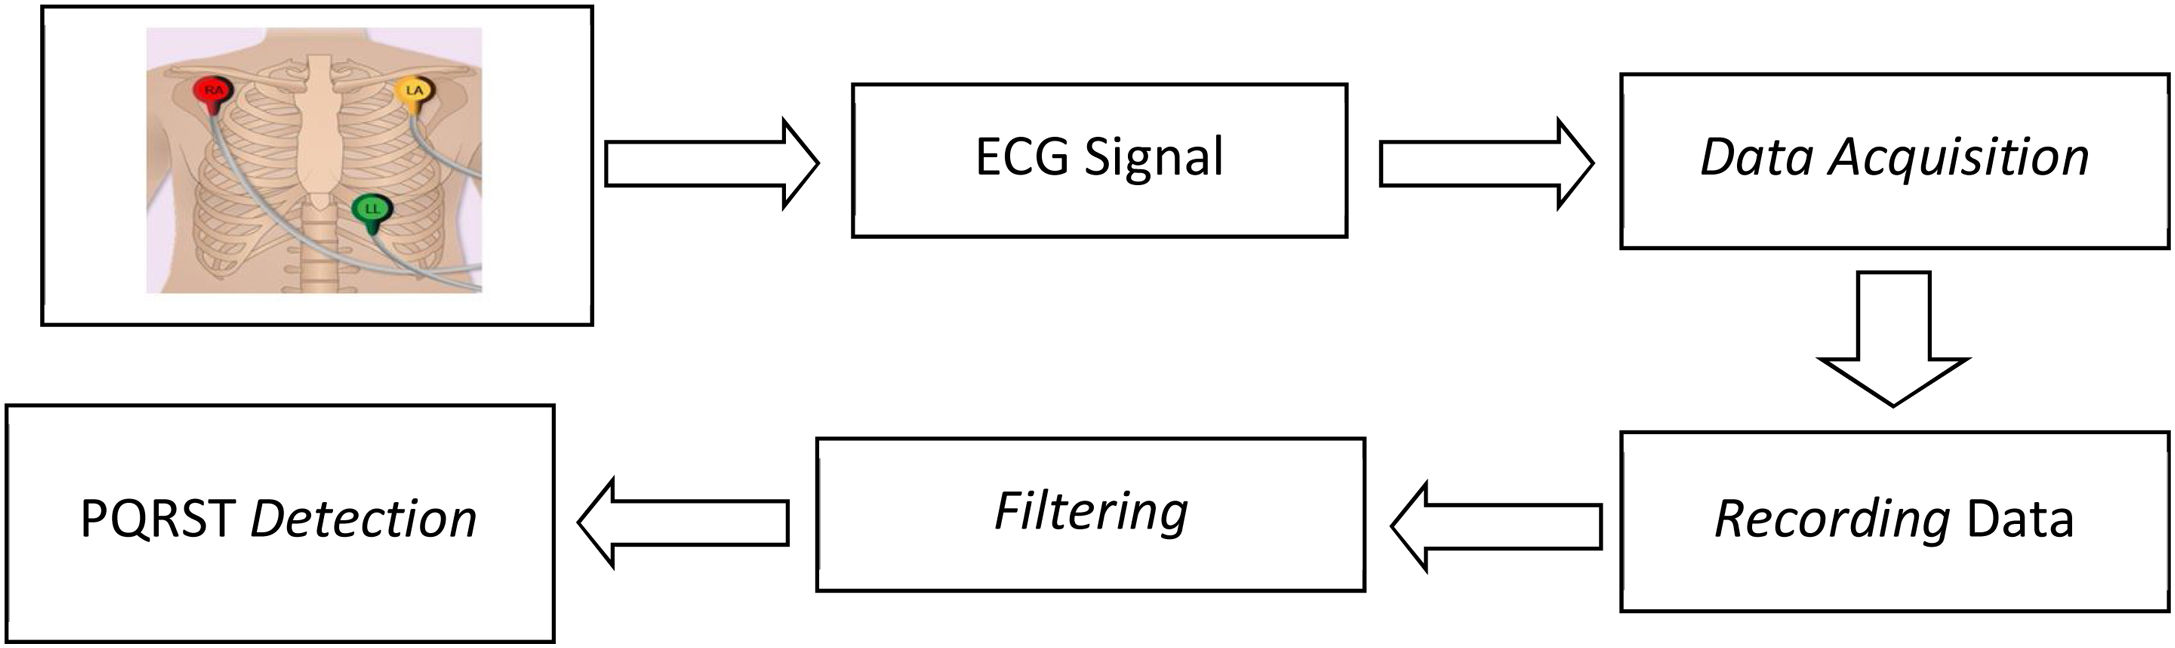
Block diagrams and flowchart
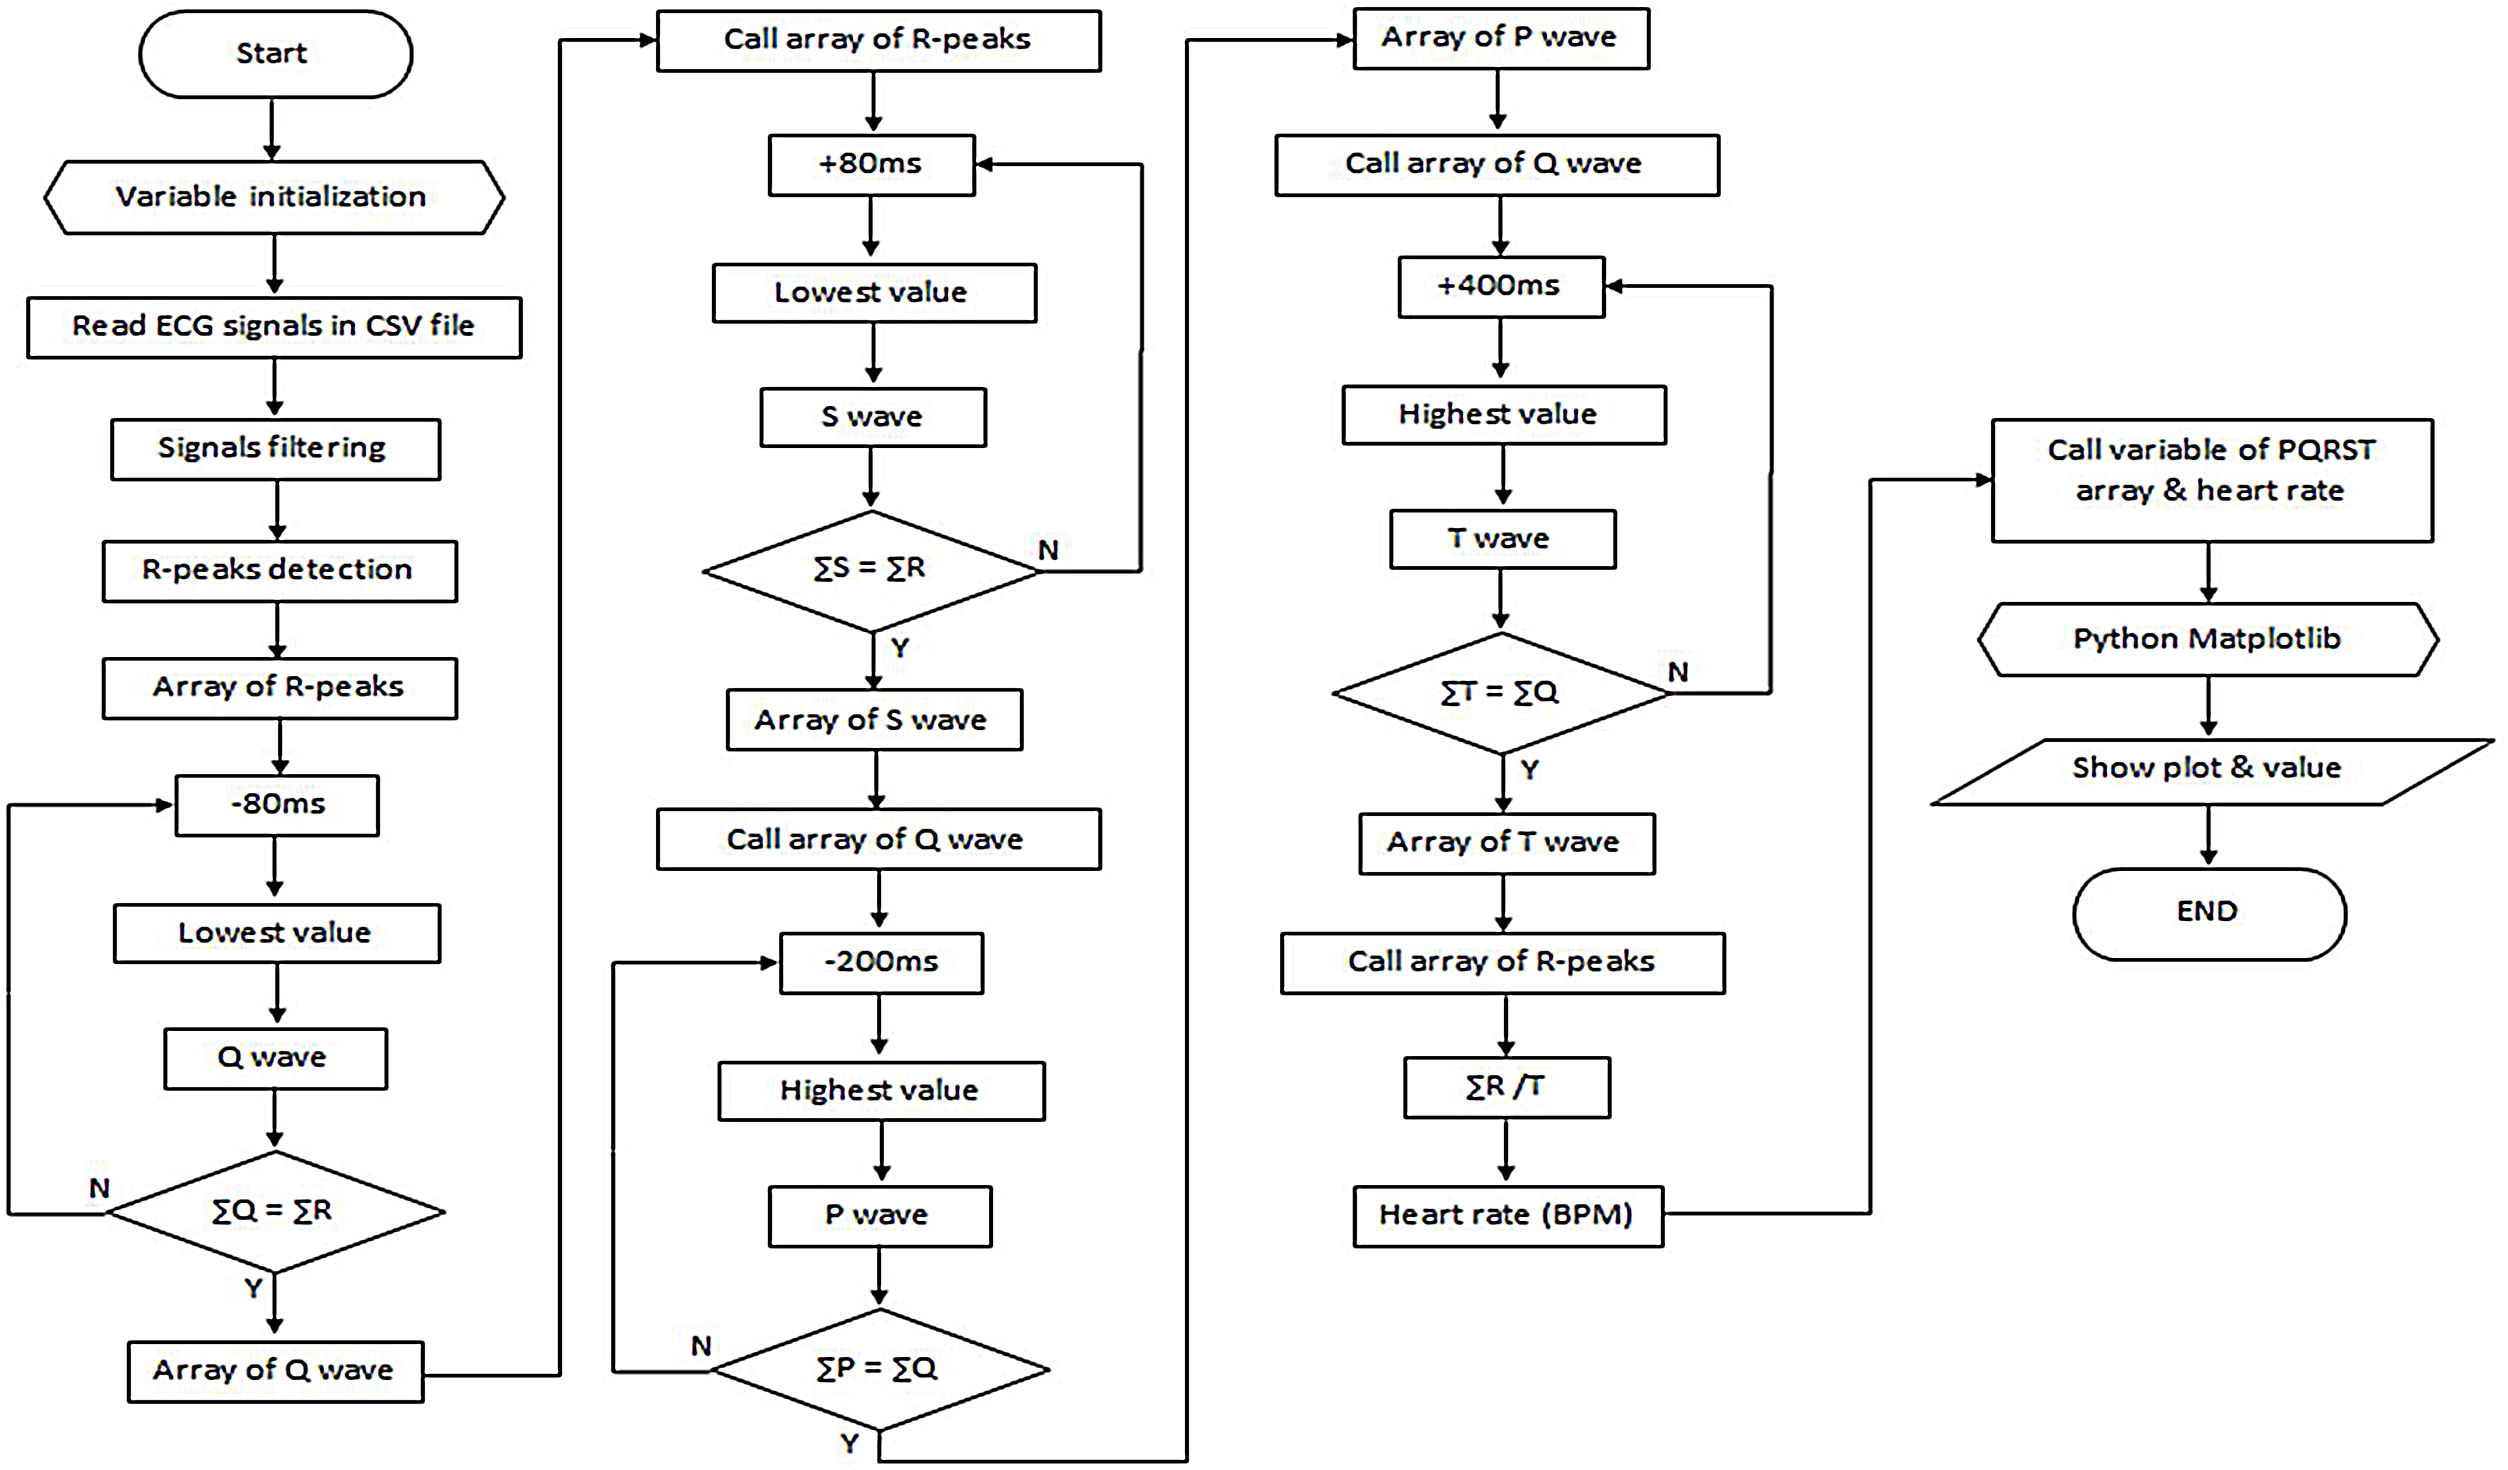
In this research, the method used to display PQRST waves can be seen in Figs. 3 and 4:


Here is how PQRST is determined9–12:
- 1.
Signal is filtered with FIR and bandpass with cut-off frequency of 3–45Hz.
- 2.
After the signal is filtered, R-peaks are detected by using Hamilton Segmenter.
- 3.
The number of R-peaks is next accumulated and divided by the recording time to obtain the heart-rate value in BPM (beats per minute).
- 4.
From each R-peaks point, Q point is obtained by detecting the lowest signal value in the interval of 80ms before R point, while S point is obtained by detecting the lowest signal value in the interval of 80ms after R point. Thus, QRS complex is obtained.
- 5.
P wave is obtained by detecting the highest signal value in the interval of 200ms before Q point.
- 6.
T wave is obtained by detecting the highest signal value in the interval of 400ms after S point.
The figure above is the wiring diagram of the heart rate detection tool using Raspberry Pi 3b controller. From Fig. 5, it can be seen that the output of AD8232 is connected to ADS1115, which shows that the value of AD8232 is not directly processed by Raspberry, but must first be converted to digital data to be processed by Raspberry. In the ADS1115 module, there are 4 ADC channels (A0–A3), in this tool, the channel used is A0 channel.
Signal filterAnalog filter
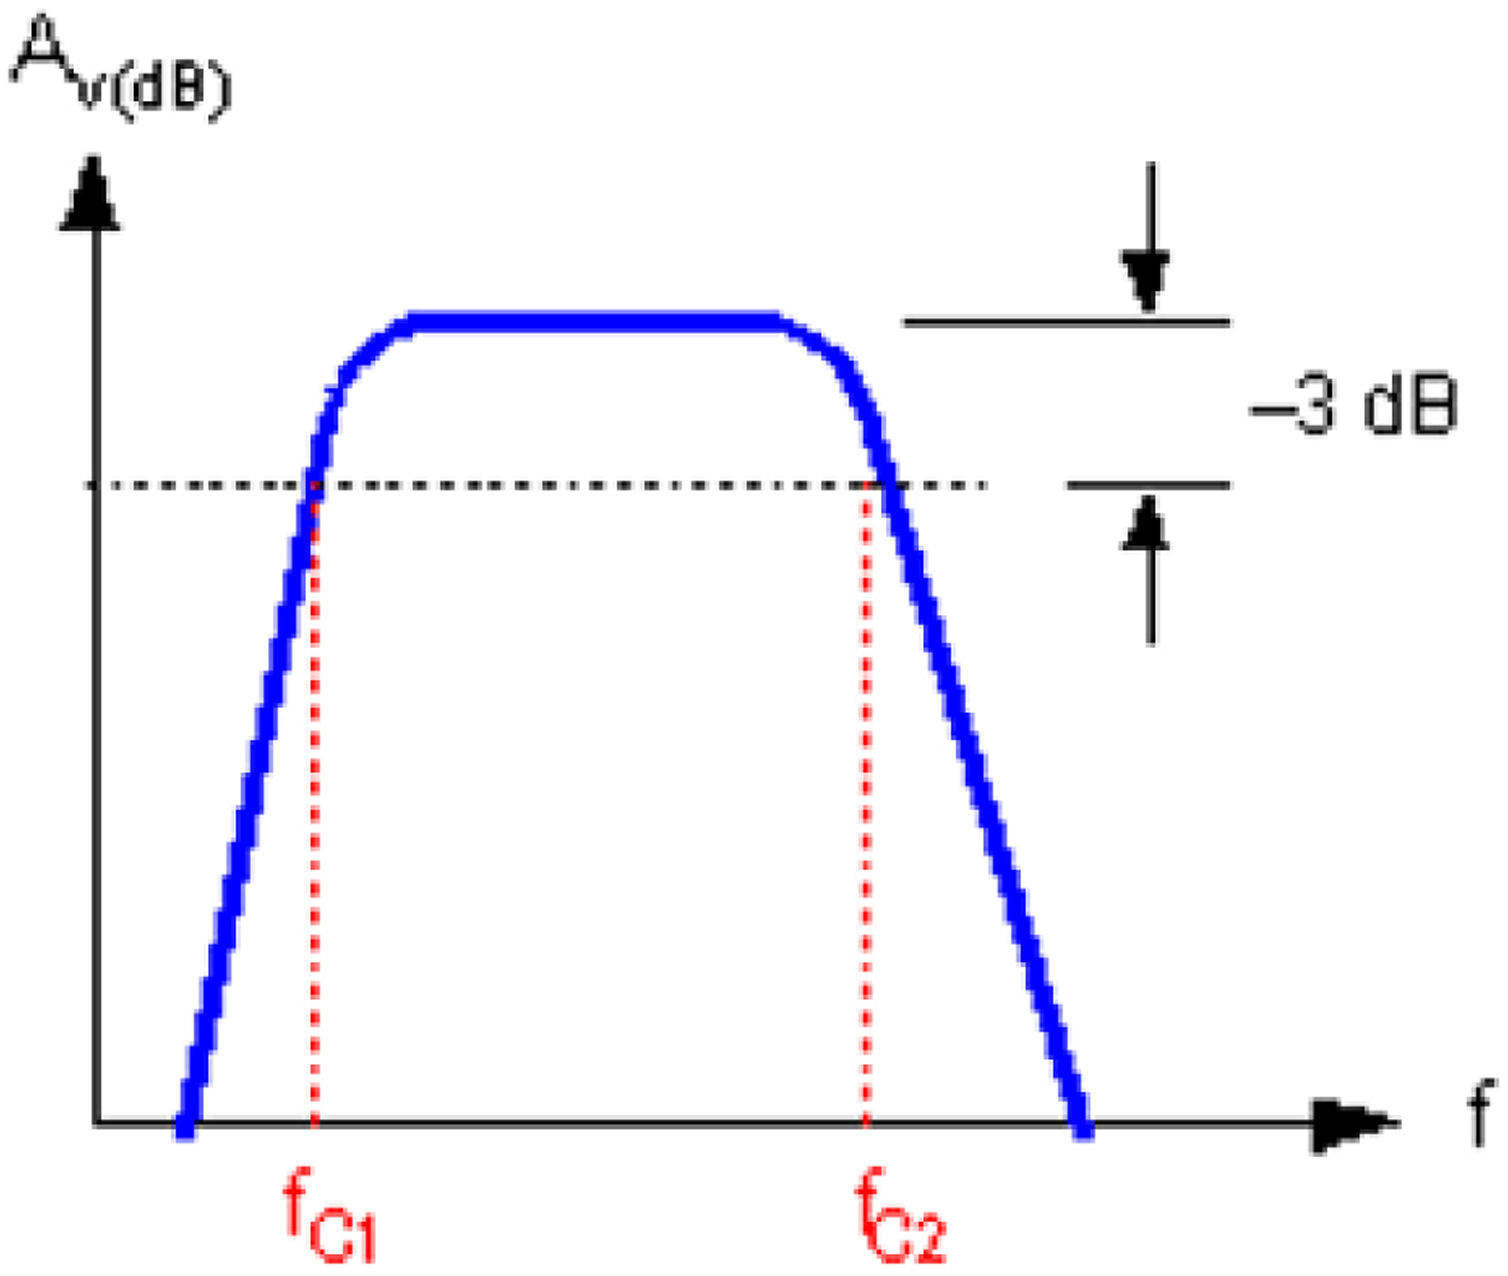
Analog filter is frequently used to pass the wanted frequency or to block the unwanted frequency. Analog filter used in this system is band pass filter (BPF), which is a combination of high pass filter (HPF) and low pass filter (LPF) so that it has the response of signal passing with the frequency between cut off frequency (Fc1 and Fc2) and dampens the signal that has a frequency outside the cut off frequency (Fig. 6).
Digital filter
Digital filter is a mathematical/algorithm procedure that processes the digital input signals and generates the digital output that has certain characters based on the purpose of the filter. Based on the impulse response, digital filter is divided into two: IIR (infinite impulse response) digital filter and FIR (finite impulse response) digital filter.
IIR filter is a filter that has feedback or has the character to update the previous filter results. FIR filter is one type of digital filter that is used in the digital signal processing (DPS) application. This filter is referred to as finite because there is no feedback in this filter. If an impulse (i.e. a ‘1’ signal followed by many ‘0’ signals) is entered, zero signal will exit after signal 1 passes all delay lines with its coefficient. The advantages of FIR filter include being stable and having linear phase. While the disadvantage is that FIR filter sometimes requires more memory and/or calculations to achieve the characteristics of the given filter response. Also, certain responses are not easy to implement with FIR filter.
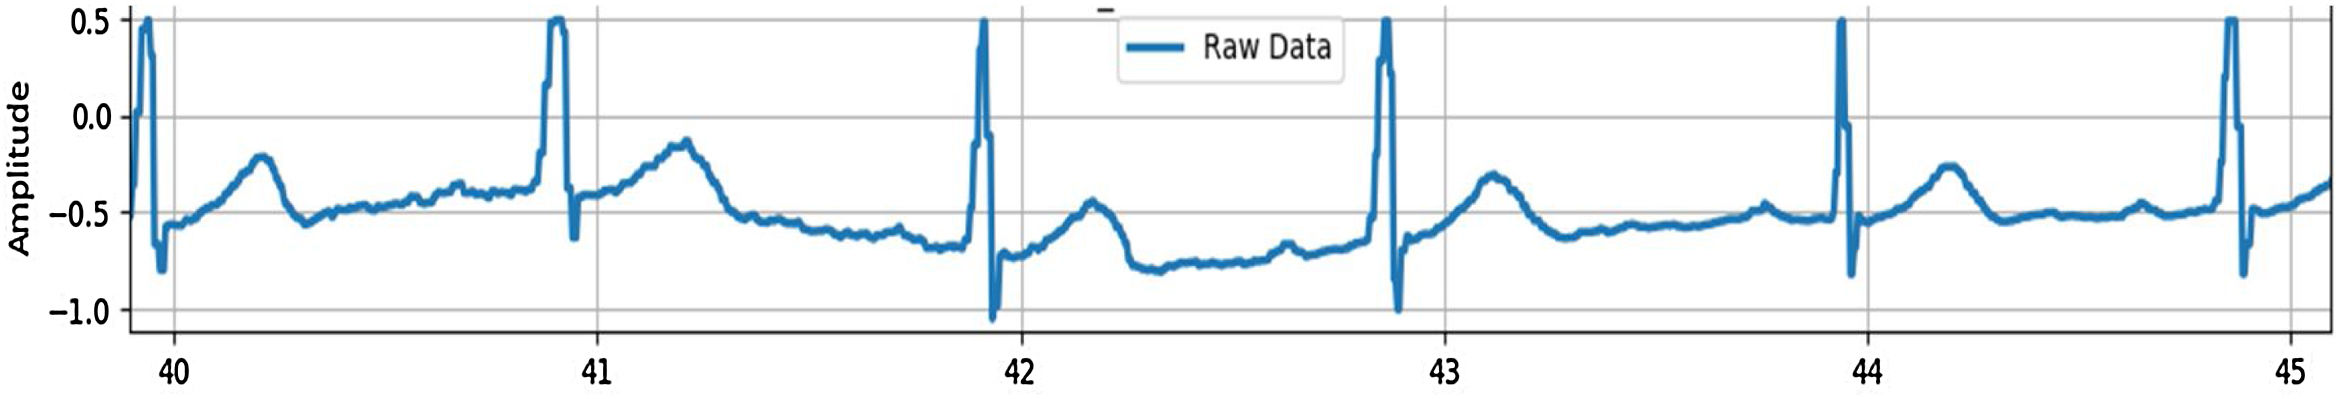
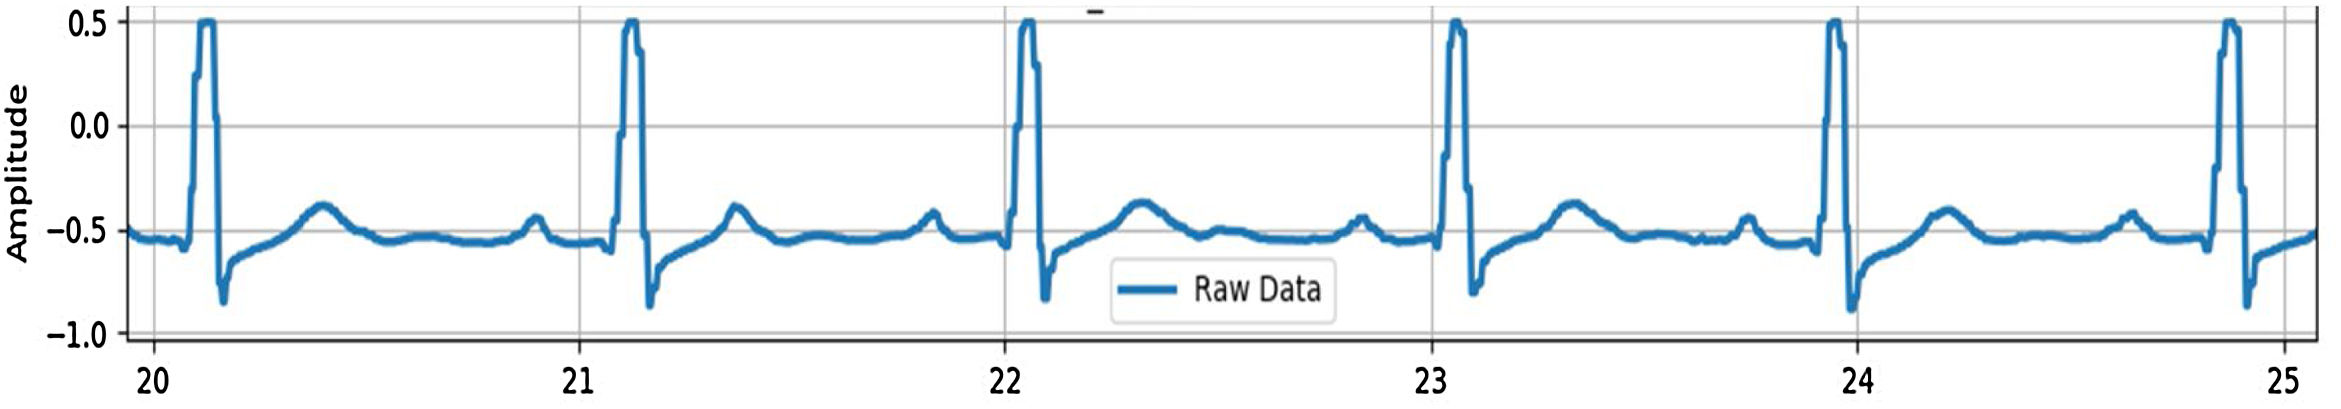
ResultRaw data recordingRaw data recording is the result of ECG signal recording that has not undergone the signal processing process or still contains interference or noise. Raw data recording for subject 13 and subject 14 can be seen in Figs. 7 and 8.
Signal filter

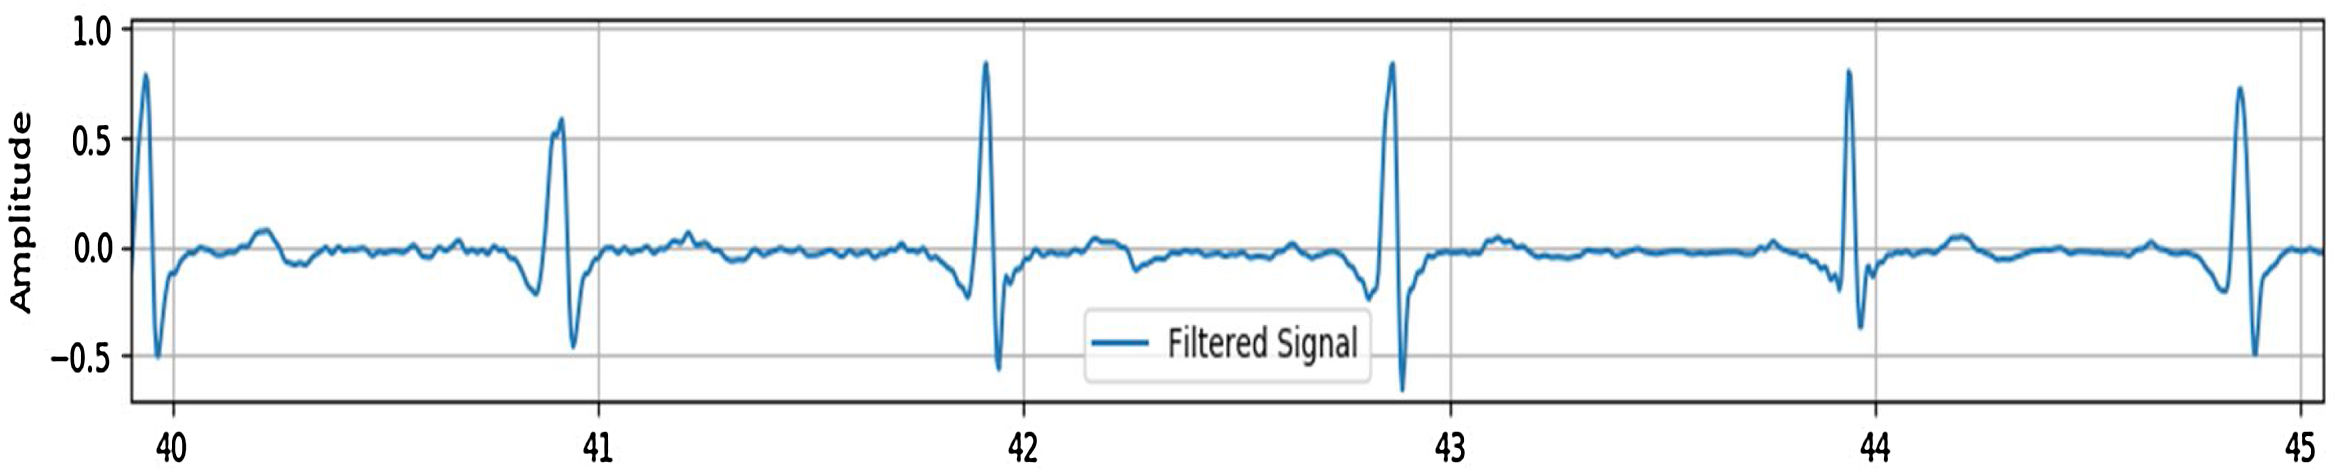
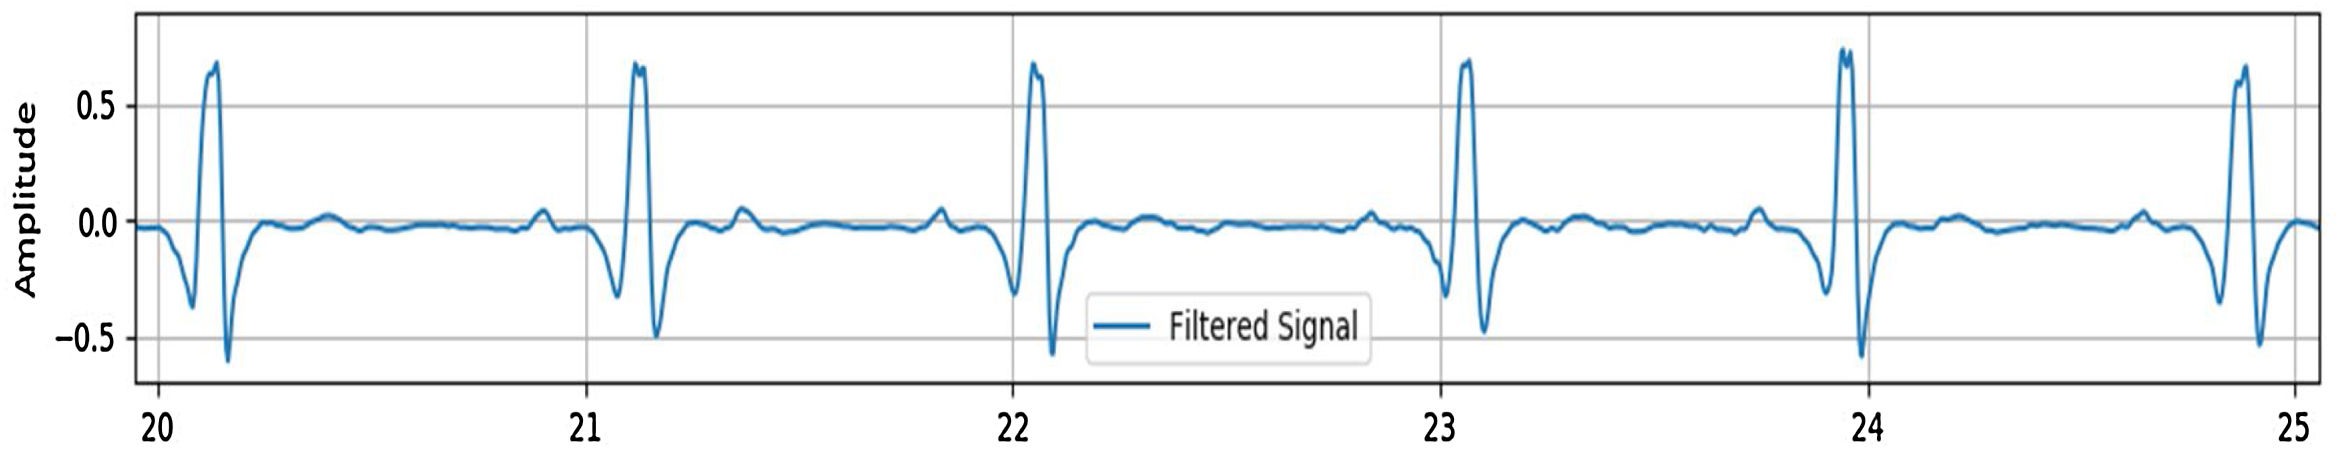
In ECG signal filter, the type of filter used is the FIR bandpass filter, with a frequency of 3–45Hz. The signal that has been filtered looks like that in Figs. 9 and 10.
PQRST waves

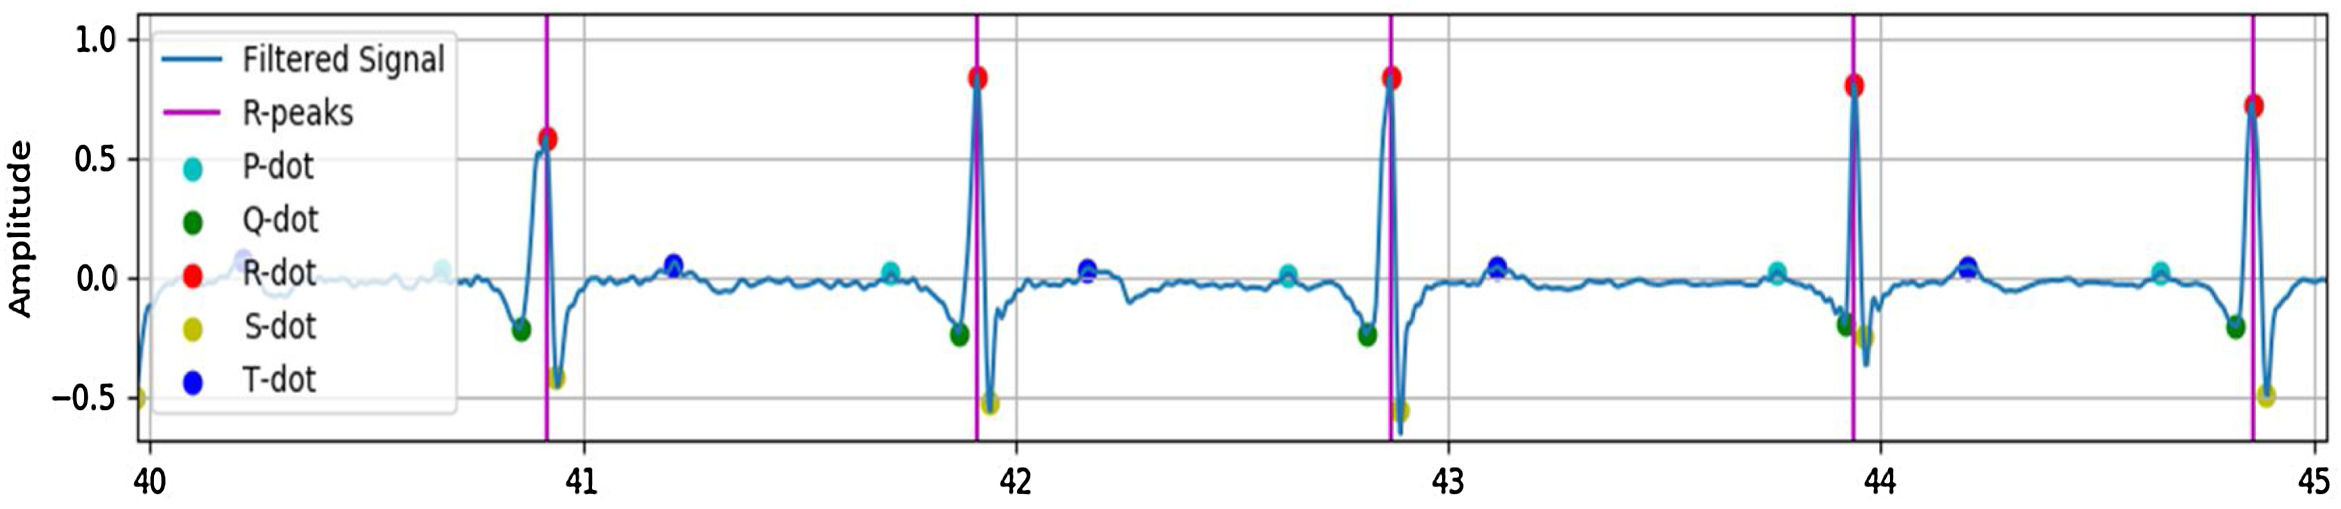
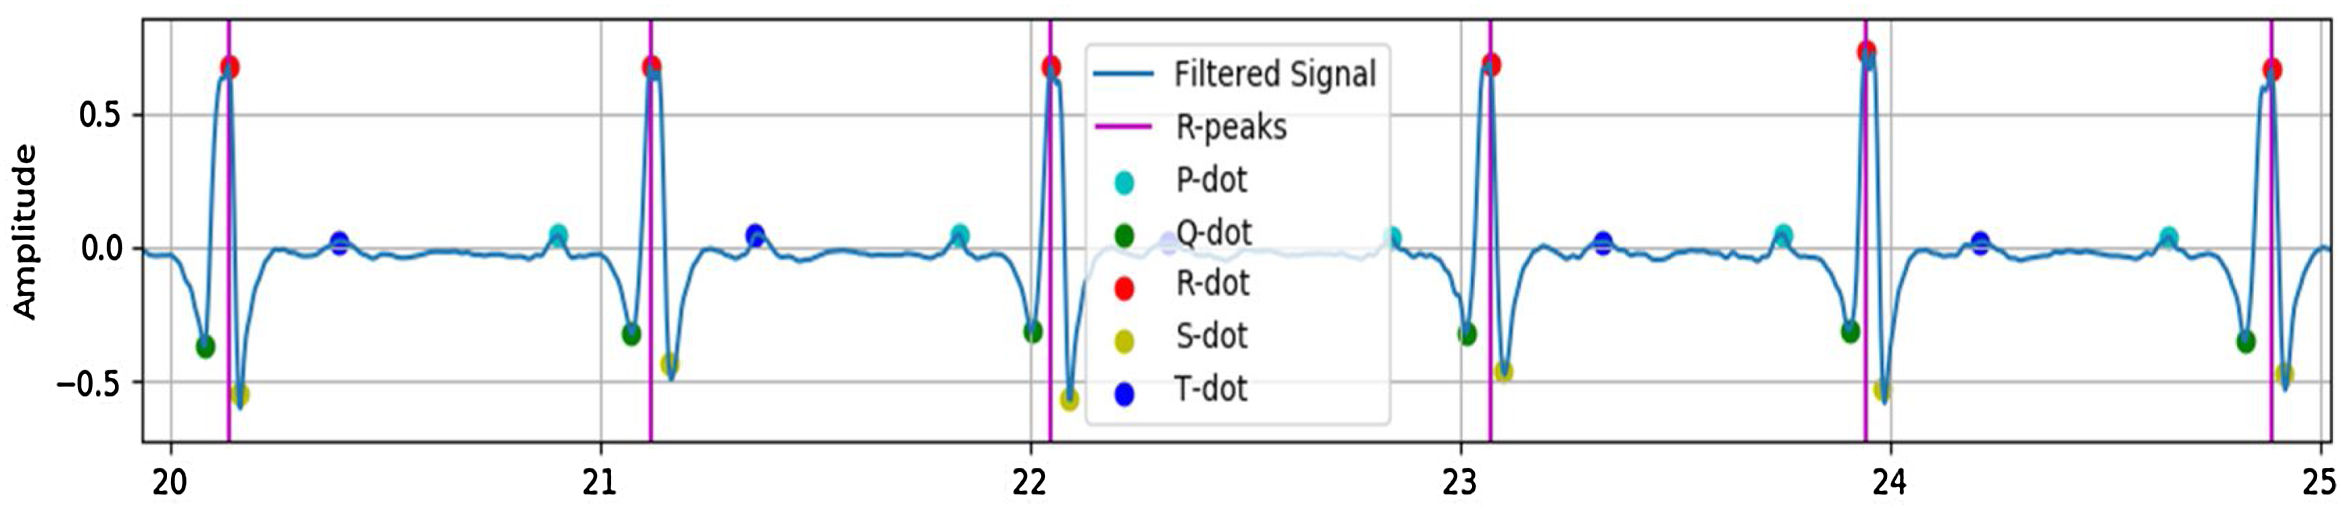
The data resulted in the filtering process will next be processed to determine the PQRST wave on ECG signal. The PQRST detection results can be seen in Figs. 11 and 12.


As seen in the image above, the P, Q, R, S, T wave points can be marked with different color points, where the light blue dots indicate P wave, the green indicates the Q wave, the red indicates the R (R peaks) wave accompanied by a purple vertical line, a yellow color indicating the S wave, and a dark blue color indicating a T wave. If seen directly, it can be seen that the QRS wave form is almost exactly the same as described in the previous chapter i.e. in Fig. 3.2, which means that the tool is made effectively enough to detect PQRST waves in the heart.
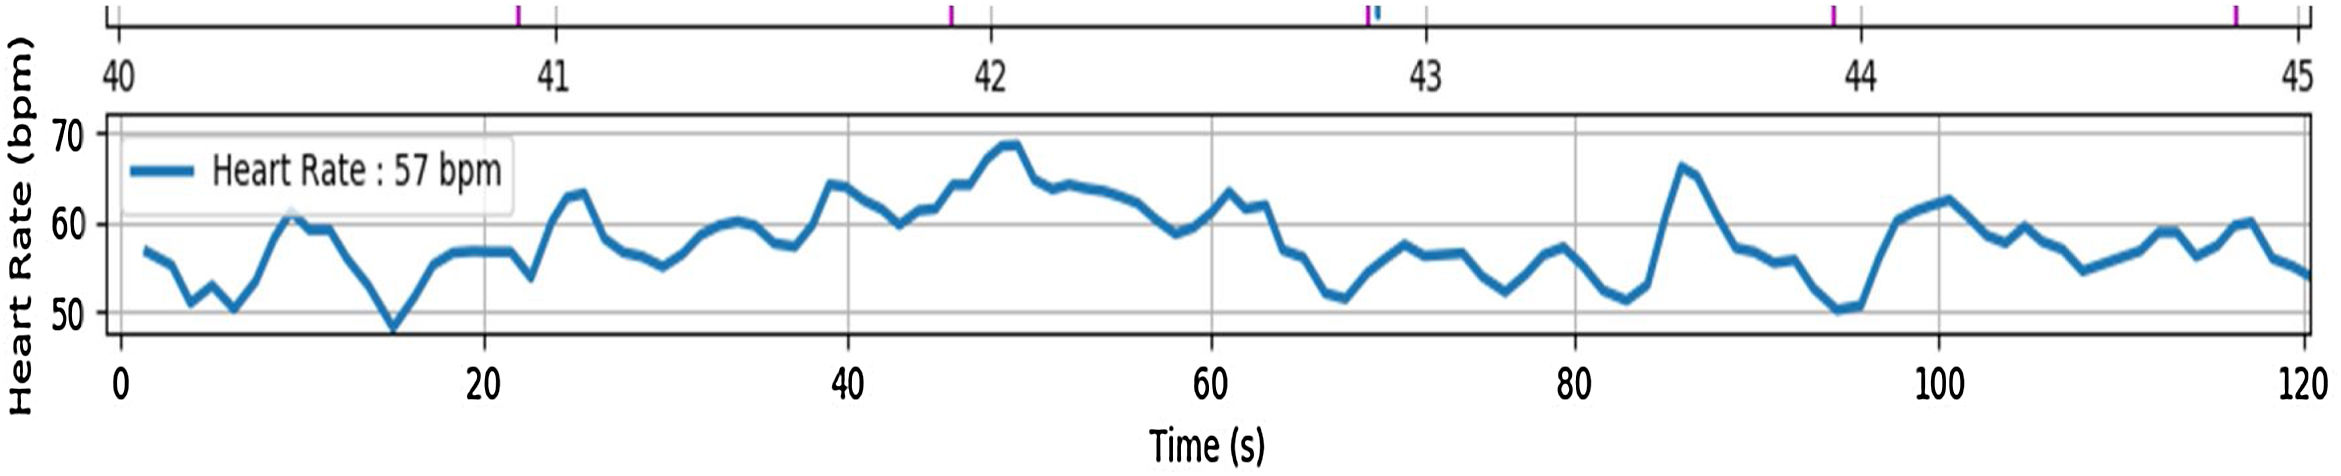
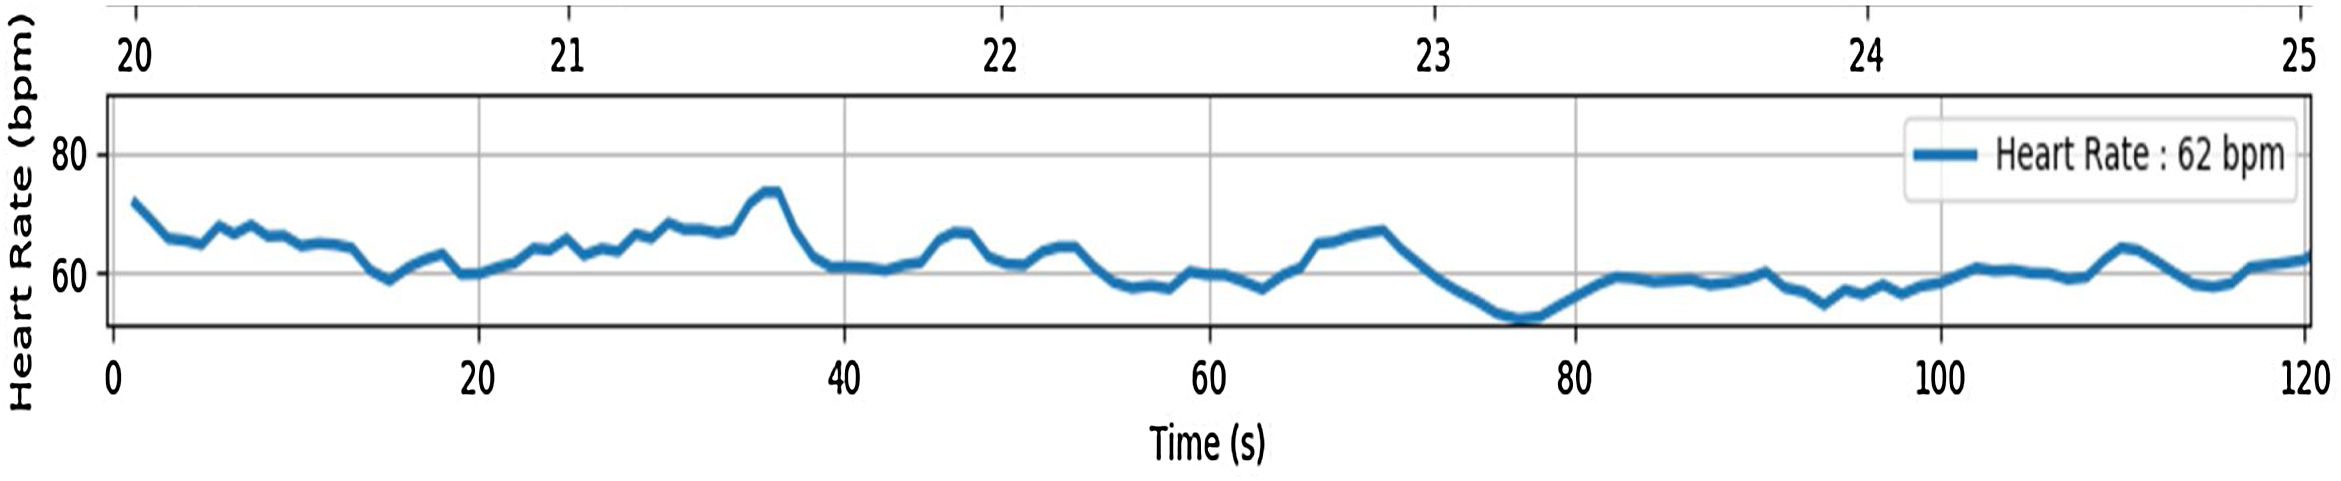
Heart rateHeart rate is the heart rate count per minute. Figs. 13 and 14 are the results of subject 13 and subject 14 BPM when the recording is done for two minutes in a sitting position and in a relaxed condition.
Discussion

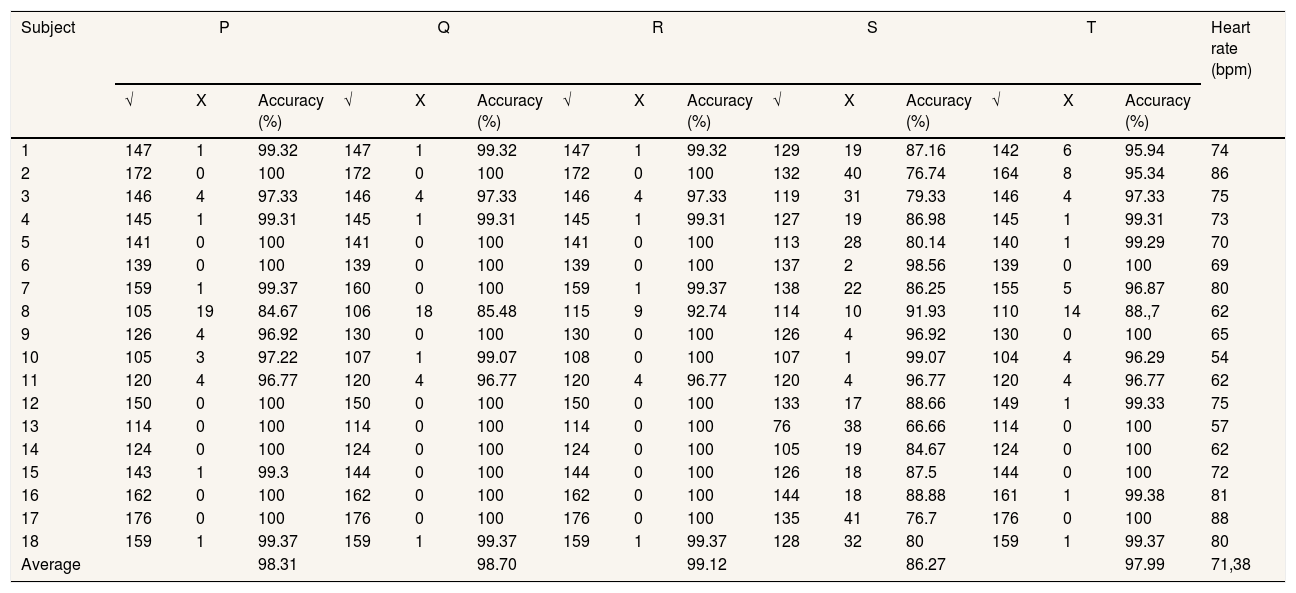
Table 1 is the overall experiment results on all subjects where symbol (√) indicates the number of the waves that can be detected correctly, while symbol (X) indicates the number of waves that cannot be detected correctly. In the above data, the percentage of the accuracy of the method used on each wave and the number of heart rate on each subject is also counted. From the overall data, it is obtained that the average accuracy for wave detection P wave=98.31%, Q wave=98.7%, R wave=99.12%, S wave=86.27%, and T wave=97.99%. The number of heart rates of all subjects in a relaxed state is ±71bpm.
Overall results.
| Subject | P | Q | R | S | T | Heart rate (bpm) | ||||||||||
|---|---|---|---|---|---|---|---|---|---|---|---|---|---|---|---|---|
| √ | X | Accuracy (%) | √ | X | Accuracy (%) | √ | X | Accuracy (%) | √ | X | Accuracy (%) | √ | X | Accuracy (%) | ||
| 1 | 147 | 1 | 99.32 | 147 | 1 | 99.32 | 147 | 1 | 99.32 | 129 | 19 | 87.16 | 142 | 6 | 95.94 | 74 |
| 2 | 172 | 0 | 100 | 172 | 0 | 100 | 172 | 0 | 100 | 132 | 40 | 76.74 | 164 | 8 | 95.34 | 86 |
| 3 | 146 | 4 | 97.33 | 146 | 4 | 97.33 | 146 | 4 | 97.33 | 119 | 31 | 79.33 | 146 | 4 | 97.33 | 75 |
| 4 | 145 | 1 | 99.31 | 145 | 1 | 99.31 | 145 | 1 | 99.31 | 127 | 19 | 86.98 | 145 | 1 | 99.31 | 73 |
| 5 | 141 | 0 | 100 | 141 | 0 | 100 | 141 | 0 | 100 | 113 | 28 | 80.14 | 140 | 1 | 99.29 | 70 |
| 6 | 139 | 0 | 100 | 139 | 0 | 100 | 139 | 0 | 100 | 137 | 2 | 98.56 | 139 | 0 | 100 | 69 |
| 7 | 159 | 1 | 99.37 | 160 | 0 | 100 | 159 | 1 | 99.37 | 138 | 22 | 86.25 | 155 | 5 | 96.87 | 80 |
| 8 | 105 | 19 | 84.67 | 106 | 18 | 85.48 | 115 | 9 | 92.74 | 114 | 10 | 91.93 | 110 | 14 | 88.,7 | 62 |
| 9 | 126 | 4 | 96.92 | 130 | 0 | 100 | 130 | 0 | 100 | 126 | 4 | 96.92 | 130 | 0 | 100 | 65 |
| 10 | 105 | 3 | 97.22 | 107 | 1 | 99.07 | 108 | 0 | 100 | 107 | 1 | 99.07 | 104 | 4 | 96.29 | 54 |
| 11 | 120 | 4 | 96.77 | 120 | 4 | 96.77 | 120 | 4 | 96.77 | 120 | 4 | 96.77 | 120 | 4 | 96.77 | 62 |
| 12 | 150 | 0 | 100 | 150 | 0 | 100 | 150 | 0 | 100 | 133 | 17 | 88.66 | 149 | 1 | 99.33 | 75 |
| 13 | 114 | 0 | 100 | 114 | 0 | 100 | 114 | 0 | 100 | 76 | 38 | 66.66 | 114 | 0 | 100 | 57 |
| 14 | 124 | 0 | 100 | 124 | 0 | 100 | 124 | 0 | 100 | 105 | 19 | 84.67 | 124 | 0 | 100 | 62 |
| 15 | 143 | 1 | 99.3 | 144 | 0 | 100 | 144 | 0 | 100 | 126 | 18 | 87.5 | 144 | 0 | 100 | 72 |
| 16 | 162 | 0 | 100 | 162 | 0 | 100 | 162 | 0 | 100 | 144 | 18 | 88.88 | 161 | 1 | 99.38 | 81 |
| 17 | 176 | 0 | 100 | 176 | 0 | 100 | 176 | 0 | 100 | 135 | 41 | 76.7 | 176 | 0 | 100 | 88 |
| 18 | 159 | 1 | 99.37 | 159 | 1 | 99.37 | 159 | 1 | 99.37 | 128 | 32 | 80 | 159 | 1 | 99.37 | 80 |
| Average | 98.31 | 98.70 | 99.12 | 86.27 | 97.99 | 71,38 | ||||||||||
In this paper, the PQRST wave detection on ECG signal is presented. The results show that the signal preprocessing method shows significant results in eliminating noise on the signal. The extraction of used features proved capable of detecting P waves, QRS complexes, T waves, as well as the amount of heart rate on all subjects. The results of determining the points of PQRST are expected to be used to calculate the value of the interval that can indicate the normal condition or abnormal cardiac signals.
Conflicts of interestThe authors declare no conflict of interest.
This Research is funded by: Directorate General of Higher Education, Ministry of Education, Culture, Research and Technology 2021 Academic Year
Peer-review under responsibility of the scientific committee of the 3rd International Nursing, Health Science Students & Health Care Professionals Conference. Full-text and the content of it is under responsibility of authors of the article.


