


This study estimates life expectancy by sex and analyzes its relationship with social deprivation along the stations of Madrid Metro Line 5. It also applies a linear model to predict life expectancy in men and women.
MethodA descriptive and analytical study was conducted on the population living within 350 meters of each station (2015–2019). Socioeconomic status was assessed using a deprivation index. Pearson's correlation coefficient was applied to explore the relationship between life expectancy and deprivation by sex. Multiple linear regression models were then used to analyze the influence of index components.
ResultsSocioeconomic inequalities were identified along the line. Average life expectancy was 82.29 years in men (95%CI: 80.05–84.54) and 86.95 in women (95%CI: 85.15–89.11). In men, it was inversely related to the deprivation index (r=–0.38; p <0.005). In women, a model including electoral abstention (p <0.005) and unemployment (p <0.005) explained 23% of the variability.
ConclusionsLife expectancy varies along Madrid Metro Line 5. In men, it is associated with socioeconomic status, whereas in women electoral abstention and unemployment stand out. These findings reinforce the need for public health interventions aimed at reducing social inequalities.
Este estudio estima la esperanza de vida por sexo y analiza su relación con la privación social en las estaciones de la línea 5 del metro de Madrid. También aplica un modelo lineal para predecir la esperanza de vida en hombres y mujeres.
MétodoEstudio descriptivo y analítico de la población residente en un radio de 350 metros de cada estación (2015-2019). El nivel socioeconómico se evaluó con un índice de privación. Se aplicó el coeficiente de correlación de Pearson para explorar la relación entre esperanza de vida y privación por sexo. Posteriormente, se usaron modelos de regresión lineal múltiple para analizar la influencia de los componentes del índice.
ResultadosSe identificaron desigualdades socioeconómicas a lo largo de la línea. La esperanza de vida media fue de 82,29 años en los hombres (IC95%: 80,05-84,54) y 86,95 en las mujeres (IC95%: 85,15-89,11). En los hombres, se relacionó inversamente con el índice de privación (r=–0,38; p <0,005). En las mujeres, el modelo con abstención electoral (p <0,005) y desempleo (p <0,005) explicó el 23% de la variabilidad.
ConclusionesLa esperanza de vida varía a lo largo de la línea 5. En los hombres está asociada al nivel socioeconómico, mientras que en las mujeres destacan la abstención electoral y el desempleo. Estos hallazgos refuerzan la necesidad de intervenciones de salud pública dirigidas a reducir las desigualdades sociales.
Social determinants of health —such as educational level, income, or unemployment— have a greater influence on life expectancy and mortality than biological or medical factors.1–4 These inequalities affect men and women differently and tend to concentrate in disadvantaged urban areas.5–8 Deprivation indices allow for the comparative quantification of these inequalities between territories,9–11 and can be visualised through urban maps that reveal significant variations over short distances.12,13
In this context, maps have become an effective communication tool to make urban inequities visible. Examples such as the Lives on the Line14 project, developed in London, show substantial differences in life expectancy along short urban routes.15–20 However, the debate over how to define study areas persists. In urban contexts, radii of 200 to 450 meters around public transport stations are commonly used.15–20
To overcome the limitations of aggregated administrative data, this study used specific catchment areas, relying exclusively on population and mortality data contained within these boundaries.
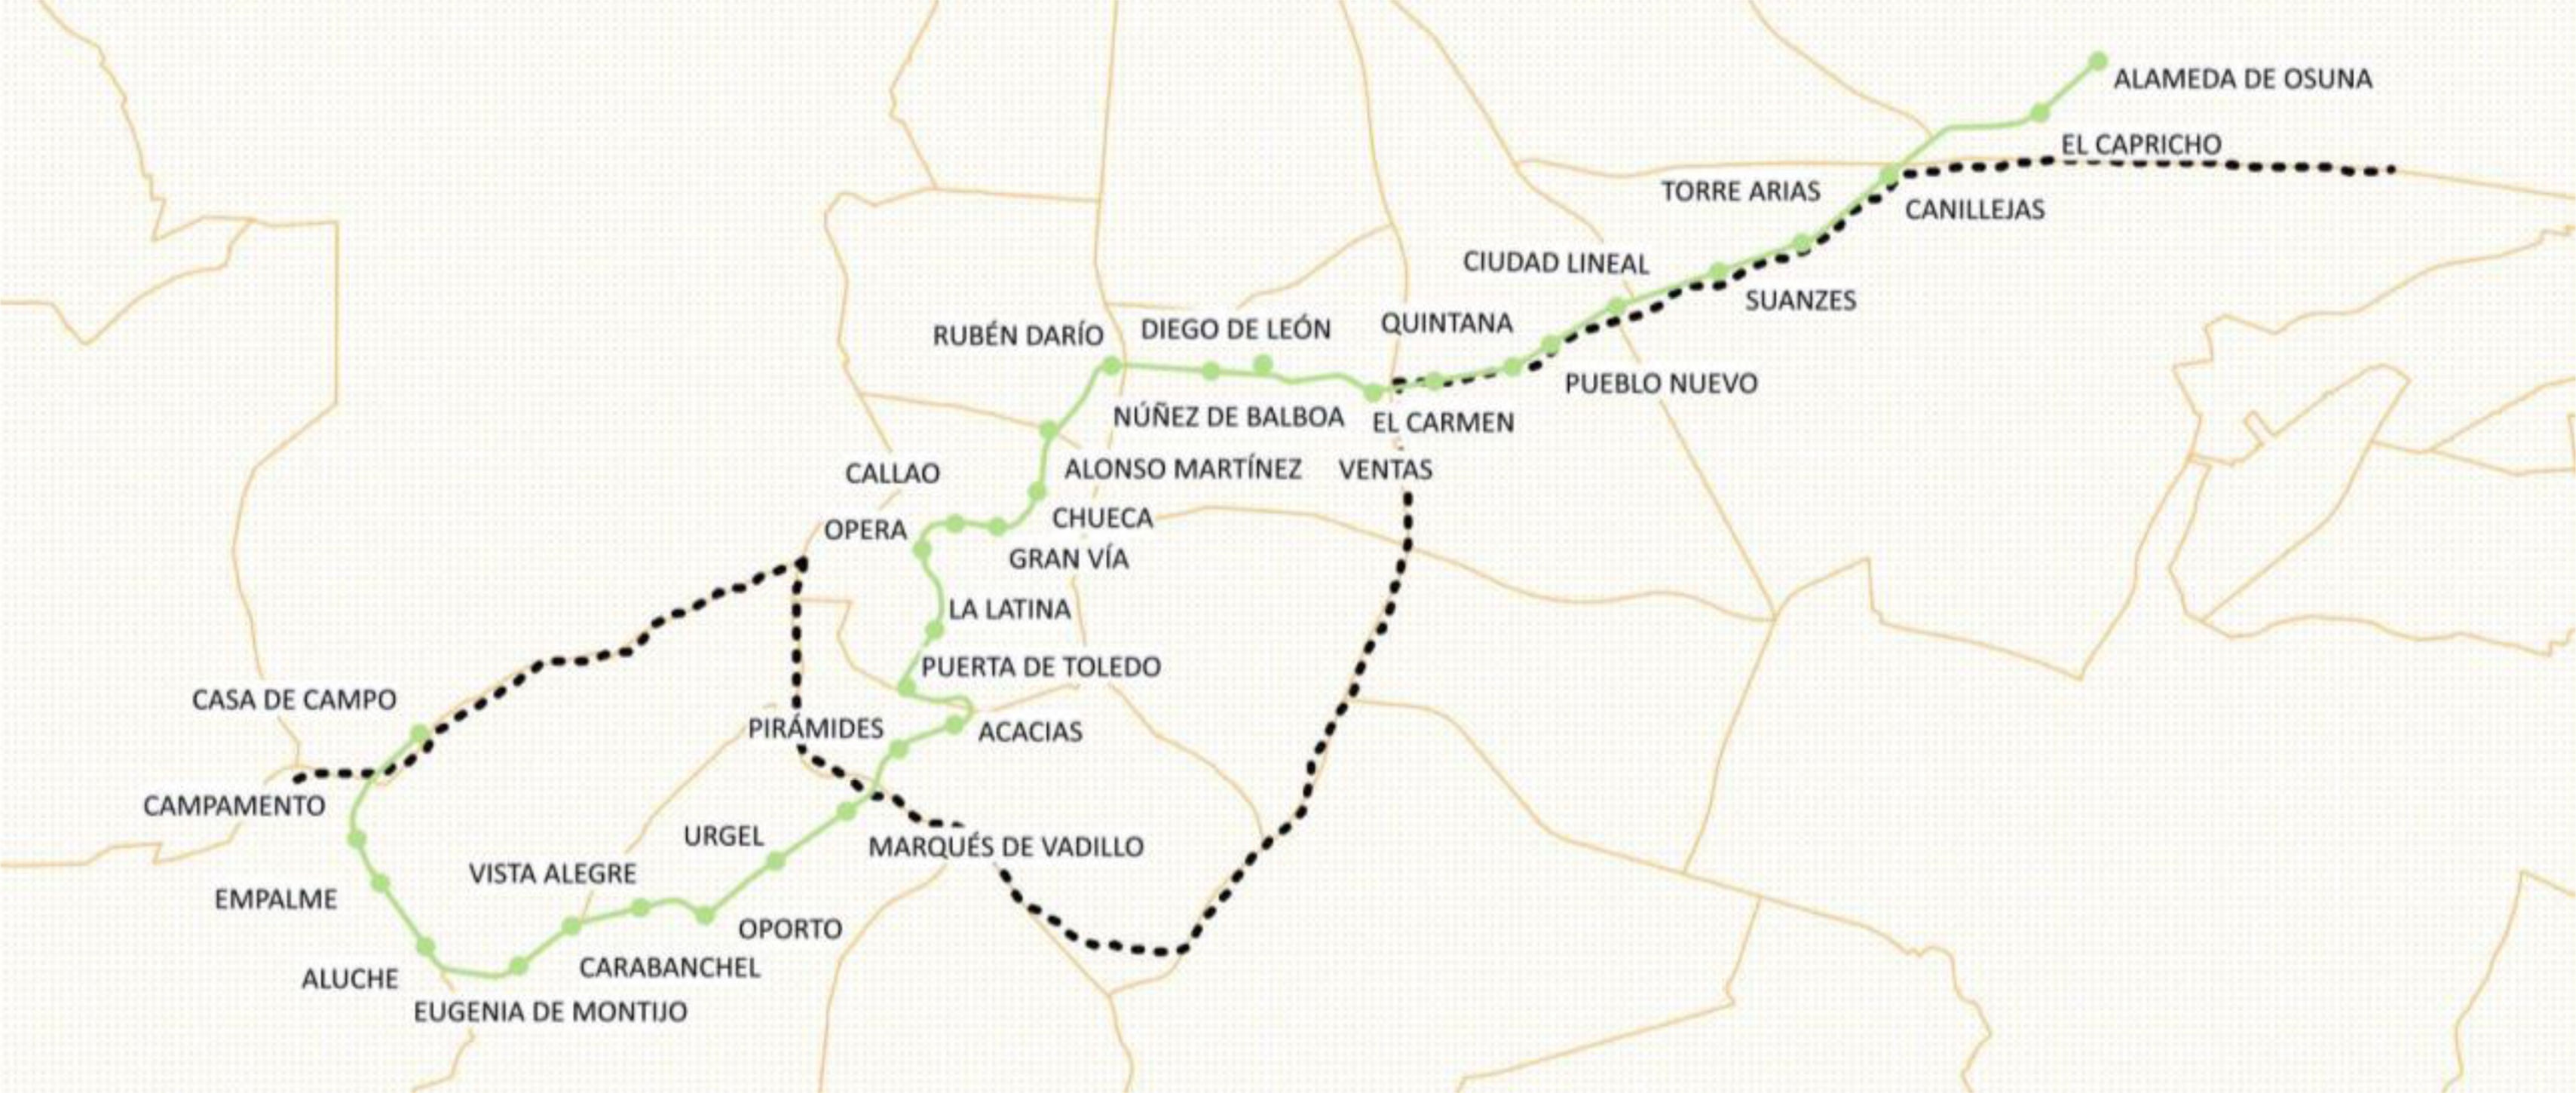
Madrid Metro Line 5 was selected since it crosses the city from West to East along the so-called “poverty line”,21 a historical North–South axis that reflects long-standing spatial inequalities in socioeconomic conditions and health outcomes in Madrid. Metro Line 5 and the “poverty line” are represented in Figure 1.

The aim of this study was to estimate life expectancy and deprivation indices along the stations of Madrid Metro Line 5, using georeferenced data from 2015 to 2019. In addition, we evaluated whether a linear model could explain variations in total, male, and female life expectancy based on the components of the deprivation index.
MethodData sources and study populationThis study used non-aggregated, individual-level data from 2015 to 2019, obtained from two sources: the population files from the Municipal Register of Inhabitants (Statistical Unit of the Madrid City Council) and death records from the Institute of Statistics of the Community of Madrid.
Mortality data included all deaths occurring in the city of Madrid between 2015 and 2019, disaggregated by sex and five-year age group (0, 1-4, 5-9,..., 95-99, 100+). Each death was geo-referenced using X and Y coordinates within the municipal boundary.
Population data were provided at building level, with each building geo-referenced by its address coordinates (X and Y). For each year in the study period, the number of residents per building was disaggregated down by sex and the same five-year age intervals.
The unit of analysis was each of the 32 stations along Line 5 of the Madrid Metro. Geographic coordinates for each station were sourced from the Madrid Institute of Epidemiology, via the street directory of the Community of Madrid. A circular buffer with a 350-meter radius around each station was defined as the station's catchment area (see Figure S1 in Supplementary Material). This radius was chosen to ensure a sufficient population living near each station while avoiding overlap between adjacent areas.
Deaths and population counts were aggregated within each buffer zone using spatial overlay techniques, based on geo-referenced data. These aggregations were disaggregated by sex and age group for further analysis (see Table S1 in Supplementary Material).
Assessment of Deprivation IndexThe Deprivation Index (DI) was sourced from the most recent update (2021) by Madrid Salud.22 It was calculated at the census tract level using the following variables:
- •
Secondary studies or less: percentage of the population aged 30-64 years with secondary studies or less.
- •
Average household income: according to data from the Spanish National Statistics Institute.
- •
Unemployment: percentage of the working age population (16-64 years old) actively seeking employment and not currently employed, according to the Employment Services of the Community of Madrid.
- •
Electoral abstention rate: abstention rate in the Madrid regional elections held on May 4, 2021.23
- •
Migration: proportion of the population born outside Spain, excluding those born in high-income countries (Austria, Belgium, Cyprus, Denmark, Finland, France, Greece, Ireland, Iceland, Italy, Liechtenstein, Luxembourg, Malta, Monaco, the Netherlands, Portugal, Andorra, the United Kingdom, Germany, San Marino, the Vatican, Sweden, Switzerland, Norway, the United States of America, Canada, Japan, Australia and New Zealand).
The scale showed high internal consistency (standardized Cronbach's alpha=0.939) and removing any item did not improve reliability. Factor analysis confirmed a single-factor solution explaining over 80% of the variance, with all indicators loading strongly on this factor (KMO=0.79; Bartlett p<0.05) with communalities indicating strong contributions from each item. To calculate the DI, each component was normalized to a common scale from 0 to 1 using a min-max normalization method based on the Human Development Index approach. In this scale, 0 represents the most favorable condition and 1 the most adverse. The DI for each census tract was calculated as the mean of the normalized components values, resulting in an index ranging from 0 (least deprived) to 1 (most deprived).
Once each census tract's DI was determined, this value was assigned to each individual residing in the corresponding buildings. Since each catchment area could overlap different census tracts unevenly, the DI was computed for each inhabitant based on the census tract of their residential building. Then, the DI for each metro station catchment area was then computed as the weighted mean of the DI values for the population residing within the 350-meter radius buffer. This procedure was also applied to each individual DI component (see Table S2 in Supplementary Material).
Statistical analysisLife expectancy was estimated for each metro station catchment area by constructing abridged life tables using the Chiang II method,24 based on population and mortality data disaggregated by five-year age groups (0, 1-4, 5-9,..., 95-99, 100+) and sex. The Chiang II method, recommended by the WHO25 and the Official for National Statistics in United Kingdom26 for small-area analysis, is a statistical technique that enables robust life expectancy estimates with corresponding 95% confidence intervals (95%CI), especially in populations of 25,000 or more.
To explore the relationship between life expectancy and the DI, Pearson's correlation coefficient (r) was calculated to assess the strength and direction of association. The coefficient of determination (r2) was also computed to estimate the proportion of variance in life expectancy explained by the DI. Analyses were conducted separately for total, male and female life expectancy.
Subsequently, two multiple linear regression models were fitted to examine the possibility to explain life expectancy in men and women using the DI's components. A linear regression model was used, assuming normal distribution of variables. Prior to modeling, assumptions of linearity, independence, homoscedasticity, normality of residuals, and absence of multicollinearity were verified. Multicollinearity was assessed using tolerance and variance inflation factor (VIF) statistics for all independent variables. Given that the predictors represented highly related socioeconomic indicators, some degree of collinearity was expected. We examined tolerance values and VIF to identify potential concerns, adopting commonly used thresholds (tolerance <0.10 or VIF>10) as indicative of substantial multicollinearity.
All life table calculations were performed in Microsoft Excel. Geo-referenced spatial analyses were conducted using QGIS 3.38.0 (https://www.qgis.org), and all statistical analyses were carried out in IBM SPSS Statistical version 30.0.0.
ResultsAccording to the data collected by the Statistical Unit of the Madrid City Council, the total population living within the catchment areas (350-metre radius) of the 32 stations along Madrid Metro Line 5 during the 2015-2019 period was 1,123,501. Of these, 517,395 were men and 606,106 were women. The smallest population was observed around Torre Arias station (2828 inhabitants), while Vista Alegre had the largest (64,756).
During the same period, a total of 10,361 deaths were recorded within the study area: 4671 among men and 5690 among women. The crude mortality rate among the population living near Madrid Metro Line 5 was 9.22 deaths per 1000 inhabitants, slightly higher than the citywide average of 8.90 per 1000 inhabitants. Torre Arias registered the fewest deaths (36), and Quintana the highest (681).
The average life expectancy across all stations was 85.05 years (95%CI: 83.51-86.59), similar to the city of Madrid's life expectancy (84.94 years). By sex, the mean life expectancy was 82.29 years for men (95%CI: 80.05-84.54; city: 82.02) and 87.10 years for women (95%CI: 85.15-89.11; city: 87.03). Detailed estimates, including 95%CI for total, male, and female life expectancy at each metro station (see Table S3 in Supplementary Material).
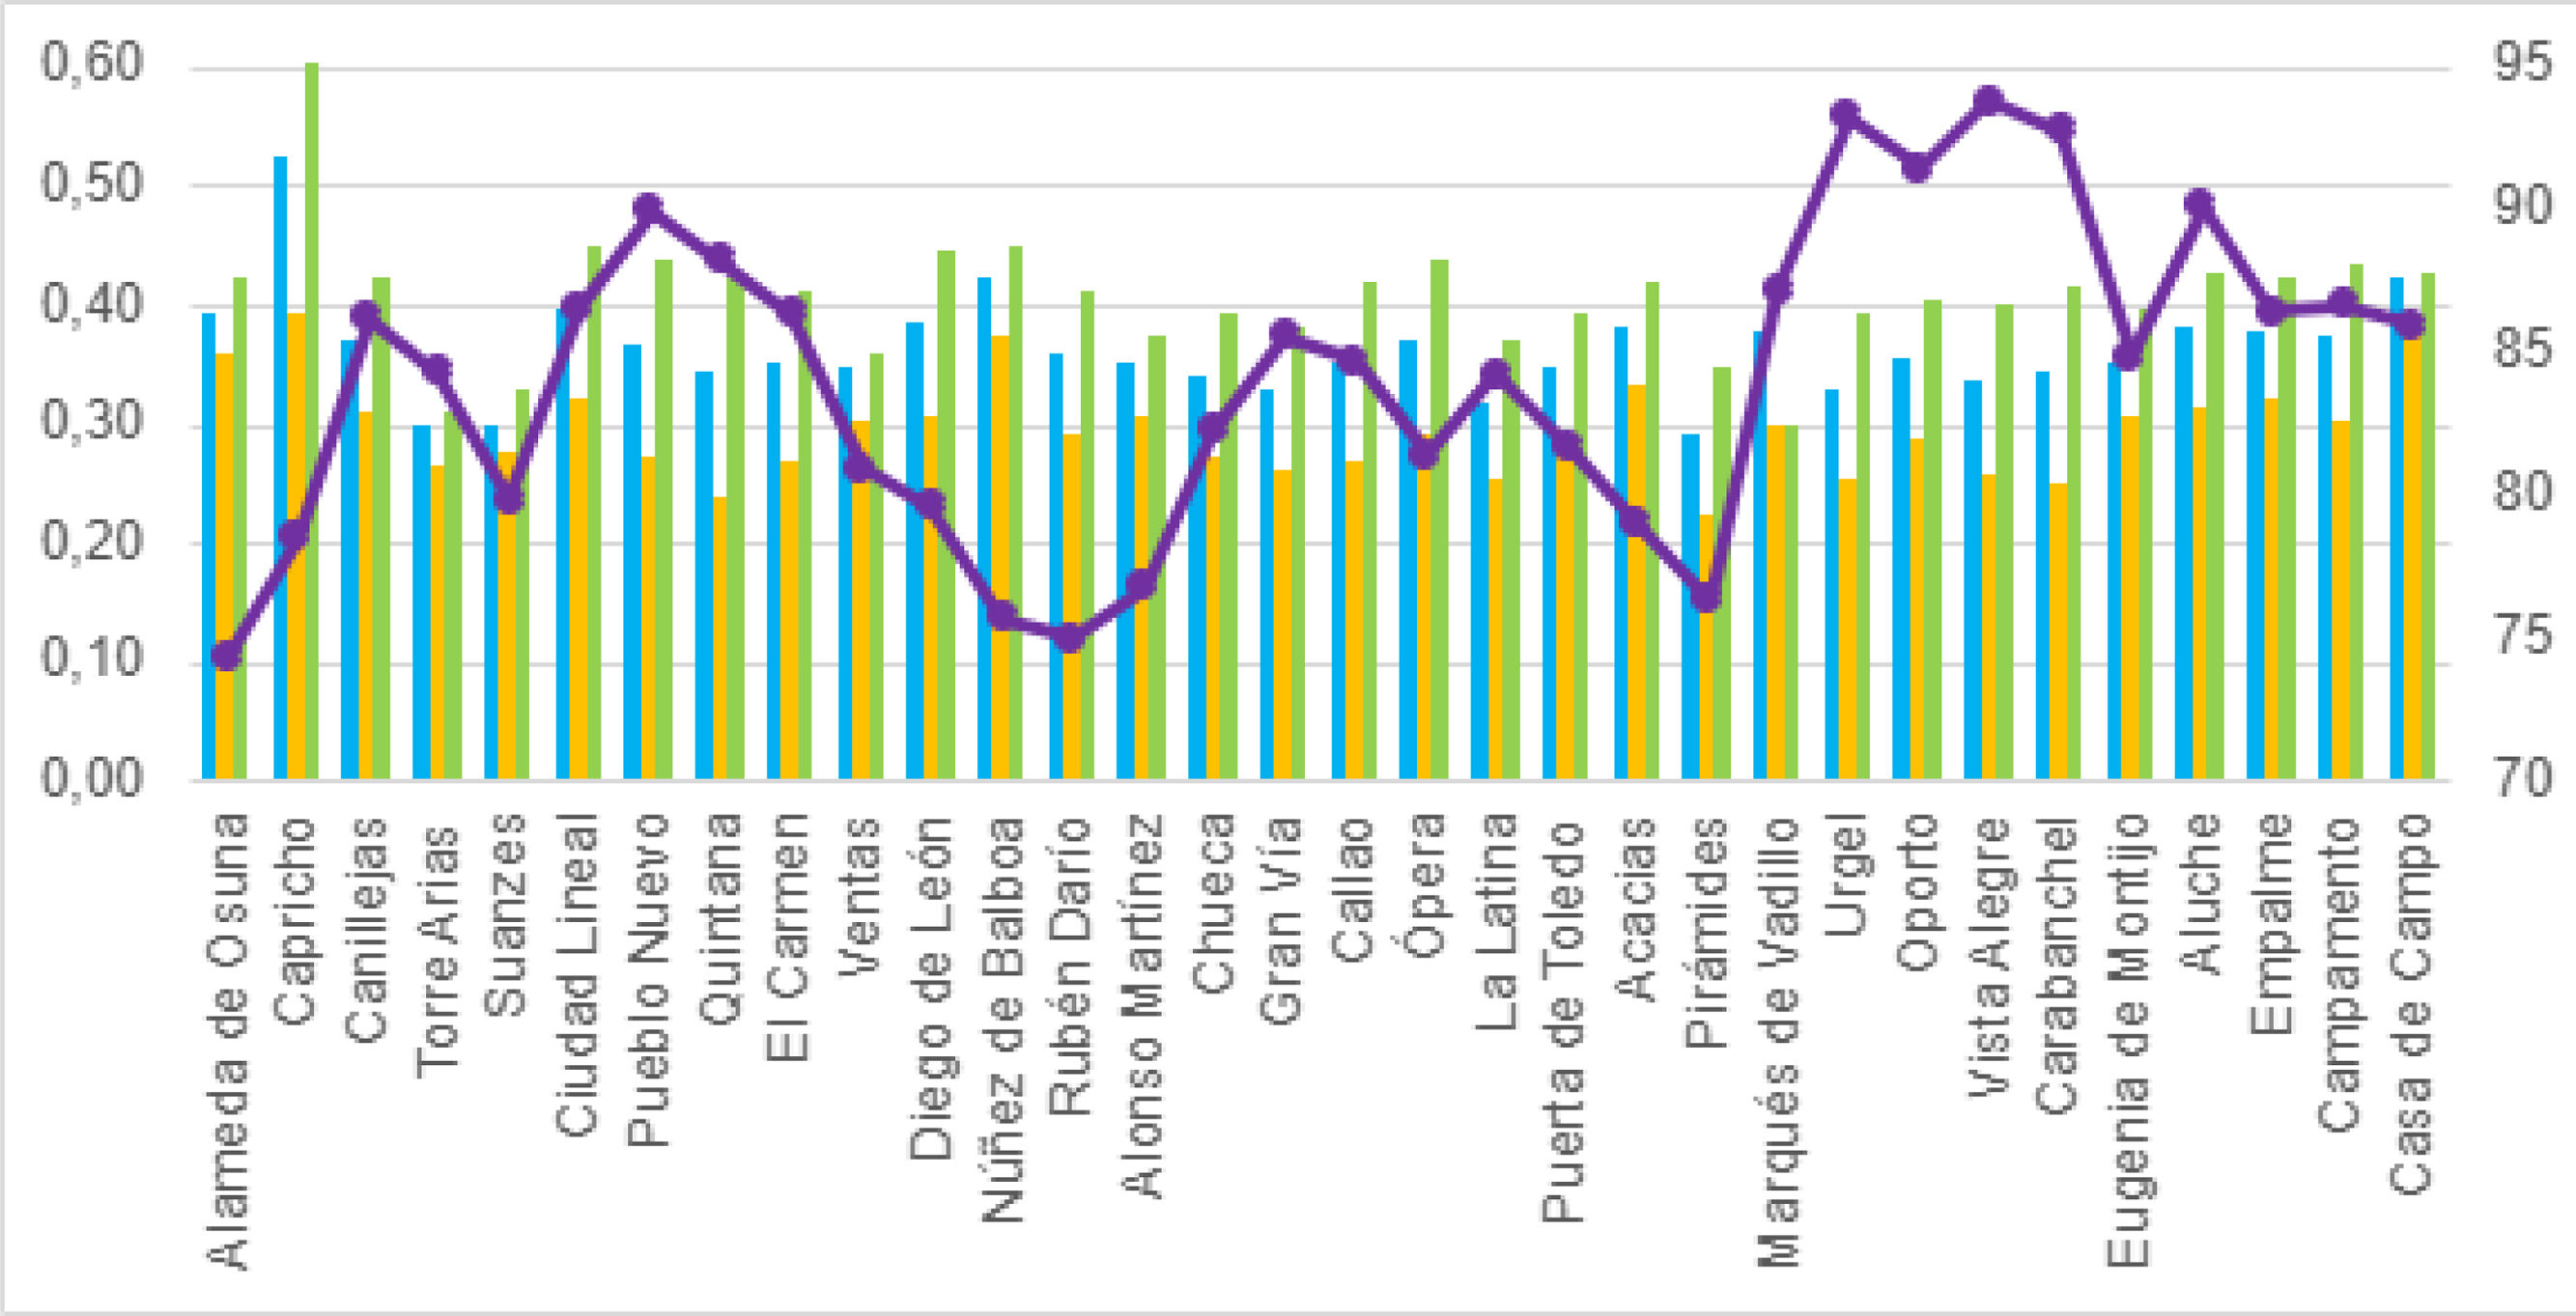
Regarding deprivation, the average DI across the 32 stations was 0.34, closely aligned with the citywide average of 0.35. The least deprived area was Alameda de Osuna (DI=0.10), and the most deprived was Vista Alegre (DI=0.57).
Figure 2 provides a visual summary of DI values and life expectancy for each station along the line, indicating total (blue bars), male (yellow bars) and female life expectancy (green bars).

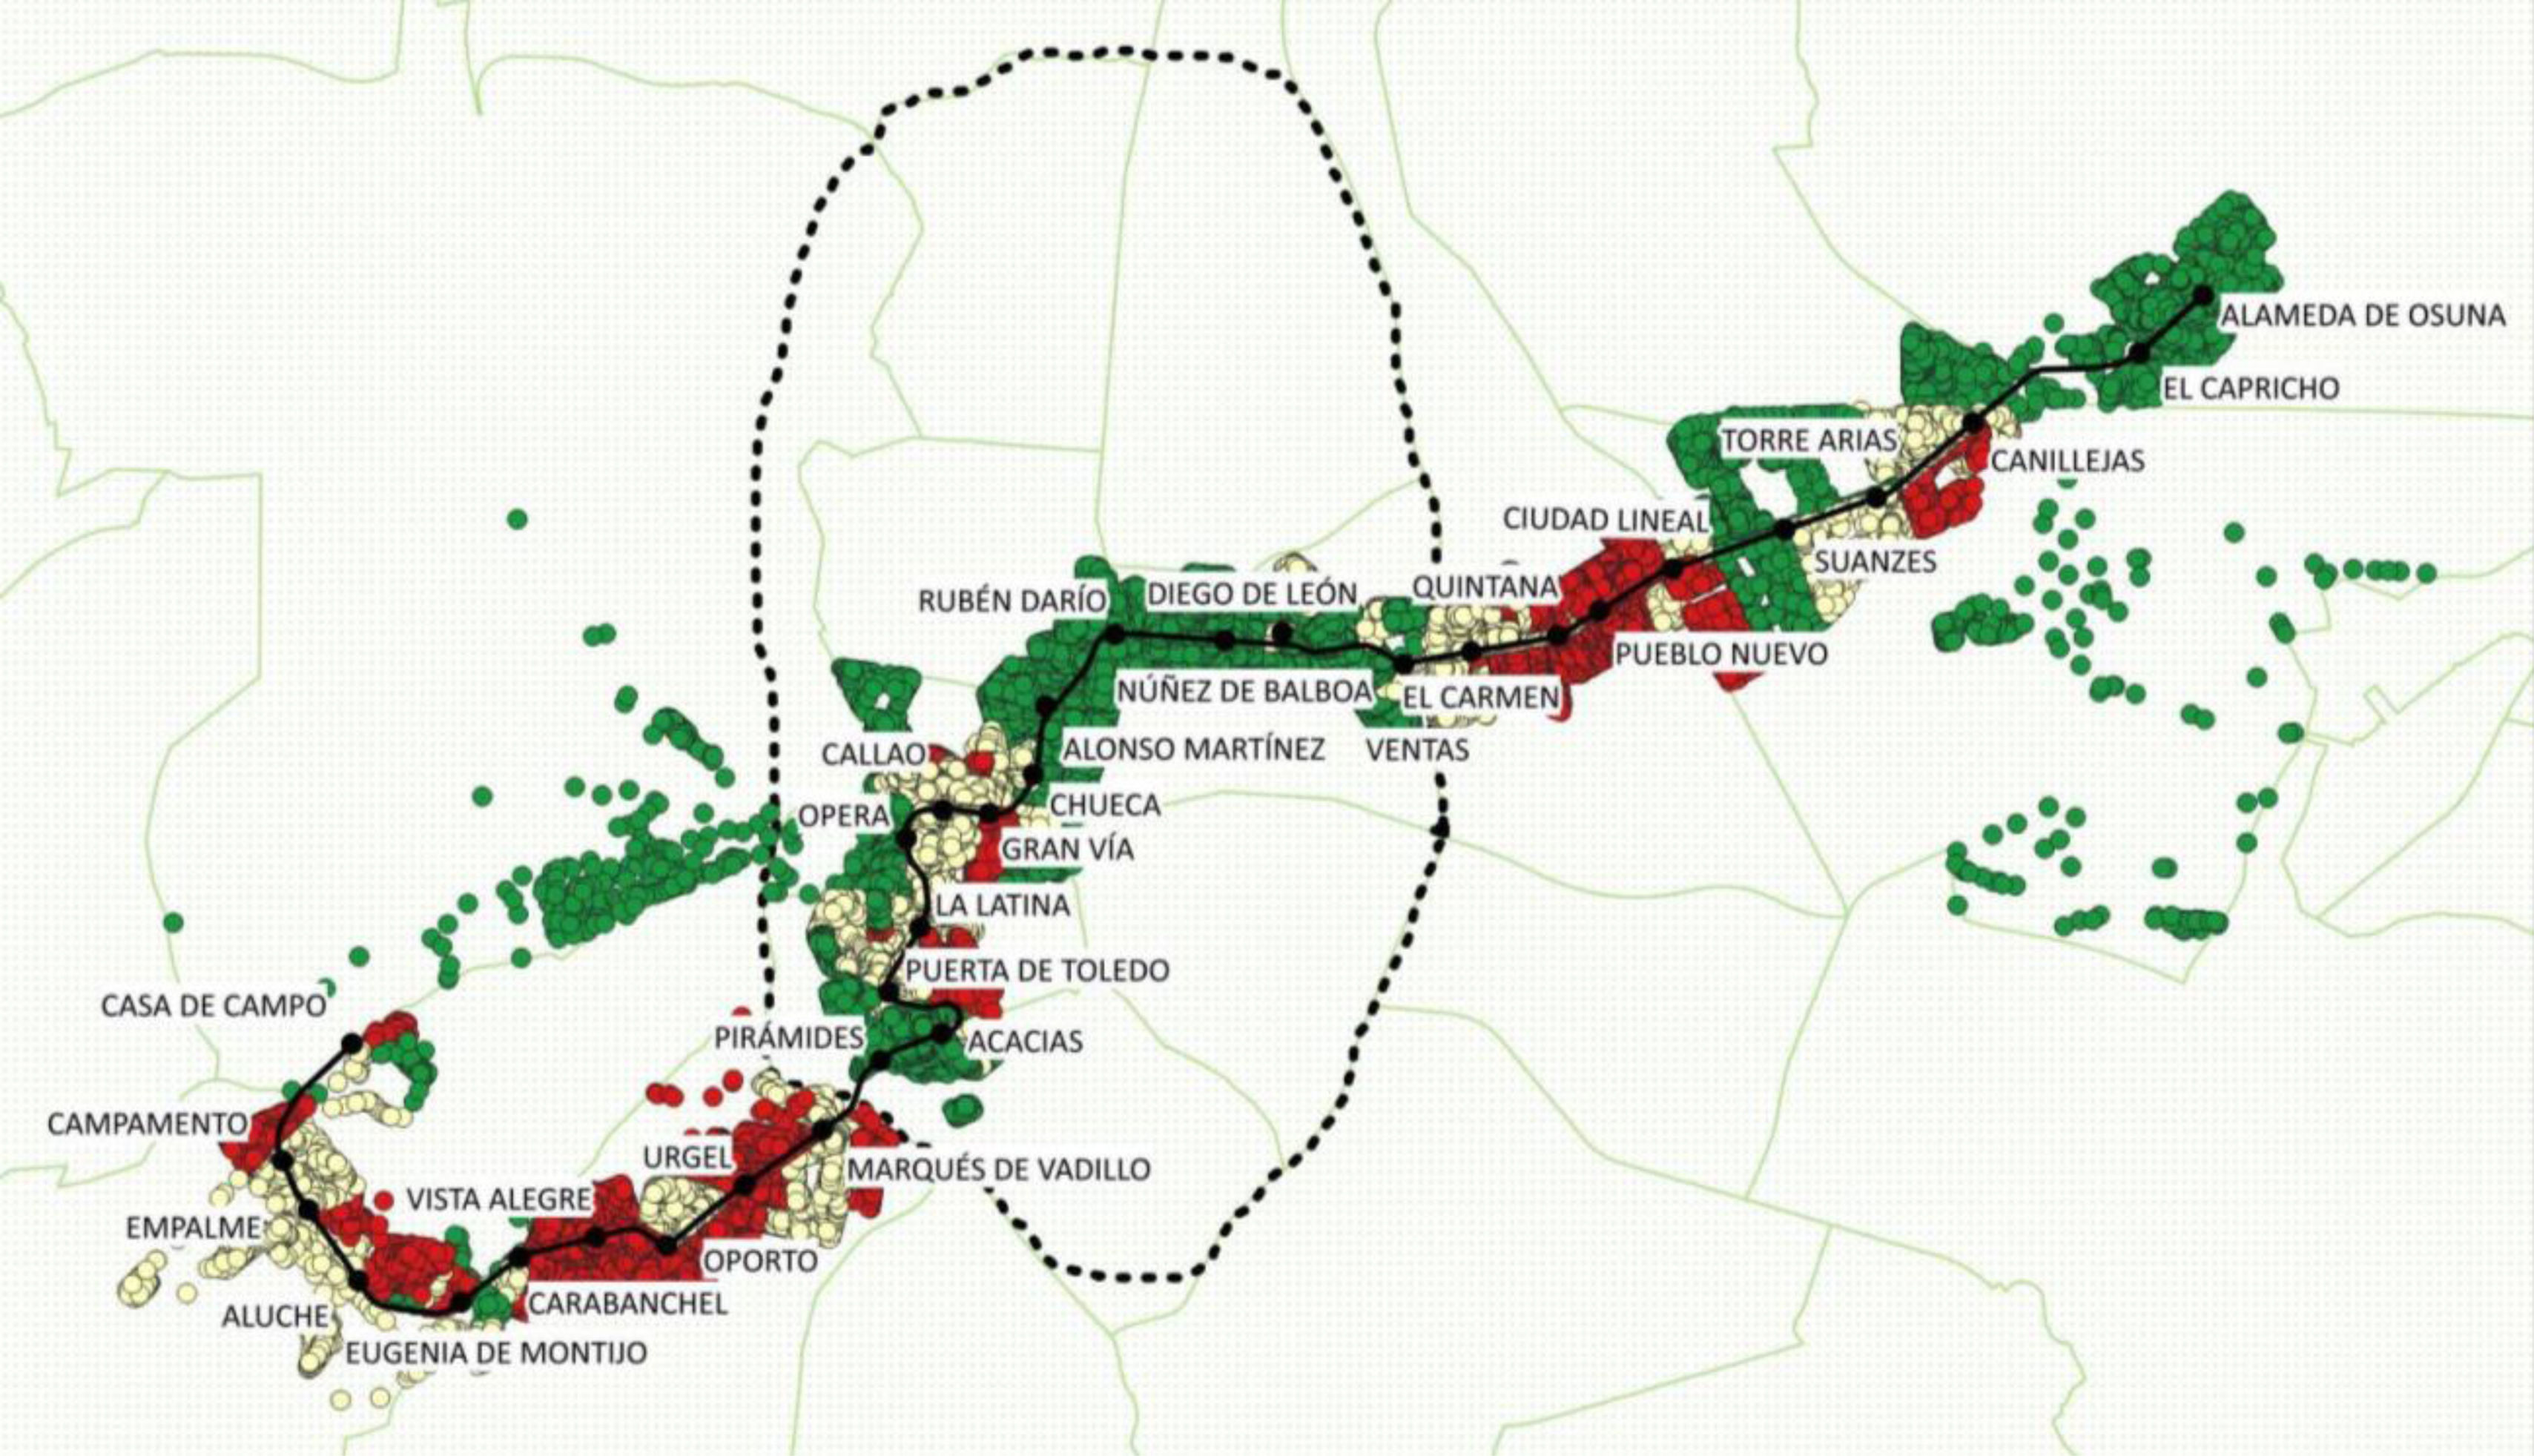
To visually represent the differences in socioeconomic status, the DI was categorized into tertiles and mapped for each catchment area (Fig. 3). The least deprived areas are located Northwest of the city, while the most deprived areas are concentrated in the Southeast.

Socioeconomic status along the Madrid Metro Line 5. Note green represents the least deprived areas around the metro stations, yellow areas represent mid-deprived areas around the metro station and red represents most deprived areas around the metro station. Each circle corresponds to a building. Black dotted line represents Madrid's Orbital Road M30 and green lines illustrate the city's districts.
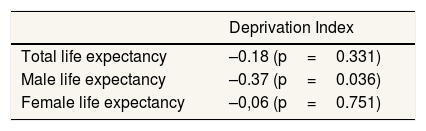
Correlation analysis revealed a moderate inverse relationship, particularly among men (r=–0.38; p=0.036), indicating that higher deprivation was associated with lower life expectancy (Table 1). The corresponding scatter plots are shown in Figures 2A-2C in Supplementary Material.
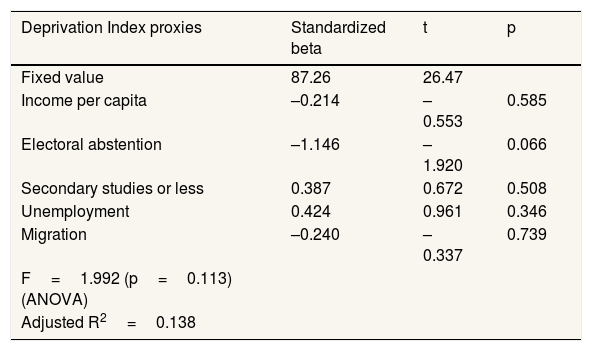
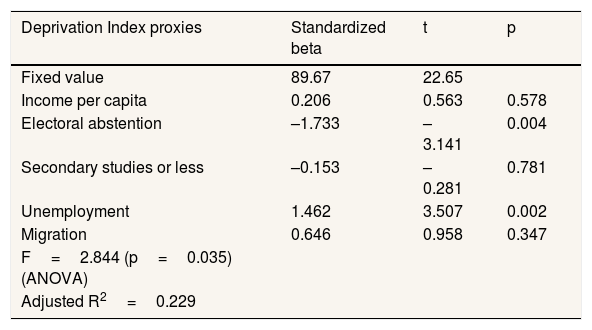
Multiple linear regression models with the DI components were fitted for male and female life expectancy (Tables 2 and 3).
Multiple regression model between Deprivation Index and male life expectancy.
| Deprivation Index proxies | Standardized beta | t | p |
|---|---|---|---|
| Fixed value | 87.26 | 26.47 | |
| Income per capita | –0.214 | –0.553 | 0.585 |
| Electoral abstention | –1.146 | –1.920 | 0.066 |
| Secondary studies or less | 0.387 | 0.672 | 0.508 |
| Unemployment | 0.424 | 0.961 | 0.346 |
| Migration | –0.240 | –0.337 | 0.739 |
| F=1.992 (p=0.113) (ANOVA) | |||
| Adjusted R2=0.138 |
Multiple regression model between Deprivation Index and female life expectancy.
| Deprivation Index proxies | Standardized beta | t | p |
|---|---|---|---|
| Fixed value | 89.67 | 22.65 | |
| Income per capita | 0.206 | 0.563 | 0.578 |
| Electoral abstention | –1.733 | –3.141 | 0.004 |
| Secondary studies or less | –0.153 | –0.281 | 0.781 |
| Unemployment | 1.462 | 3.507 | 0.002 |
| Migration | 0.646 | 0.958 | 0.347 |
| F=2.844 (p=0.035) (ANOVA) | |||
| Adjusted R2=0.229 |
No significant linear model was identified for male life expectancy using the components of the DI. In contrast, a significant model was found for female life expectancy, where 23% of the variance was explained by the electoral abstention rate and the unemployment rate (R2=0.23; F=2.84; p <0.05). The regression coefficients were –1.77 for electoral abstention and 1.46 for unemployment, both statistically significant at the 0.05 level, according to statistic t (p <0.05).
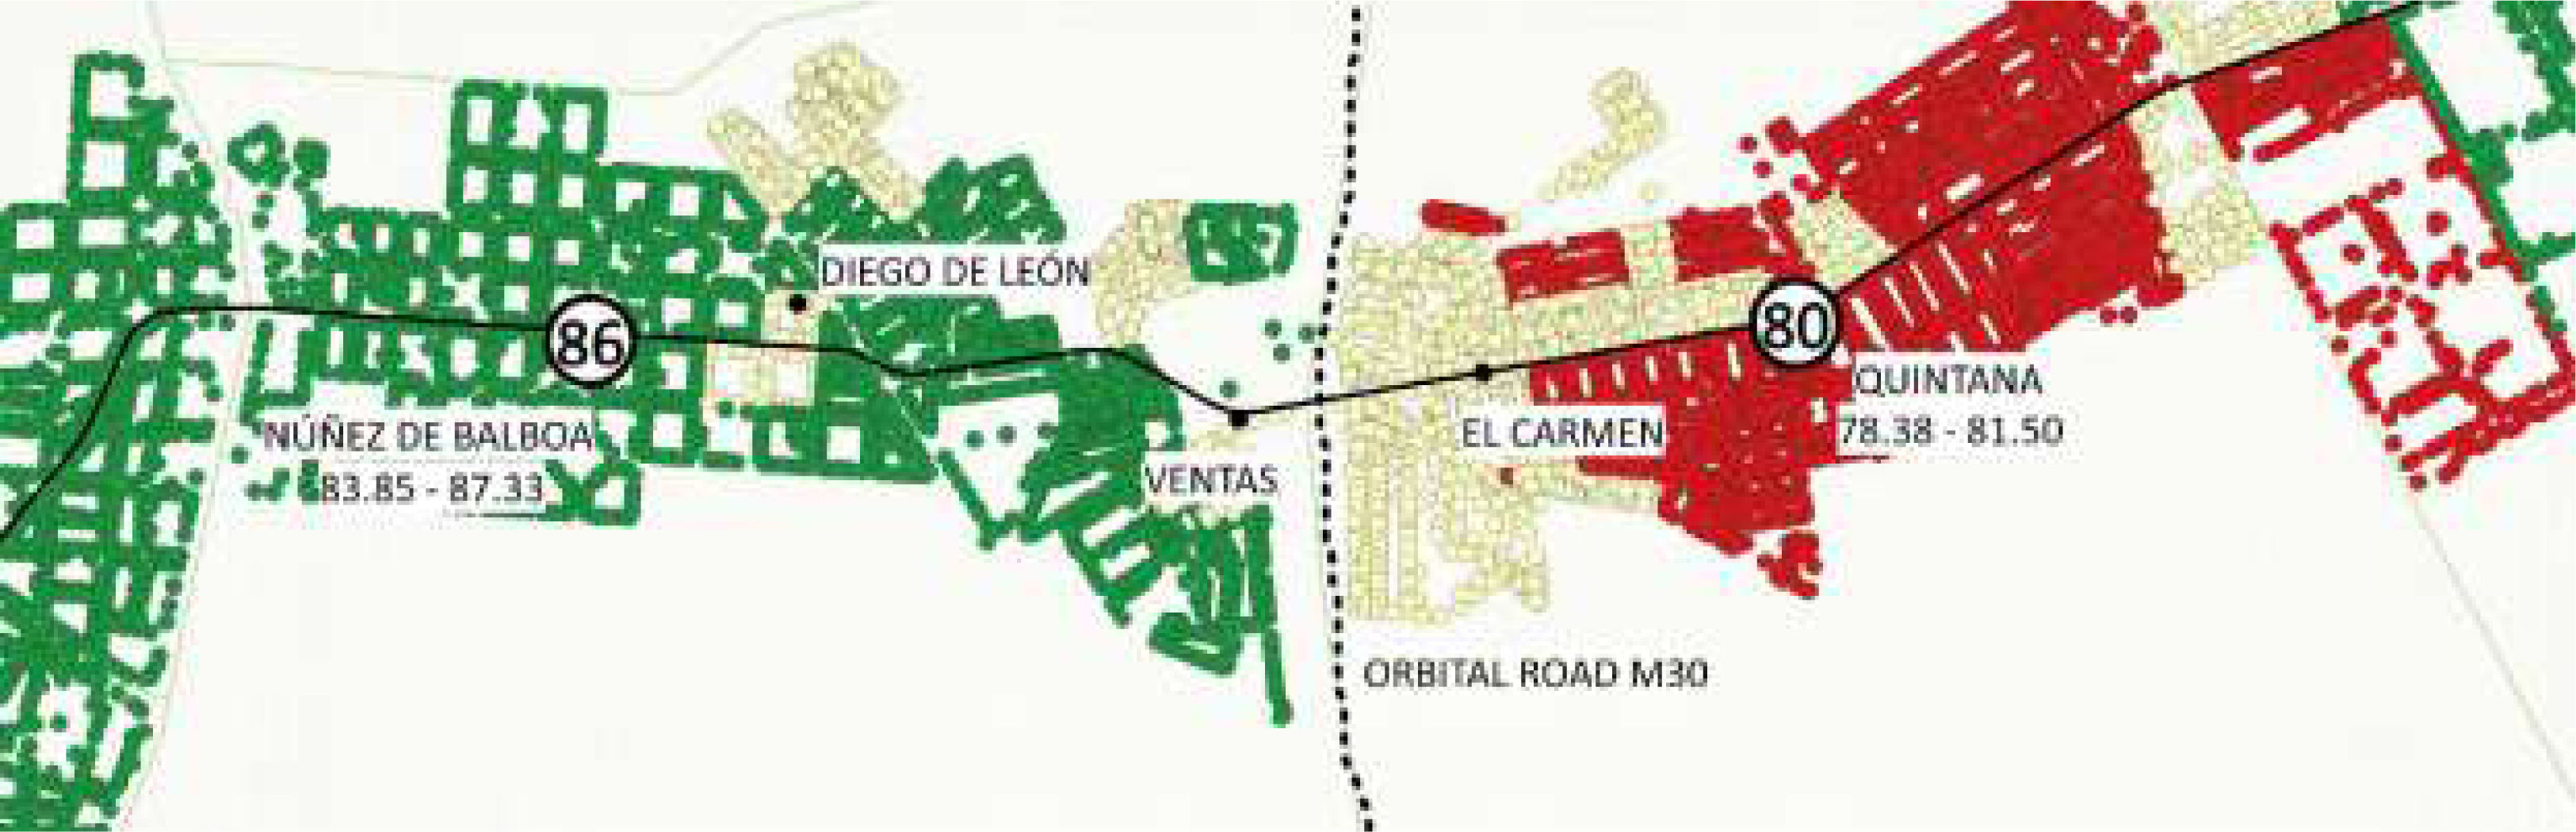
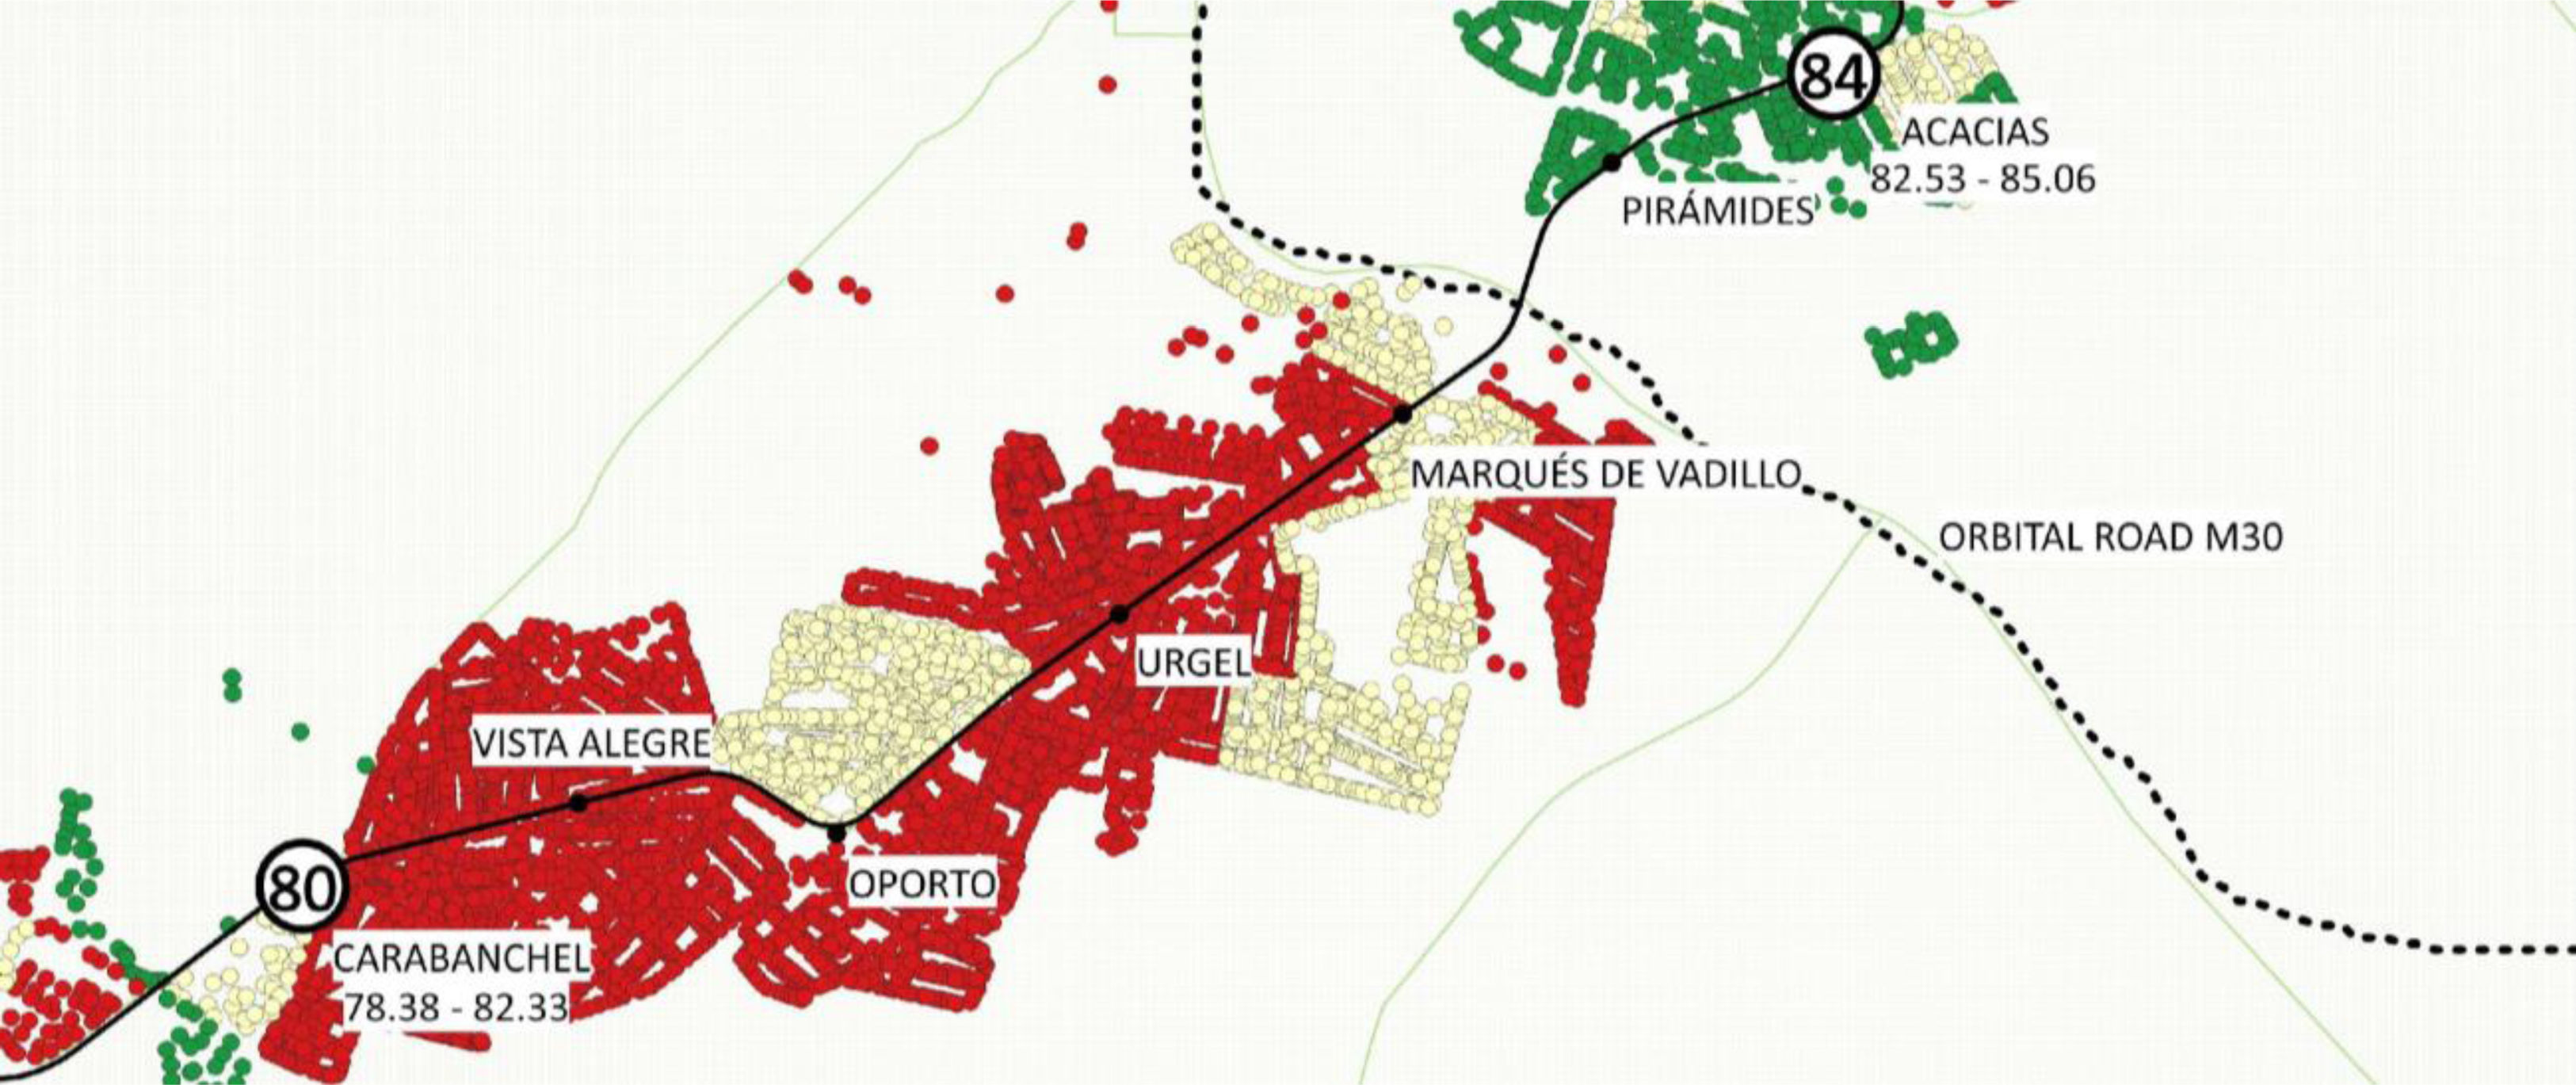
Lastly, Figures 4 and 5 illustrate two specific sections of Madrid Metro Line 5, showing the distribution of male life expectancy and DI terciles as well as the 95%CI life expectancy beneath the stations. These sections were selected to illustrate contrasted socioeconomic and health conditions along the line, serving as representative examples of the broader patterns identified in this study. In these maps, green indicates areas with the lowest deprivation, yellow denotes intermediate levels, and red represents the highest levels of deprivation around each Metro station. The black dotted line marks Madrid's M30 Orbital Road, separating adjacent neighbourhoods with different deprivation indexes.
Discussion

This study provides new evidence on socioeconomic inequalities in life expectancy in an urban setting, using metro station catchment areas as the unit of analysis. The results confirm that, along Madrid Metro Line 5, there are marked differences in life expectancy associated with the socioeconomic status of the territories.
These results are consistent with previous research reporting marked disparities in life expectancy between adjacent metro stations. One of the most influential examples is the study by the London Health Observatory,14 which found a 6-year difference in male life expectancy along only eight stations of the Jubilee Line. Similar patterns have been observed in other United Kingdom cities: in Newcastle,18 life expectancy among men differs by approximately 5 years between five consecutive stations, while in Manchester,19 life expectancy varies by up to 11 years between stations located only 30minutes apart.
In the United States of America, the Center on Society and Health has mapped comparable inequalities, reporting up to 16-year differences in life expectancy between neighbouring areas in cities such as Chicago or Las Vegas.16 Likewise, in Seoul, life expectancy variations have been examined across the city's 23 metro lines, revealing clear social gradients in metropolitan areas.20
Among men, an inverse and statistically significant relationship with the DI was observed. Although no explanatory multivariate models were identified for men, this suggests the existence of combined structural factors that influence this population's health in a complex manner. This finding is consistent with previous research in Spain, which has documented mortality inequalities by socioeconomic status and sex, especially among men with low socioeconomic status.27
In women, the overall relationship between life expectancy and DI was not significant; however, multivariate analysis revealed that electoral abstention and unemployment accounted for 23% of the observed variability. Although the DI is not gender-specific, it is noteworthy that two of its components correlated with women's life expectancy. These findings should be interpreted with caution and further explored in future research. Some international studies28,29 have reported similar associations, suggesting that the observed patterns may reflect broader contextual or social factors that must be studied in the future, rather than direct causal relationships. The positive association between unemployment and female life expectancy, though counterintuitive, could reflect specific dynamics of the female labour market, in which women more often engage in unpaid or precarious work and are not always registered as unemployed.
Electoral abstention as a predictor of health has received less attention, although recent reviews suggest that people in poorer health tend to participate less in electoral processes.30 In this regard, low participation could reflect reduced collective and social empowerment in neighbourhoods with greater needs, limiting these territories’ capacity to influence public policy.31 The fact that this association was observed only among women may point to gender differences in civic engagement and social participation, which warrant further investigation.
Beyond these associations, the study reveals spatial patterns of particular interest. In line with the concept of spatial and temporal inertia, it is confirmed that neighbourhoods in the North and centre of Madrid present higher life expectancy and better socioeconomic status, while those in the South, especially those near the M30, concentrate worse indicators. The M30 acts as a socioeconomic boundary, showing significant differences even between neighbouring stations, such as Quintana and Núñez de Balboa or Carabanchel and Acacias.
However, detailed visual analysis also allowed the identification of relevant exceptions to this general pattern: stations with a high DI that nevertheless show higher-than-expected life expectancy, and vice versa. For example, Oporto or Vista Alegre present higher male life expectancy despite recording high levels of deprivation. These atypical cases may reflect the influence of specific local factors such as social support networks, demographic characteristics, or migration patterns. We consider that identifying and studying these outliers constitutes a key future research line to better understand urban health dynamics.
Among the strengths of the study is the use of geo-referenced catchment areas, which allows for a more accurate representation of the resident population of each metro station, and the application of the Chiang II method for the calculation of confidence intervals, validated by its consistency with official data. The sex-stratified analysis adds value from a gender perspective, underlining the importance of not treating the population as a homogeneous whole. Likewise, the use of visual representations based on the metro map provides significant communicative value, facilitating the transfer of results into political and civic action.
Some limitations should be acknowledged. First, the time gap between data sources (2015–2019 for mortality and population; 2021 for DI), although it has been argued that the social determinants of health, such as those considered in the DI, tend to remain stable in the short term. Second, data aggregation prevented the construction of a sex-specific DI, limiting intersectional analysis. Third, the independent variables included in the multiple regression model relating mortality with several socioeconomic indicators strongly correlated resulted in high VIF values and low tolerance levels. This multicollinearity limits the precision to interpret the unique contribution of each predictor. However it does not seem to introduce the bias into the model. Thus, because the coefficient estimates should therefore be viewed with caution, rather than focusing on the independent effect of each variable, the results should be interpreted in terms of the overall pattern and direction of associations. Fourth, is the possible underestimation of population and deaths in neighbourhoods with unregistered residents such as undocumented people or people who are homeless, since the data is based on the Municipal Register of Inhabitants, which may not fully capture these groups. Finally, the analyses of group data could be biased by ecological fallacy that prevent us from gathering individual conclusions from group data.
ConclusionsThis study shows that differences in life expectancy between men and women along Madrid Metro Line 5 during 2015–2019 are partially associated with the socioeconomic level of the area of residence, even between neighbouring zones. The results confirm defined spatial patterns, such as the socioeconomic boundary of the M30, as well as atypical cases that suggest specific local dynamics. Furthermore, sex differences are observed both in the magnitude of inequalities and in the explanatory factors.
The use of visual tools such as the metro map, combined with easily understandable indicators like life expectancy, constitutes an effective strategy to communicate inequalities and guide equity-oriented public policies. Integrating this approach into urban planning and health strategies could contribute to improving population health, with particular attention to the most vulnerable groups and territories.
Availability of databases and material for replicationThe data are available on request. This request should be forwarded to the author Eva de Santiago Cortés (evadesantiagocortes@gmail.com). The database has not been published because some of the information was only made available for investigative use from a third party.
Social determinants of health have a significant influence on life expectancy and mortality. Spatial distribution generates social inequalities that affect population health. Health inequalities by sex are associated with social determinants, with distinct patterns observed in men and women.
What does this study add to the literature?Georeferenced data and the Chiang II method provide rigor in measuring inequalities and reveal sex-specific patterns linking deprivation and life expectancy.
What are the implications of the results?Visualizing sex-based disparities in life expectancy linked to deprivation supports targeted and equitable public health policies.
Julia Rey-Brandariz.
Transparency declarationThe corresponding author, on behalf of the other authors guarantee the accuracy, transparency and honesty of the data and information contained in the study, that no relevant information has been omitted and that all discrepancies between authors have been adequately resolved and described.
Authorship contributionsE. de Santiago-Cortés: study design, data collection, and drafting of the manuscript. J. Martínez-Alfonso: study conception and critical review. N. Jiménez-Olivas: critical review and approval of the final version.S. Santamaría-Rodríguez: study design and approval of the final version. R. González-Crespo: study design and approval of the final version. A. Sanz-Aguado: study design and approval of the final version. M. Díaz-Olalla: study conception, data analysis and interpretation, and critical review.
AcknowledgementsWe would like to thank Antonio Bermejo Aguña, Head of the Municipal Statistics Department of the Madrid City Council, for his major contribution in providing the necessary data, which made it possible to carry out this study.
FundingThis study was funded by the Fundación de Investigación e Innovación Biosanitaria de Atención Primaria (FIIBAP). They had no role in the study design, data collection and analysis, decision to publish, or preparation of the manuscript.
Conflicts of interestNone.


