


The 1st International Conference on Safety and Public Health
More infoTo assess the case of work accidents during period (2009–2022) based on work shifts, workers age, and accident types.
MethodThe study design was a time series design with data on work accidents at the company period 2009–2015 as the population.
ResultsThe variable work shift in 2009–2015 was dominated by work accidents on morning shift and night shift of 0.47%. After a projection, it was found that work accidents occurring during the shift will drop from 0.22% to 0.11%. For the years 2009–2015, accidents were dominated by age group of >50 years with a percentage of 0.52%. In 2022 for that category fell by 0%. For work accidents that occurred in 2009–2015, the most cases were falling from a height with a percentage of 0.76–0.17%. In the next seven years, the projection results obtained the highest results turned into work accident with dangerous substances with a percentage of 0.17% in 2016 and increased to 0.30% in 2022.
ConclusionsThe trends and predictions from 2016 to 2022 were a decrease in work accidents based on work, a decrease in accidents based on the workers age, and also a decrease on the variable type of accident.
Work accidents that happen in a company will cause harm to the workers and also the company. For workers, accidents that occur can result in suffering such as minor or severe injuries, even death.1 Whereas the company must cover medical expenses and medical and hospital costs or even bear the costs of burial if the victim dies, lost work time of the affected employee and fellow workers who help to hinder the smooth running of the work, recruit new employees and provide training and can also reduce the mental or psychological condition of other workers.2 A recent research show that implementation of occupational safety and health program in company is a profitable investment.3
Indonesia is one of the countries that has not achieved the Zero Accident target to reduce the prevalence of workplace accidents. To see the rate of increase in workplace accidents, we need a forecasting or projection method, so that the number of workplace accidents can be predicted.4 Statistical and epidemiological approaches have been used for projections of workplace accidents. So by using quantitative forecasting, the prevalence of workplace accidents can be predicted in the future. Work accidents must be viewed from various sides, such as the cause of the accident, the age of the worker, work shift, type of work, work unit, location, etc.5 This study was aimed to find out trends and projections of work accidents from 2009 to 2022 at PT. Semen Tonasa based on work shifts, workers age and accident types as variables.
MethodA quantitative analysis with a cross-sectional study was used in this study along with secondary data. The population in this study is all the work accident data in PT. Semen Tonasa from 2009 to 2015, no sampling was conducted in this study. In other words, this study is enumerated. It means that all data from PT. Semen Tonasa from 2009 to 2015 serves as the unit of analysis. The data in this study obtained from documents that the company provided in a form of work accident report and work accident investigation report. To know the work accident trend and projection, data analysis was performed using the SPSS program and Microsoft Excel.
ResultsAnalysis of work accident trend and projection based on work shifts in 2009–2022The trend of work accidents that are based on work shifts from 2009–2015 occurs mostly in the morning shift each year. The highest accident occurred in 2009 for workers who worked in the morning and night shifts at 0.47% where the data is presented as a percentage rate. The lowest and downward accident trend occurred in the afternoon shift from 2009–2015. In the afternoon shift, the lowest occupational accidents in 2011 and 2014 were no accidents and the highest occurred in 2009 by 0.41%.
From the data above, it can be predicted that the trend of work accidents for the next 7 years work shift seen in the work accident trend from 2009–2015. After calculating the average work accident every year and then setting the standard deviation for the last year (2015), it can be predicted that the work accident trend for 2016–2022 through least square method with time series analysis (Table 1).
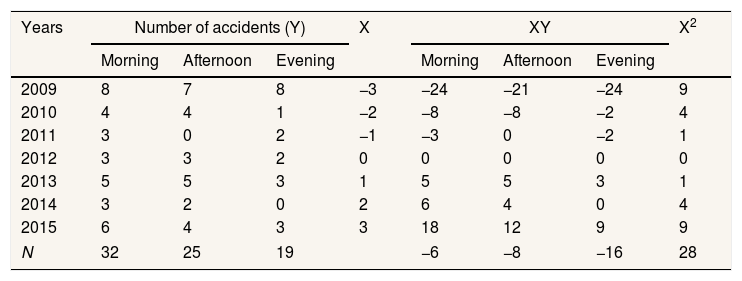
Time series analysis work accidents based on work shifts.
| Years | Number of accidents (Y) | X | XY | X2 | ||||
|---|---|---|---|---|---|---|---|---|
| Morning | Afternoon | Evening | Morning | Afternoon | Evening | |||
| 2009 | 8 | 7 | 8 | −3 | −24 | −21 | −24 | 9 |
| 2010 | 4 | 4 | 1 | −2 | −8 | −8 | −2 | 4 |
| 2011 | 3 | 0 | 2 | −1 | −3 | 0 | −2 | 1 |
| 2012 | 3 | 3 | 2 | 0 | 0 | 0 | 0 | 0 |
| 2013 | 5 | 5 | 3 | 1 | 5 | 5 | 3 | 1 |
| 2014 | 3 | 2 | 0 | 2 | 6 | 4 | 0 | 4 |
| 2015 | 6 | 4 | 3 | 3 | 18 | 12 | 9 | 9 |
| N | 32 | 25 | 19 | −6 | −8 | −16 | 28 | |
Source: Secondary Data, 2009–2015.
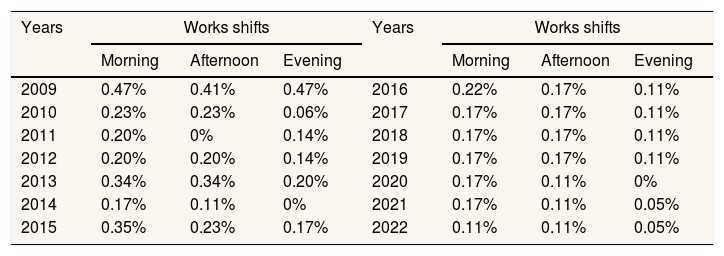
Thus the prediction of work accidents for 2016–2022, can be calculated with the regression equation Y=a+bX. Note: Y is the variable sought for trend and X is the time variable (year). Whereas to find the values of constants (a) and parameters (b) are: a=ΣY/N and b=ΣXY/ΣX2. The work shift trend is decreasing every year from 76 accidents in 2009–2015 to 2009–2022 to 49 accidents in total with 21 cases in morning work shift, 18 cases in afternoon cases, and 10 cases in evening cases. The decrease in the work shift from 2016 to 2017 occurred in the morning shift which decreased by 0.05% (from 0.22% to 0.17%) then from 2017–2021 most in the morning shift remained stable at 0.17% and again decreased by 0.06% in 2022 (from 0.17% to 0.11%). The comparison can be seen in Table 2.
Work accident prediction based on work shift seven years later.
| Years | Works shifts | Years | Works shifts | ||||
|---|---|---|---|---|---|---|---|
| Morning | Afternoon | Evening | Morning | Afternoon | Evening | ||
| 2009 | 0.47% | 0.41% | 0.47% | 2016 | 0.22% | 0.17% | 0.11% |
| 2010 | 0.23% | 0.23% | 0.06% | 2017 | 0.17% | 0.17% | 0.11% |
| 2011 | 0.20% | 0% | 0.14% | 2018 | 0.17% | 0.17% | 0.11% |
| 2012 | 0.20% | 0.20% | 0.14% | 2019 | 0.17% | 0.17% | 0.11% |
| 2013 | 0.34% | 0.34% | 0.20% | 2020 | 0.17% | 0.11% | 0% |
| 2014 | 0.17% | 0.11% | 0% | 2021 | 0.17% | 0.11% | 0.05% |
| 2015 | 0.35% | 0.23% | 0.17% | 2022 | 0.11% | 0.11% | 0.05% |
Source: Primary Data, 2016.
Trend of work accidents that occur based on the age of workers from 2009–2015 many occur at the age of 41–50 years. The highest accident occurred in 2009 at the age of >50 years at a rate of 0.52%. The lowest accident trend occurred from 2009–2015 at the age of 21–30 years. In 2014, the accident trend experienced a decline from all ages of workers by 0.05–0.11%.
The total number of work accidents based on workers age in 2009–2015 that occurred was 76 cases, with 16 cases at the age of 21–30 years, there were 11 cases at the age of 31–40 years, there were 27 cases at the age of 41–50 years, and there were 22 cases at the age of >50 years. The work accidents trend in 2016–2022 can be predicted through the Least Square Method with time series analysis can be seen in Table 3.
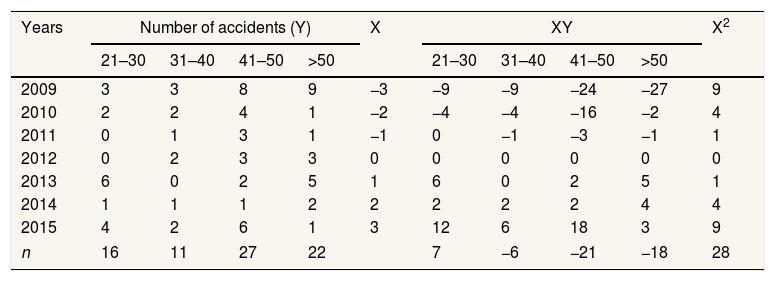
Time series analysis work accidents based on workers age.
| Years | Number of accidents (Y) | X | XY | X2 | ||||||
|---|---|---|---|---|---|---|---|---|---|---|
| 21–30 | 31–40 | 41–50 | >50 | 21–30 | 31–40 | 41–50 | >50 | |||
| 2009 | 3 | 3 | 8 | 9 | −3 | −9 | −9 | −24 | −27 | 9 |
| 2010 | 2 | 2 | 4 | 1 | −2 | −4 | −4 | −16 | −2 | 4 |
| 2011 | 0 | 1 | 3 | 1 | −1 | 0 | −1 | −3 | −1 | 1 |
| 2012 | 0 | 2 | 3 | 3 | 0 | 0 | 0 | 0 | 0 | 0 |
| 2013 | 6 | 0 | 2 | 5 | 1 | 6 | 0 | 2 | 5 | 1 |
| 2014 | 1 | 1 | 1 | 2 | 2 | 2 | 2 | 2 | 4 | 4 |
| 2015 | 4 | 2 | 6 | 1 | 3 | 12 | 6 | 18 | 3 | 9 |
| n | 16 | 11 | 27 | 22 | 7 | −6 | −21 | −18 | 28 | |
Source: Secondary Data, 2009–2015.
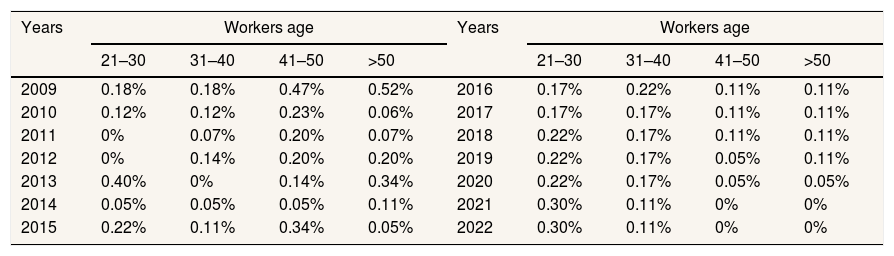
Thus the prediction of work accidents for 2016–2022, can be calculated with the regression equation Y=a+bX. To find the values of a and b are a=16/7=2.3 and b=7/28=0.25. The linear line equation is Y=2.3+(0.25) X. For 2016 the value of X is 4. The total number of work accidents based on workers age in 2016 to 2022 that predicted to occurred was 66 cases, with 28 cases at the age of 21–30 years, there were 21 cases at the age of 31–40 years, there were 8 cases at the age of 41–50 years, and there were 9 cases at the age of >50 years. The age trend of workers prediction result has decreased every year starting from 2009–2022, the decline in the age of these workers occurred at the age of 41–50 years and >50 from 2016–2022 down about 0.15%, while at the age of 21–30 years and 31–41 years there was a very significant increase of 0.23% and continued to increase until 2022. The results of the comparison can be seen in Table 4.
Work accident prediction based on workers age.
| Years | Workers age | Years | Workers age | ||||||
|---|---|---|---|---|---|---|---|---|---|
| 21–30 | 31–40 | 41–50 | >50 | 21–30 | 31–40 | 41–50 | >50 | ||
| 2009 | 0.18% | 0.18% | 0.47% | 0.52% | 2016 | 0.17% | 0.22% | 0.11% | 0.11% |
| 2010 | 0.12% | 0.12% | 0.23% | 0.06% | 2017 | 0.17% | 0.17% | 0.11% | 0.11% |
| 2011 | 0% | 0.07% | 0.20% | 0.07% | 2018 | 0.22% | 0.17% | 0.11% | 0.11% |
| 2012 | 0% | 0.14% | 0.20% | 0.20% | 2019 | 0.22% | 0.17% | 0.05% | 0.11% |
| 2013 | 0.40% | 0% | 0.14% | 0.34% | 2020 | 0.22% | 0.17% | 0.05% | 0.05% |
| 2014 | 0.05% | 0.05% | 0.05% | 0.11% | 2021 | 0.30% | 0.11% | 0% | 0% |
| 2015 | 0.22% | 0.11% | 0.34% | 0.05% | 2022 | 0.30% | 0.11% | 0% | 0% |
Source: Primary Data, 2016.
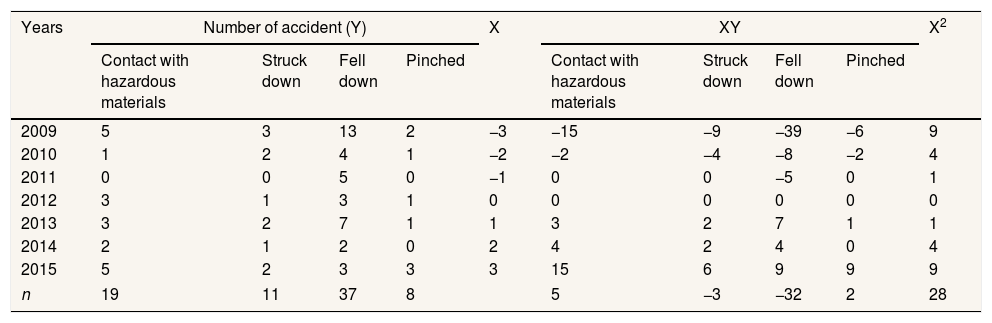
The trend of work accidents that occur based on the types of accidents from 2009–2015 mostly occurs on the type of accident that is falling. The highest accident based on the rate occurred in the year 2009 amounting to 0.76% accidents are falling. The lowest accident was in the type of accident that was squashed by 0–0.18%, starting in 2009–2014, and 2015 there was a slight increase.
The total work accidents that occurred were 76 cases, with details of 19 cases of contact with hazardous materials, 11 cases were struck down, 37 cases were fell down and there were 8 cases of being pinched. The work accidents trend in 2016–2022 can be predicted through the Least Square Method with time series analysis can be seen in Table 5.
Time series analysis work accidents based on accidents type.
| Years | Number of accident (Y) | X | XY | X2 | ||||||
|---|---|---|---|---|---|---|---|---|---|---|
| Contact with hazardous materials | Struck down | Fell down | Pinched | Contact with hazardous materials | Struck down | Fell down | Pinched | |||
| 2009 | 5 | 3 | 13 | 2 | −3 | −15 | −9 | −39 | −6 | 9 |
| 2010 | 1 | 2 | 4 | 1 | −2 | −2 | −4 | −8 | −2 | 4 |
| 2011 | 0 | 0 | 5 | 0 | −1 | 0 | 0 | −5 | 0 | 1 |
| 2012 | 3 | 1 | 3 | 1 | 0 | 0 | 0 | 0 | 0 | 0 |
| 2013 | 3 | 2 | 7 | 1 | 1 | 3 | 2 | 7 | 1 | 1 |
| 2014 | 2 | 1 | 2 | 0 | 2 | 4 | 2 | 4 | 0 | 4 |
| 2015 | 5 | 2 | 3 | 3 | 3 | 15 | 6 | 9 | 9 | 9 |
| n | 19 | 11 | 37 | 8 | 5 | −3 | −32 | 2 | 28 | |
Source: Secondary Data, 2009–2015.
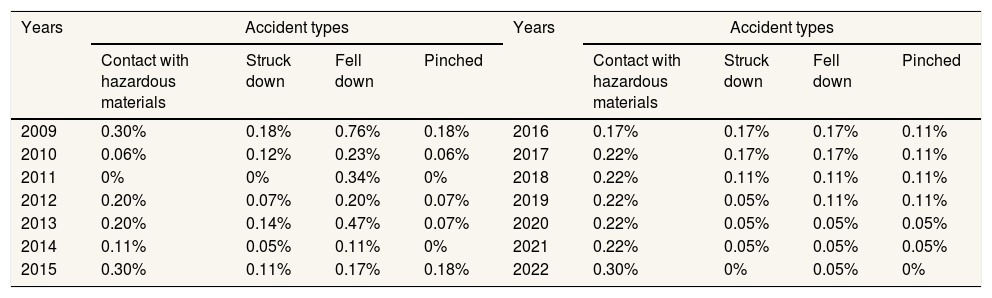
To find the values of a and b are a=19/7=2.72 and b=5/28=0.18. The linear line equation is Y=2.72+(0.18) X. Using these equations, we can predict accidents contact with hazardous substances in 2016: Y=2.72+(0.18) (for 2016 the value of X is 4). The total work accidents that predicted to occur in 2016 to 2022 were 63 cases, with details of 28 cases of contact with hazardous materials, 10 cases were struck down, 12 cases were dropped and there were 13 cases of being pinched. We can see the trend of types of accidents decreases every year starting from 2009–2022, this decrease occurs in all types of accidents but there is a slight change in which in the previous 7 years namely 2009–2015 work accidents often occur in the type of accident is falling, now there changes from falling to contact with hazardous materials in 2016–2022 where the difference is only around 0.5%. The results of the comparison can be seen in Table 6.
Work accident prediction based on accident types.
| Years | Accident types | Years | Accident types | ||||||
|---|---|---|---|---|---|---|---|---|---|
| Contact with hazardous materials | Struck down | Fell down | Pinched | Contact with hazardous materials | Struck down | Fell down | Pinched | ||
| 2009 | 0.30% | 0.18% | 0.76% | 0.18% | 2016 | 0.17% | 0.17% | 0.17% | 0.11% |
| 2010 | 0.06% | 0.12% | 0.23% | 0.06% | 2017 | 0.22% | 0.17% | 0.17% | 0.11% |
| 2011 | 0% | 0% | 0.34% | 0% | 2018 | 0.22% | 0.11% | 0.11% | 0.11% |
| 2012 | 0.20% | 0.07% | 0.20% | 0.07% | 2019 | 0.22% | 0.05% | 0.11% | 0.11% |
| 2013 | 0.20% | 0.14% | 0.47% | 0.07% | 2020 | 0.22% | 0.05% | 0.05% | 0.05% |
| 2014 | 0.11% | 0.05% | 0.11% | 0% | 2021 | 0.22% | 0.05% | 0.05% | 0.05% |
| 2015 | 0.30% | 0.11% | 0.17% | 0.18% | 2022 | 0.30% | 0% | 0.05% | 0% |
Source: Primary Data, 2016.
The prediction trend of work accident numbers based on work shifts in 2009–2015 was dominated by morning shifts of 0.47–0.35% while in the predictions of 7 years to come there will be a decrease in 2016–2022 ranging from 0.22–0.11%, then the trend of afternoon work shift accidents in 2009–2015 amounted to 0.41–0.23% while the predictions for 2016–2022 decreased by 0.17–0.11%, then for the accident trend the night shift in 2009–2015 occurred at 0.47–0.17% while for the prediction of 7 years to come 2016–2022 there was a decline from 0.11–0.05%. The decline in work shifts in 2009–2015 into the future is expected to train workers competency training related to occupational safety and health, welfare and capacity to work, and encourage innovation, quality and efficiency through continuous improvement.6 The OSH management system in the company has begun to improve and understand how to apply OSH that is good and right or it could be that there are also many unreported or unreported accidents and the management has understood how to enforce work shifts properly.
Based on the age of the workers, the highest prediction trend for work accident rates from each year is different, in 2016 the highest was at the age of 31–40 years at 0.22%, the highest in 2017 at the age of 21–30 and 31–40 years, respectively amounted to 0.17% and in 2022 the highest at the age of 21–30 years was 0.30%. In the years 2009–2015 dominated by age >50 years while in the coming year that is 2016–2022 there have been significant changes that occur a lot in the age of 21–30 years. Young workers are chosen because they are physically strong, but they are usually still full of emotions, carelessness, and lack of experience, so that often leads to actions that endanger his safety. One other important factor as a cause of accidents in young workers is the lack of a sense of responsibility.7 Same with the research in Iran, the workers involved in occupational health is workers with the age 34 years old below due to lack of their experiences.8
Based on the type of accident, the prediction trend for the number of accidents occurring in 2009–2015 is dominated by the type that is falling by 0.76–0.17% while the prediction for the next 7 years, 2016–2022, ranges from 0.17–0,05%, then the trend of accidents that are in contact with hazardous materials in 2009–2015 remained stable while the predictions for 2016–2022 amounted to 0.17–0.30%, then for accident trends that were stricken in 2009–2015 a decrease of 0.18–0.11% while for the prediction of 7 years to come 2016–2022 there is a decrease to reach zero accident 0%, for the trend of a pinched accident in 2009–2015 remains stable and for the prediction of 2016–2022 will decrease from 0.11–0%. One of the factors that can lead into an accident is the environment. A study in China coal mine, work environment can cause the accident 74.6% because of unawareness of unsafe factors in the work environment.9 The work environment is an inseparable part of the type and location of work because one of the work productivity depends on the place and work environment. Therefore, the work environment needs to get serious and major attention. The condition of the workplace environment in which workers carry out their daily activities contains many direct and indirect dangers to workers safety and health.10 The decrease in occupational accidents can be caused by changes in the work environment that is increasingly conducive every year, workers knowledge and awareness are increasing.
ConclusionsTrend and prediction of work shift variables from 2009–2015 is 76 accidents and going down to 49 accidents in 2016–2022 and still dominated by morning shift work accidents from 0.47–0.35% in 2009–2015 to 0.22–0.11% in 2016–2022. For workers age prediction, the work accidents number is also decreasing from 76 cases in 2009–2015 to 66 cases in 2016–2022. But there was a change in cases that occurred in the previous 7 years (2009–2015), work accidents were dominated by workers in the age category 41–50 years old by 27 cases and >50 years old by 22 cases. Whereas for the next 7 years prediction, it was dominated by young workers namely the age category 21–30 years old with as many as 23 cases and 31–40 years old with 21 cases. Occupational accident case variable type of accidents also decreased in the projected occurrence. In 2009 to 2015 there were 76 cases and decreased to 63 cases in 2016 to 2022. For the years 2009 to 2015, work accidents were dominated by accidents falling from a height with a total of 37 cases with a percentage of 0.76–0.17%. After projecting work accidents that will occur for 2016 to 2022, contact with hazardous materials with 28 cases with a percentage of 0.17–0.30%.
Conflicts of interestsThe authors declare that they have no conflict of interest.
Peer-review under responsibility of the scientific committee of the 1st International Conference on Safety and Public Health (ICOS-PH 2020). Full-text and the content of it is under responsibility of authors of the article.


