


To evaluate the air quality to which a population of 90,000 inhabitants in the province of Gipuzkoa (Basque Country, Spain) is exposed. The population resides in a periurban environment, where industrial activity (11 iron and steel foundries) is scattered among residential areas.
MethodsThroughout 2006 and 2007, levels of particulate matter less than 2.5mm in diameter (PM2.5) were quantified and levels of trace elements in PM2.5 fraction [cadmium (Cd), arsenic (As), manganese (Mn), copper (Cu), chromium (Cr), nickel (Ni), iron (Fe), lead (Pb), mercury (Hg) and zinc (Zn)] were analyzed. The samples were gathered in seven sampling sites using three high-volume Digitel DAH 80 samplers. Annual and seasonal variability were evaluated for the various contaminants in each valley and PM10 and PM2.5 samples were also gathered at the same site for a month, with the goal of analyzing the composition of trace elements in each particle size. Finally, the results were compared with those obtained from the same study area by the Basque Government Air Quality Network equipment.
ResultsThe observed PM2.5 concentrations (12.2–28.9μg/m3) were similar to those described in urban environments in large European cities, while mean trace element concentrations were significantly higher. The Mn levels observed in all three valleys indicated the influence of the steel and metal industries on air quality.
ConclusionThe finding that levels of particulate matter and trace elements in the study area were similar to or higher than those found in metropolitan areas has implications for the evaluation of health risks in populations far from large population centers.
El objetivo del estudio es evaluar la calidad del aire a la que está expuesta una población de 90.000 habitantes de Gipuzkoa que residen en un entorno periurbano, donde las actividades industriales (11 industrias siderometalúrgicas) se entremezclan con zonas residenciales en la propia trama urbana.
MétodosSe cuantificaron las concentraciones de partículas de 2,5mm de diámetro (PM2.5) y se analizaron los elementos traza asociados a PM2.5: cadmio (Cd), arsénico (As), manganeso (Mn), cobre (Cu), cromo (Cr), níquel (Ni), hierro (Fe), plomo (Pb), mercurio (Hg) y zinc (Zn) a lo largo de 2006 y 2007. Las muestras se recogieron a partir de 3 captadores de alto volumen DIGITEL Modelo DAH 80 en 7 puntos de muestreo. Se analizó la variabilidad anual así como la variabilidad estacional de los diferentes contaminantes en cada valle. Asimismo, se recogieron muestras de PM10 y PM2.5 con equipos similares durante un mes y en el mismo sitio para analizar la composición de los elementos traza en las diferentes fracciones PM10 y PM2.5. Por último, los resultados fueron comparados con los de los equipos de la Red de Calidad del Aire del Gobierno Vasco ubicados en la misma área de estudio.
ResultadosLas concentraciones de PM2.5 observadas (12.2–28.9μg/m3) fueron similares a las descritas en entornos urbanos de grandes ciudades europeas. Las concentraciones medias de elementos traza, en cambio, superaron con gran diferencia a las de las ciudades europeas. Las concentraciones de Mn encontradas en los tres valles indican la influencia de la industria siderometalúrgica en la calidad del aire.
ConclusiónLos resultados de partículas y elementos traza encontrados en el área de estudio presentan valores similares o superiores a las áreas metropolitanas, lo cual tiene implicaciones en la valoración del riesgo en la salud de entornos apartados de los grandes núcleos de población.
Air pollution is an important public health problem, as environmental epidemiology studies have consistently shown. Airborne particulate matter (PM) is currently one of the principal air pollutant health concerns in urban areas. Several epidemiological studies have found consistent associations between exposure to ambient particulate matter and adverse health effects, including increased mortality, hospitalization for respiratory or cardiovascular disease, and respiratory symptoms and decreased lung function1–3. Metal exposure, related to industrial emissions or traffic, is associated with heart rate variability4, increase in hospital emergency visits for respiratory conditions5 and increased risk of lung cancer after long term exposure6.
Particulate matter is emitted by a wide variety of natural and anthropogenic sources which influence its physical properties (e.g. size, specific surface, density or number-density) and chemical composition7. The relative proportions of the different components and the impact on human health are highly variable according to the type of sampling station8,9. For example, air in industrial and metropolitan areas is more contaminated with heavy metals than air in rural areas10,11. According to Nerriere et al.12, metal traces vary in relation to particle size (PM2.5 or PM10). Elements emitted through combustion processes (Ni, V, Pb) are present in higher proportions in PM2.5 than in PM1013. The main source of particle emissions in urban environments is usually traffic, although in highly industrial areas, traffic pollution may be secondary, depending on the composition of the particles emitted by the industrial activity14–16. Seasonal variability can also be observed in PM metal composition due to fluctuations in emission source17.
Particulate matter with aerodynamic diameter of less than 2.5mm (PM2.5) has been proven to be more harmful than PM10, given the greater ease with which it may penetrate the alveoli18,19. Time-series epidemiological studies have highlighted that exposure to PM2.5 leads to an increase in morbidity and mortality3. As a consequence, health protection legislation has begun to include smaller particles, an example of this being European Directive 2008/50/EC, which sets a limit of 25mg/m3 for PM2.5 over the course of one year, with target compliance by 2015.
The objectives of this study were: 1) to describe seasonal variation in PM2.5 levels in the area of study; 2) to characterize the trace elements composition (Cd, As, Mn, Cu, Cr, Ni, Fe, Pb, Hg and Zn; 3) to analyze the relationship between PM2.5 and PM10; and 4) to compare the trace elements in the PM2.5 and PM10 fractions.
MethodsStudy area and sampling sitesThe study area, located in the province of Gipuzkoa (Basque Country, Spain), covers 519km², including three narrow valleys. The population of the area is approximately 88,000 inhabitants, spread out between 25 small towns. The main activity in the area is the iron and steel industry, with a total of 11 companies in the sector (recorded in the Spanish Emissions and Pollutant Sources Register, EPER-2006). While the industry contributes significantly to atmospheric pollution, another source to be taken into consideration is the traffic, given that roads with high traffic density (between 10,000 and 40,000 vehicles/day) run through all three valleys.
This investigation focuses on analyzing atmospheric pollution in the form of PM2.5 and the trace elements associated to these particles, in seven towns with populations ranging between 1,000 and 14,000 inhabitants: Azkoitia and Azpeitia (Urola Medio Valley), Legazpia and Zumarraga (Urola Alto Valley), Beasain, Olaberria and Ataun (Oria Valley). Six of the towns shared very similar air pollution sources (steel foundry and high traffic level) and one, Ataun, was considered as urban background.
SamplingDaily PM2.5 and Pb, Cr, As, Ni, Cd, Fe, Mn and Cu concentrations were obtained along May 2006 and December 2007. Throughout the study period, 24-h sampling was carried out over a period of 238 days in Urola Medio Valley, 220 days in Urola Alto Valley and 451 days in Oria Valley. Hg content was analyzed in only 25% and Zn content in 17% of the samples. The remainder of the trace elements were analyzed in 100% of samples. Three Digitel DAH 80 high-volume samplers fitted with PM2.5 inlets were used to gather the samples. Two of the samplers were rotated monthly between the three valleys, in 6 sampling sites, in order to gather quarterly information for each valley. The third device was continuously at Beasain site, Oria Valley. Two high-volume samplers were installed in parallel in the town of Azkoitia during July 2007, in order to collect both PM10 and PM2.5 samples.
Hourly PM2.5/PM10 concentrations were measured at Azpeitia and Beasain during the whole study period by means of β-radiation attenuation method equipments, provided by the Basque Government's Air Quality Network (henceforth `Network'). In Azpeitia, the high-volume sampler was located in the same place as the Azpeitia-Network equipment and in Beasain, the distance between the two devices (high-volume sampler and Network station) was approximately 500m. The sampling period was the same for both sets of equipment. Meteorological hourly data was obtained from the both Network’s sites.
The Digitel samplers were used at a flow rate of 30.0±1.5m3/h in ambient conditions for 24h, thus guaranteeing a quantification limit of 2μg/m3. Particles were collected on Whatman® QMA 150-mm, quartz-fibre filters. The filters were kept in controlled conditions in the laboratory before and after sampling, which involved monitoring the ambient temperature (20±1°C) and relative humidity (50±5%) for a minimum of 48h. The particle matter was weighted using a gravimetric method on calibrated scales with maximum uncertainty of 0.09mg (K=2).
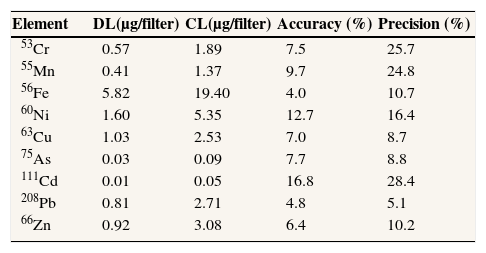
Chemical analysisTrace element content was determined by analysis of the filters digested with concentrated nitric acid,* at a temperature of 120°C for 18h. The 16% of the filter was used for digestion. The digested samples were processed using an inductively coupled plasma mass spectrometry (ICP-MS) system (Agilent 7500a) with a Babington nebulizer with high tolerance for dissolved solids and a collision cell. Table 1 displays the method validation statistics, including accuracy and precision at the quantification level. The certified reference material “Vehicle Exhaust Particulates,” produced by the National Institute of Environmental Studies, was used for validation.
Method validation statistics
| Element | DL(μg/filter) | CL(μg/filter) | Accuracy (%) | Precision (%) |
| 53Cr | 0.57 | 1.89 | 7.5 | 25.7 |
| 55Mn | 0.41 | 1.37 | 9.7 | 24.8 |
| 56Fe | 5.82 | 19.40 | 4.0 | 10.7 |
| 60Ni | 1.60 | 5.35 | 12.7 | 16.4 |
| 63Cu | 1.03 | 2.53 | 7.0 | 8.7 |
| 75As | 0.03 | 0.09 | 7.7 | 8.8 |
| 111Cd | 0.01 | 0.05 | 16.8 | 28.4 |
| 208Pb | 0.81 | 2.71 | 4.8 | 5.1 |
| 66Zn | 0.92 | 3.08 | 6.4 | 10.2 |
CL: critical limit; DL: detection limit.
Air quality in the study area was evaluated by comparing the mean annual values with the values set by EU Directive 2008/50/EC for PM2.5, 2004/107/EC for As, Cd and Ni and by Directive 1999/30/EC for Pb. Mn, Cr and Hg were compared with the World Health Organization (WHO) proposed values20.
In order to determine annual and seasonal variations of the pollutants in each valley, mean values for each year and season were calculated and compared using ANOVA. Pearson’s coefficient was used to calculate the degree of linear association between different towns located in the same valley. Four linear regression models were constructed using the data from both the Network and the study.
The dependent variable in the first model was the Beasain-Network PM10 and the independent variable was PM2.5 from Beasain sampler. The dependent variable for the second and third models was the Azpeitia-Network PM10 and the independent variables were the Network PM2.5 and the PM2.5 from the sampler, respectively. The fourth model was constructed using the Network-Azpeitia PM2.5 as the dependent variable and PM2.5 (from Azpeitia sampler) as the independent variable. Finally, the percentage composition of each trace element associated to PM10 and PM2.5 was calculated, based on the two samplers installed in Azkoitia.
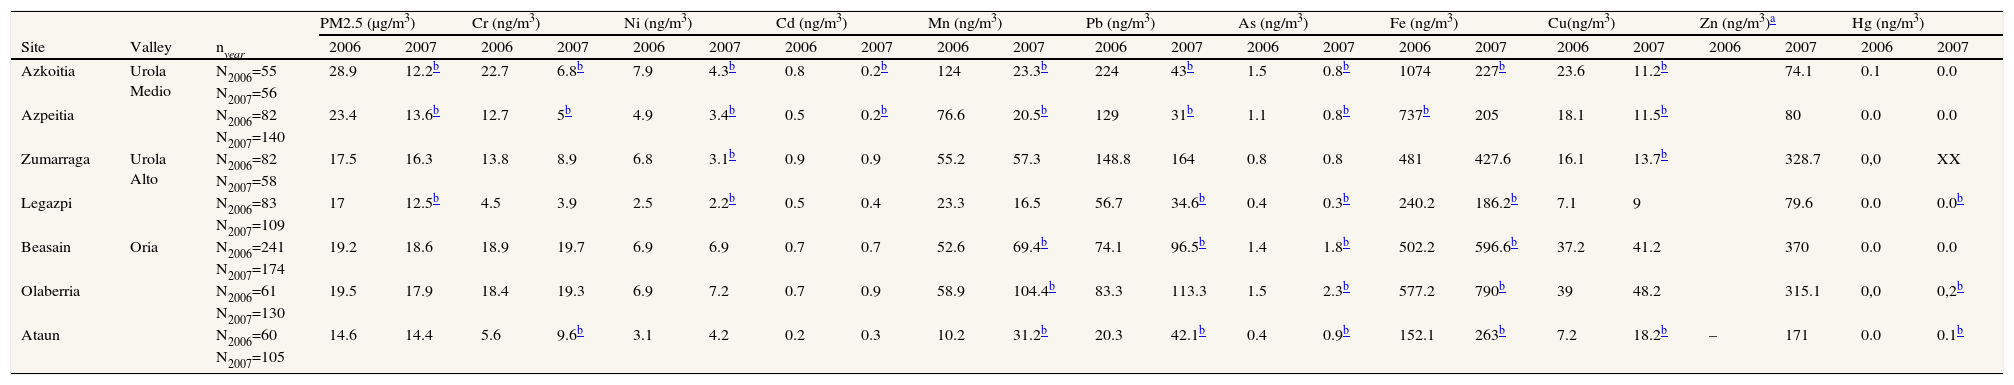
ResultsTable 2 shows the mean PM2.5 and trace element concentrations recorded in each monitoring site over the two years of the study. The highest PM2.5 concentrations were recorded in the towns in the Urola Medio Valley during 2006. The limit value set by the European Community (25μg/m3) was exceeded only by Azkoitia in 2006. In general, a fall in PM2.5 concentrations was observed between 2006 and 2007, which was significant in the towns of Azkoitia (28.9μg/m3 in 2006 vs. 12.2μg/m3 in 2007, a 58% decrease), Azpeitia (23.4μg/m3 in 2006 vs. 13.6μg/m3 in 2007, a 42% decrease) and Legazpi (17μg/m3 in 2006 vs. 12.5μg/m3 in 2007, a 26% decrease). None of the trace elements exceeded the guideline value. However, the mean Mn concentrations found in Urola Medio, in 2006, and in the Oria Valley, in 2007, are comparable to those found in industrial and not urban environments.
Mean concentrations of PM2.5 (mg/m3) and trace elements (ng/m3) per year, for each town
| PM2.5 (μg/m3) | Cr (ng/m3) | Ni (ng/m3) | Cd (ng/m3) | Mn (ng/m3) | Pb (ng/m3) | As (ng/m3) | Fe (ng/m3) | Cu(ng/m3) | Zn (ng/m3)a | Hg (ng/m3) | ||||||||||||||
| Site | Valley | nyear | 2006 | 2007 | 2006 | 2007 | 2006 | 2007 | 2006 | 2007 | 2006 | 2007 | 2006 | 2007 | 2006 | 2007 | 2006 | 2007 | 2006 | 2007 | 2006 | 2007 | 2006 | 2007 |
| Azkoitia | Urola Medio | N2006=55 | 28.9 | 12.2b | 22.7 | 6.8b | 7.9 | 4.3b | 0.8 | 0.2b | 124 | 23.3b | 224 | 43b | 1.5 | 0.8b | 1074 | 227b | 23.6 | 11.2b | 74.1 | 0.1 | 0.0 | |
| N2007=56 | ||||||||||||||||||||||||
| Azpeitia | N2006=82 | 23.4 | 13.6b | 12.7 | 5b | 4.9 | 3.4b | 0.5 | 0.2b | 76.6 | 20.5b | 129 | 31b | 1.1 | 0.8b | 737b | 205 | 18.1 | 11.5b | 80 | 0.0 | 0.0 | ||
| N2007=140 | ||||||||||||||||||||||||
| Zumarraga | Urola Alto | N2006=82 | 17.5 | 16.3 | 13.8 | 8.9 | 6.8 | 3.1b | 0.9 | 0.9 | 55.2 | 57.3 | 148.8 | 164 | 0.8 | 0.8 | 481 | 427.6 | 16.1 | 13.7b | 328.7 | 0,0 | XX | |
| N2007=58 | ||||||||||||||||||||||||
| Legazpi | N2006=83 | 17 | 12.5b | 4.5 | 3.9 | 2.5 | 2.2b | 0.5 | 0.4 | 23.3 | 16.5 | 56.7 | 34.6b | 0.4 | 0.3b | 240.2 | 186.2b | 7.1 | 9 | 79.6 | 0.0 | 0.0b | ||
| N2007=109 | ||||||||||||||||||||||||
| Beasain | Oria | N2006=241 | 19.2 | 18.6 | 18.9 | 19.7 | 6.9 | 6.9 | 0.7 | 0.7 | 52.6 | 69.4b | 74.1 | 96.5b | 1.4 | 1.8b | 502.2 | 596.6b | 37.2 | 41.2 | 370 | 0.0 | 0.0 | |
| N2007=174 | ||||||||||||||||||||||||
| Olaberria | N2006=61 | 19.5 | 17.9 | 18.4 | 19.3 | 6.9 | 7.2 | 0.7 | 0.9 | 58.9 | 104.4b | 83.3 | 113.3 | 1.5 | 2.3b | 577.2 | 790b | 39 | 48.2 | 315.1 | 0,0 | 0,2b | ||
| N2007=130 | ||||||||||||||||||||||||
| Ataun | N2006=60 | 14.6 | 14.4 | 5.6 | 9.6b | 3.1 | 4.2 | 0.2 | 0.3 | 10.2 | 31.2b | 20.3 | 42.1b | 0.4 | 0.9b | 152.1 | 263b | 7.2 | 18.2b | – | 171 | 0.0 | 0.1b | |
| N2007=105 | ||||||||||||||||||||||||
On comparing the mean levels of trace elements in 2006 and 2007 for each valley, a significant decrease was observed (p<0.05) in the concentrations of all trace elements in the Urola Medio Valley and a significant increase (p<0.05) in Mn, Pb, As and Fe concentrations in the Oria Valley. In Urola Alto Valley, Ni was the only metal to display a significant decrease (p<0.05) between 2006 and 2007, in both towns.
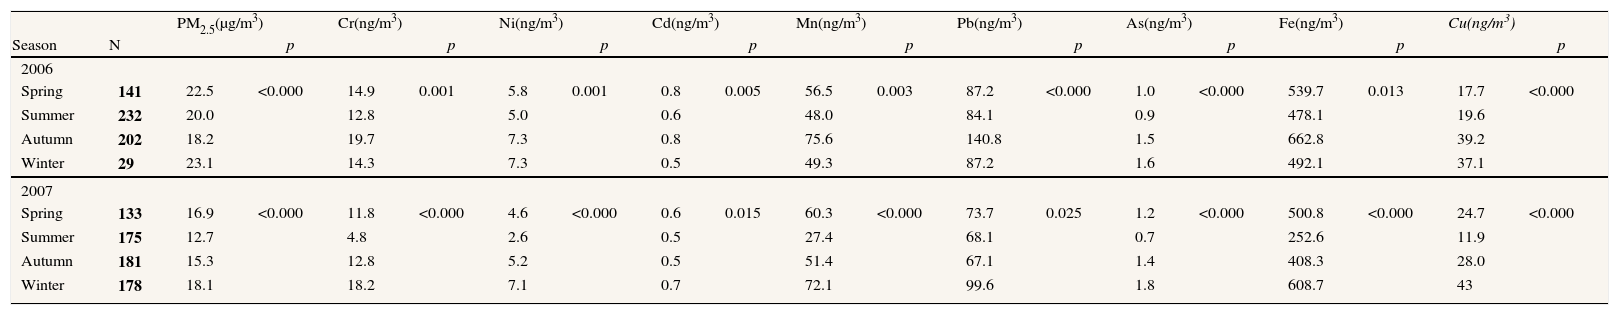
Table 3 shows the seasonal variation per year in the main pollutant levels for all towns. Significant differences (p<0.05) were observed between the seasonal means for all pollutants; the highest concentrations in 2006 were registered in autumn except for PM2.5 with the highest levels in winter and in 2007, the highest mean values were registered in autumn and winter, and the lowest in summer in both years. During the winter months, winds of SSW and ENE prevailed in Beasain-Network, and WSW/SW/SSW and NE/ENE in Azpeitia and during the summer months, ENE in Beasain and NE/ENE in Azpeitia.
Mean PM2.5 and trace elements concentrations by season
| PM2.5(μg/m3) | Cr(ng/m3) | Ni(ng/m3) | Cd(ng/m3) | Mn(ng/m3) | Pb(ng/m3) | As(ng/m3) | Fe(ng/m3) | Cu(ng/m3) | |||||||||||
| Season | N | p | p | p | p | p | p | p | p | p | |||||||||
| 2006 | |||||||||||||||||||
| Spring | 141 | 22.5 | <0.000 | 14.9 | 0.001 | 5.8 | 0.001 | 0.8 | 0.005 | 56.5 | 0.003 | 87.2 | <0.000 | 1.0 | <0.000 | 539.7 | 0.013 | 17.7 | <0.000 |
| Summer | 232 | 20.0 | 12.8 | 5.0 | 0.6 | 48.0 | 84.1 | 0.9 | 478.1 | 19.6 | |||||||||
| Autumn | 202 | 18.2 | 19.7 | 7.3 | 0.8 | 75.6 | 140.8 | 1.5 | 662.8 | 39.2 | |||||||||
| Winter | 29 | 23.1 | 14.3 | 7.3 | 0.5 | 49.3 | 87.2 | 1.6 | 492.1 | 37.1 | |||||||||
| 2007 | |||||||||||||||||||
| Spring | 133 | 16.9 | <0.000 | 11.8 | <0.000 | 4.6 | <0.000 | 0.6 | 0.015 | 60.3 | <0.000 | 73.7 | 0.025 | 1.2 | <0.000 | 500.8 | <0.000 | 24.7 | <0.000 |
| Summer | 175 | 12.7 | 4.8 | 2.6 | 0.5 | 27.4 | 68.1 | 0.7 | 252.6 | 11.9 | |||||||||
| Autumn | 181 | 15.3 | 12.8 | 5.2 | 0.5 | 51.4 | 67.1 | 1.4 | 408.3 | 28.0 | |||||||||
| Winter | 178 | 18.1 | 18.2 | 7.1 | 0.7 | 72.1 | 99.6 | 1.8 | 608.7 | 43 | |||||||||
In general, all the air pollutants gathered in the same valley showed high correlations. Levels at different sites from in Urola Medio (Azkoitia and Azpeitia) showed good correlation levels for all trace elements (0.7<r<0.8) except Fe (r≈0.5). In Oria Valley, a high degree of correlation was observed between Beasain and Olaberria sites (correlations of 0.8–0.9 for all metals and PM2.5) and between Beasain and Ataun (r values between 0.6 and 0.7 for all trace elements, except Ni and Cd, r=0.5). A more moderate correlation was noted between Olaberria and Ataun (r values between 0.5 and 0.6, except Ni and Cd, r=0.4). The level of association between the towns in the Urola Alto Valley (Zumarraga and Legazpi) was low (0.2<r<0.5).
The percentage content of each trace element in PM10 and PM2.5 was calculated from 2 high-volume samplers placed in Urola Medio Valley. Significant differences (p<0.05) were found in the percentages of Pb, Fe, Ni and Cr between the particle sizes. The percentage composition of Pb is greater in PM2.5 than in PM10, whilst the percentage of Fe, Cr and Ni is greater in PM10. Mn and Cu, however, were distributed equally between both fractions.
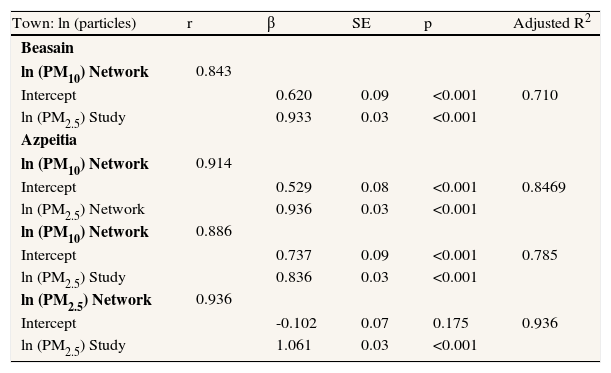
Pearson’s linear correlation between the Network’s PM10 (continuous measurement) series and the PM2.5 study series for Beasain was r=0.86, with an adjusted R2 value of 0.71 (Table 4). In Azpeitia the linear correlation between the Network’s two continuous samplers (PM10 and PM2.5) was 0.91; and between the Network’s PM10 and the study’s PM2.5, 0.87. The adjusted R2 values were 0.85 and 0.78 respectively. The correlation between the Network’s PM2.5 and the study’s PM2.5 was 0.98, with an adjusted R2 value of 0.94.
PM2.5 and PM10 linear regression models
| Town: ln (particles) | r | β | SE | p | Adjusted R2 |
| Beasain | |||||
| ln (PM10) Network | 0.843 | ||||
| Intercept | 0.620 | 0.09 | <0.001 | 0.710 | |
| ln (PM2.5) Study | 0.933 | 0.03 | <0.001 | ||
| Azpeitia | |||||
| ln (PM10) Network | 0.914 | ||||
| Intercept | 0.529 | 0.08 | <0.001 | 0.8469 | |
| ln (PM2.5) Network | 0.936 | 0.03 | <0.001 | ||
| ln (PM10) Network | 0.886 | ||||
| Intercept | 0.737 | 0.09 | <0.001 | 0.785 | |
| ln (PM2.5) Study | 0.836 | 0.03 | <0.001 | ||
| ln (PM2.5) Network | 0.936 | ||||
| Intercept | -0.102 | 0.07 | 0.175 | 0.936 | |
| ln (PM2.5) Study | 1.061 | 0.03 | <0.001 | ||
In general, the concentrations of PM2.5 observed in the study area (12.2–28.9μg/m3) were lower than those set by the European Community; the limit of 25μg/m3 was exceeded only in Urola Alto Valley, in 2006. PM2.5 values were lower in 2007 than in 2006 in all locations, which could be attributed to a range of factors such as, for example, more favourable weather conditions (a higher percentage of rainy days). With regard to trace element content associated to PM2.5 there is not any regulation. The only existing guideline values for trace elements are associated to PM10 and not to PM2.5. Therefore this study was based only on descriptive analysis of trace elements.
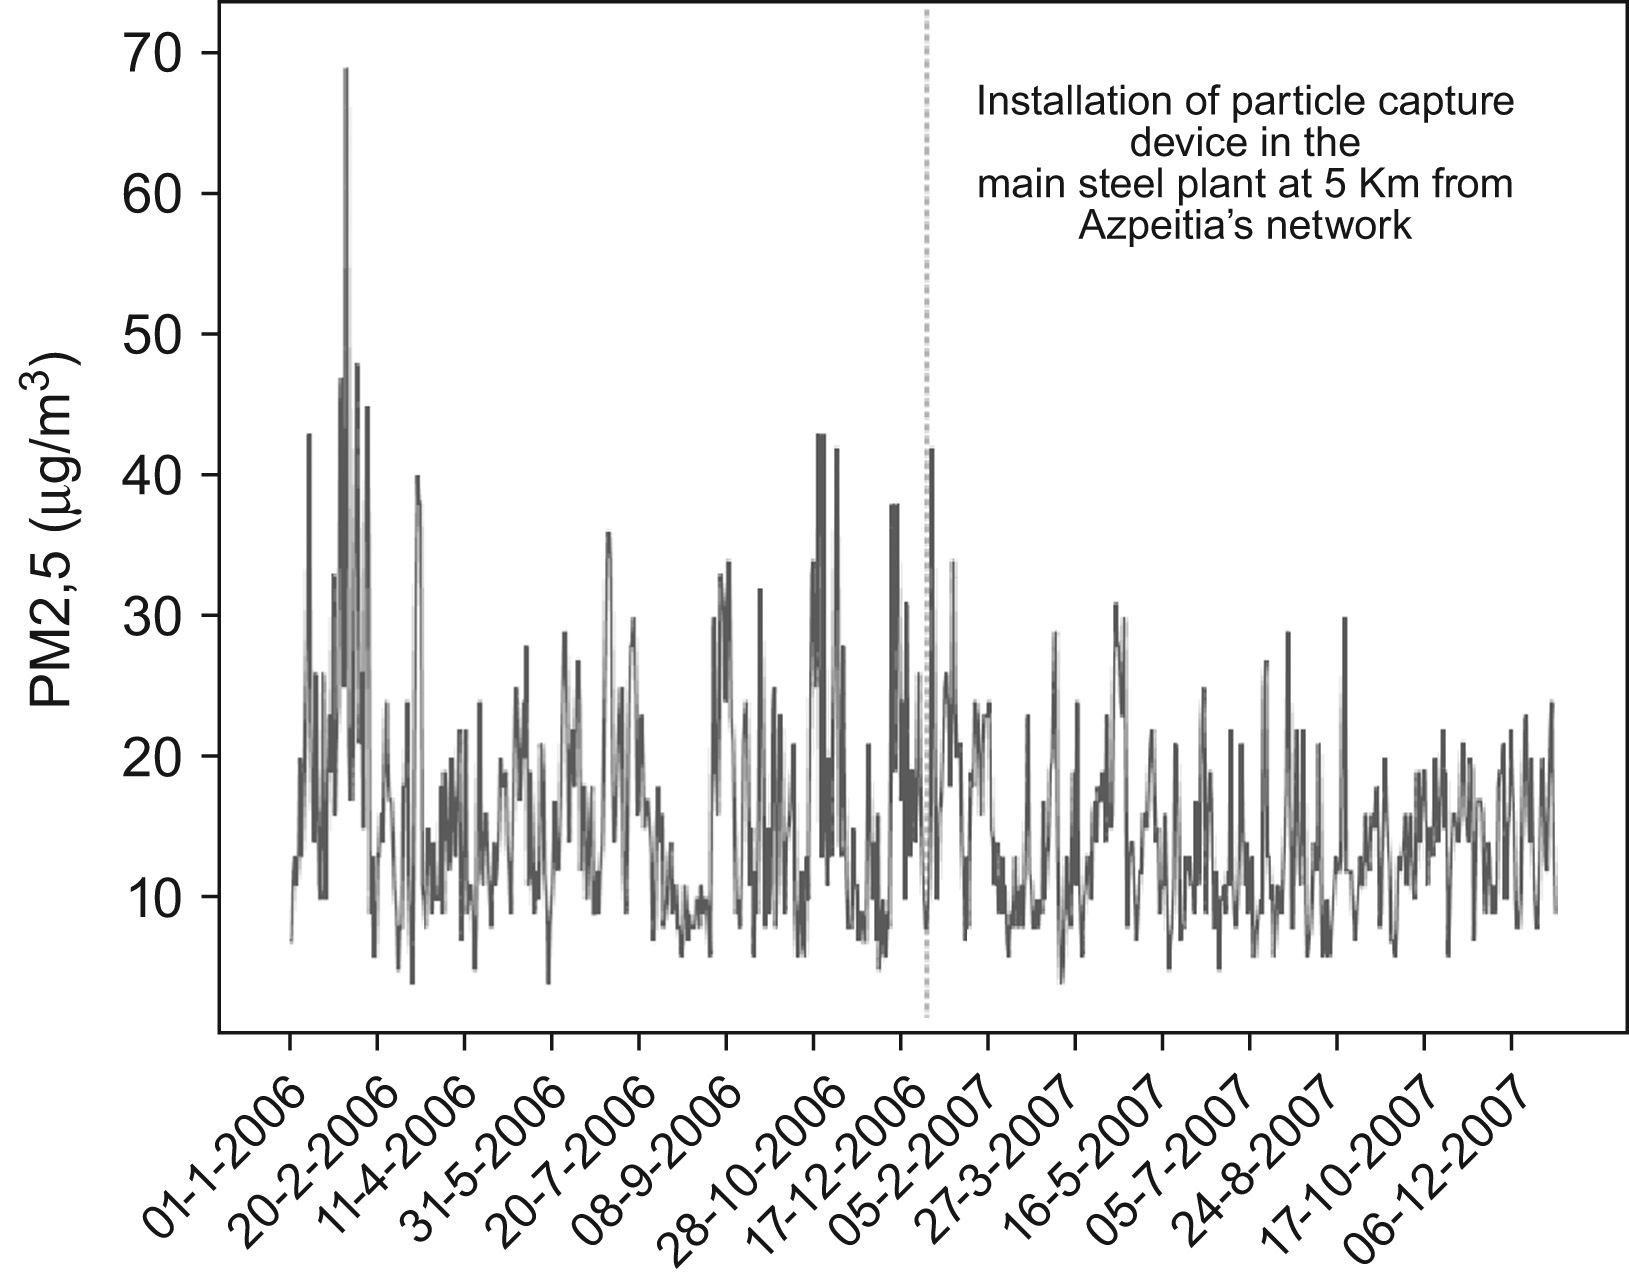
In this case, similar behaviour was observed among towns located in the same valley. The notable drop in PM2.5 and associated trace elements observed in the Urola Medio Valley, for example, could be due to the installation of a particle capture device in January 2007 in the main steel plant in Azkoitia and to the termination of the plant’s activity in July 2007. This could also be the reason for the different seasonal variations observed for all pollutants between two years. While the distance between this plant and the sampling site in either town is considerable (1.5km to Azkoitia and 4.5km to the Azpeitia sampler), the prevailing SW/NE (nocturnal drainage) winds transport the pollutants throughout the valley, evidence that can be found in the high correlation between the two sites (Pearson r values between 0.7 and 0.8). Fig. 1 shows Azpeitia-Network PM2.5 time-series of the whole period study.

The trace element levels in Beasain, Olaberria and Ataun (Oria Valley) also show similar behaviour. In this case an increase in Fe, Pb, As and Mn concentrations was observed in the three sites between 2006 and 2007. The wind direction data explains the high level of association between Olaberria and Beasain. In the case of Ataun, the mean values for trace elements found in the air (which were greater than those that have been reported for European cities) can only be explained by the fact that the town is located in the same valley.
The results for Zumarraga and Legazpi (Urola Alto Valley), were not as might have been expected. Legazpi, one of the towns with the highest levels of iron and steel foundries, displayed values lower than all other towns in the study area, both for PM2.5 and for the majority of the associated trace elements. The level of correlation between the trace elements recorded in Zumarraga and Legazpi was low (r<0.5), although the distance between these two samplers was the same as between those in Azkoitia and Azpeitia: 4.5km. This suggests, once again, that distance is not the only factor to be taken into account when evaluating air quality for a particular area. In June 2008 the Basque Government Air Quality Network placed a new equipment in Zumarraga. Wind roses have been obtained for the same months but in this case, for 2008 and 2009. The prevailing wind in winter is predominantly from the West, which is opposite to Legazpi's sampling site, and in the summer months, from the North and West. This information suggests that the air masses tend to move down the valley, towards the town of Zumarraga (especially the night drainage winds, which blow W and WSW), thus impeding the upward flow of air.
The main limitation of this study lies in the incomplete series of trace elements for all municipalities because only three high-volume samplers were available. For this reason the samplers were rotated monthly among the three valleys in order to gather information about temporal variability.
In general, a high degree of seasonal variability was observed. This could be attributed to the role played by the meteorological variables in the three valleys, as well as changes in industrial activity throughout the year, how was happened in Azkoitia. According to Querol et al, 200816, in autumn and winter, atmospheric conditions favour the accumulation of pollutants in the valleys of the Basque Country, in a phenomenon known as air mass stagnation.
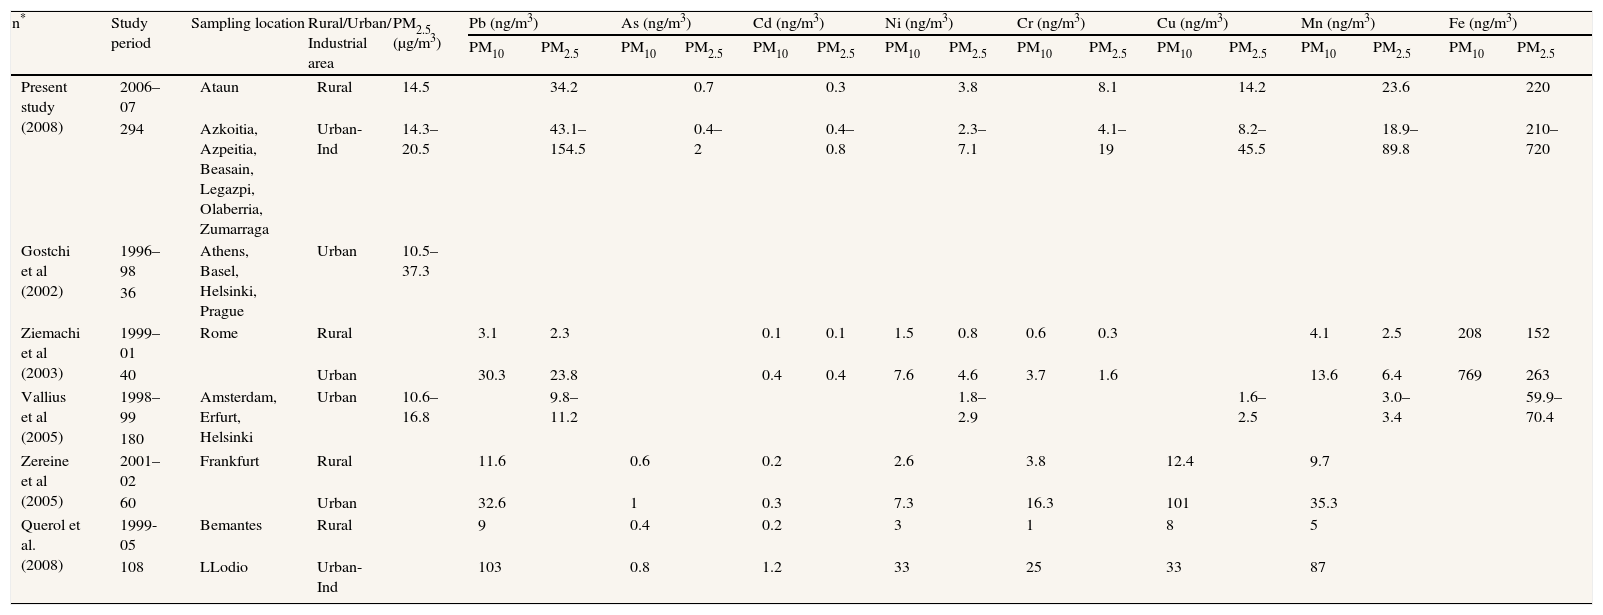
As commented before, since there is no existing regulation, few investigations have analyzed the concentrations of trace elements in the PM2.5fraction13,21,22,23,24 (Table 5). These authors describe concentrations of PM2.5 and/or various associated trace elements sampled in a range of medium to large European cities (160,000 to 4 million inhabitants): Athens, Rome, Amsterdam, Helsinki, Prague, Erfurt, Basel and Frankfurt. If one compares the range of mean PM2.5 values for the two years for the towns in Gipuzkoa (12.2–28.9μg/m3), with the results of the above-mentioned investigations (10.5–29μg/m3, except for Athens: 37.3mg/m3), the results are similar. The main source of contamination could be different, however, this being traffic in the European cities22 and industry in the present study.
Comparison of trace elements associated to PM2.5 and PM10, with other urban/rural/industrial areas
| n* | Study period | Sampling location | Rural/Urban/ Industrial area | PM2.5 (μg/m3) | Pb (ng/m3) | As (ng/m3) | Cd (ng/m3) | Ni (ng/m3) | Cr (ng/m3) | Cu (ng/m3) | Mn (ng/m3) | Fe (ng/m3) | ||||||||
| PM10 | PM2.5 | PM10 | PM2.5 | PM10 | PM2.5 | PM10 | PM2.5 | PM10 | PM2.5 | PM10 | PM2.5 | PM10 | PM2.5 | PM10 | PM2.5 | |||||
| Present study (2008) | 2006–07 | Ataun | Rural | 14.5 | 34.2 | 0.7 | 0.3 | 3.8 | 8.1 | 14.2 | 23.6 | 220 | ||||||||
| 294 | Azkoitia, Azpeitia, Beasain, Legazpi, Olaberria, Zumarraga | Urban-Ind | 14.3–20.5 | 43.1–154.5 | 0.4–2 | 0.4–0.8 | 2.3–7.1 | 4.1–19 | 8.2–45.5 | 18.9–89.8 | 210–720 | |||||||||
| Gostchi et al (2002) | 1996–98 | Athens, Basel, Helsinki, Prague | Urban | 10.5–37.3 | ||||||||||||||||
| 36 | ||||||||||||||||||||
| Ziemachi et al (2003) | 1999–01 | Rome | Rural | 3.1 | 2.3 | 0.1 | 0.1 | 1.5 | 0.8 | 0.6 | 0.3 | 4.1 | 2.5 | 208 | 152 | |||||
| 40 | Urban | 30.3 | 23.8 | 0.4 | 0.4 | 7.6 | 4.6 | 3.7 | 1.6 | 13.6 | 6.4 | 769 | 263 | |||||||
| Vallius et al (2005) | 1998–99 | Amsterdam, Erfurt, Helsinki | Urban | 10.6–16.8 | 9.8–11.2 | 1.8–2.9 | 1.6–2.5 | 3.0–3.4 | 59.9–70.4 | |||||||||||
| 180 | ||||||||||||||||||||
| Zereine et al (2005) | 2001–02 | Frankfurt | Rural | 11.6 | 0.6 | 0.2 | 2.6 | 3.8 | 12.4 | 9.7 | ||||||||||
| 60 | Urban | 32.6 | 1 | 0.3 | 7.3 | 16.3 | 101 | 35.3 | ||||||||||||
| Querol et al. (2008) | 1999-05 | Bemantes | Rural | 9 | 0.4 | 0.2 | 3 | 1 | 8 | 5 | ||||||||||
| 108 | LLodio | Urban-Ind | 103 | 0.8 | 1.2 | 33 | 25 | 33 | 87 | |||||||||||
The mean concentrations of trace elements in the PM2.5 fraction in the study area greatly exceeded those present in European cities: Pb (34.2–154.5ng/m3 vs. 2.3–11.2ng/m3), Cr (4.1–19ng/m3 vs. 0.35–1.65ng/m3), Cu (8.2–45.5ng/m3 vs. 1.6–2.5ng/m3), Mn (18.9–89.8 60ng/m3 vs. 2.5–6.4ng/m3) and Fe (210–720ng/m3 vs. 60–259ng/m3), Ni (2.3–7.1ng/m3 vs. 0.8–4.6ng/m3) and Cd (0.3–0.8ng/m3 vs. 0.1–0.4ng/m3). In contrast, the results for trace elements associated to PM10 obtained in another Basque town, Llodio, with similar demographical, environmental and industrial characteristics to the towns in our study area, display similar levels16, except for Ni, which is higher.
The percentage composition of each of the trace elements in the PM2.5 and PM10 fractions is similar to that found by other authors13. The percentages of Fe, Cr and Ni were higher in PM10, whilst the percentage of Pb was greater in the PM2.5 fraction.
The high degrees of correlation obtained between the PM2.5 values from the high-volume samplers installed specifically for this study and the Network’s PM10 and/or PM2.5 values, indicate that the data gathered by both methods–gravimetric analysis and β-radiation attenuation method–are comparable in our area of investigation.
In general, the levels of particles found in the study area–a group of small towns with high levels of industrial activity–are similar to or higher than those of European cities while levels of analyzed trace elements are higher than those registered at other non-industrialized European cities. This has implications for the evaluation of health risks in environments that might be considered, in principle, as less polluted.
We would like to thank the Autonomous Community of the Basque Country’s Air Quality Network for having provided the data for the towns of Beasain and Azpeitia, as well as part of the equipment used for sampling particles, and especially Marivi Albizu and Unai Zeberio.


