


To determine the role of social health insurance programs in reducing inequality in the incidence and intensity of catastrophic health expenditure (CHE) of cancer patients in China.
MethodA convenient sample of 2534 cancer patients treated in nine hospitals in 2015 and 2016 were followed up through face-to-face interviews in March-December 2018. The incidence and intensity (mean positive overshoot) of CHE (≥ 40% household consumption) were calculated.
ResultsAbout 72% of cancer patients experienced CHE events after insurance compensation, with the catastrophic mean positive overshoot amounting to 28.27% (SD: 15.83%) of the household consumption. Overall, social insurance contributed to a small percentage of drop in CHE events. Income-related inequality in CHE persisted before and after insurance compensation. Richer patients benefit more than poorer ones.
ConclusionsCancer treatment is associated with high incidence of CHE events in China. The alleviating effect of social health insurance on CHE events is limited.
Determinar la función de programas del seguro social de salud en reducir las desigualdades en incidencia e intensidad del gasto catastrófico en salud (GCS) en pacientes con cáncer en China.
MétodoSe realizó seguimiento de una muestra de conveniencia de 2534 pacientes con cáncer atendidos en nueve hospitales en 2015 y 2016, mediante entrevistas cara a cara de marzo a diciembre de 2018. Se calcularon la incidencia y la intensidad (reacción positiva promedio) de GCS (≥40% consumo del hogar).
ResultadosAlrededor del 72% de los pacientes con cáncer experimentaron eventos de GCS después de la compensación del seguro; reacción positiva promedio acumulado del 28.27% (DE: 15.83%) del consumo del hogar. En general, el seguro social contribuyó al descenso de un pequeño porcentaje de eventos de GCS. La desigualdad relacionada con ingresos de GCS persistió antes y después de la compensación del seguro. Los pacientes más ricos se benefician más que los pobres.
ConclusionesEl tratamiento para el cáncer está asociado con una mayor incidencia de eventos de GCS en China. El efecto mitigante del seguro social de salud es limitado en los eventos de GCS.
Cancer is one of the leading causes of death in the world.1 From 2012 to 2020, the number of new cases of cancer increased by 5.3 million while deaths from cancer increased by 1.8 million.2,3 Low- and middle-income countries are most affected by cancer.2 China has the largest burden of cancer, accounting for more than 23% of new cancer cases and about 30% of cancer deaths worldwide.4,5
Cancer treatment imposes a substantial financial burden on the patients.6 The longer the patients survive, the more likely their households would incur catastrophic health expenditure (CHE).7 In China and Southeast Asia, almost half (48%) of cancer patients experienced CHE events.8,9 Towards the end of life, almost all cancer patients have experienced CHE in China.10
Health insurance has the potential of preventing CHE through subsidizing incurred medical expenditure.11 However, the functions of health insurance programs often vary by cultural contexts, modes of execution, and social institutions in which those programs are embedded.12 If it is not designed and managed properly, consumers can be lured into the trap of CHE if out-of-pocket payments (OOP) are required to contain total health expenditure.13 Existing studies into the role of social health insurance programs in China have generated inconsistent conclusions. Some studies argue that patients with health insurance tend to spend more, increasing the likelihood of CHE; whereas, others argue that patients are likely to receive the same services with lowered OOP expenditure.14–16 Great regional disparities have persisted in China despite the great efforts made by the central government for universal coverage (>95%) of social health insurance.17 The social health insurance system of China is characterized by three major schemes with numerous funds managed by local governments: the basic medical insurance for urban employees (BMIUE) launched in 1998, whose premiums are raised based on a percentage of monthly income and the minimum funding required by the policy is 8%; the rural new cooperative medical scheme (RNCMS) for rural residents launched in 2003; and the basic medical insurance for urban residents (BMIUR) such as students, unemployed, and self-employed launched in 2007, both of which are funded by a annual per capita, different standards could be set in different regions according to different economic levels and can grow year by year.14
Empirical evidence shows that the OOP payments as a proportion of total health expenditure has declined significantly as a result of the expansion of social health insurance in China.18 However, total health expenditure escalated rapidly, increasing from 1.8 trillion in 2009 to 7.2 trillion yuan in 2020,19 which seriously jeopardized the role of social health insurance in alleviating the OOP burden of the patients. Inequalities within and across different insurance schemes and funds are also profound,20 with variations in entitlements depending on the financial capacity of local funds. BMIUE tends to have higher financial capacity than the other two schemes despite local governmental subsidies. Overall, social health insurance slowed down the increase of CHE incidence, but to a less extent in the RNCMS enrollees.21 The Chinese government has introduced multiple strategies to address the inequality concerns. These include supplementary insurance for catastrophic diseases and medical assistance for the households living in poverty. Recently, merge of the RNCMS and the BMIUR programs started.22 The overall effect of these policy initiatives remains unknown.
This study aimed to address the gap in the literature by estimating the effect of social health insurance programs on CHE events experienced by cancer patients. CHE is a highly sensitive indicator for measuring financial burden of consumers, as well as the risk protection effect of health insurance.23
MethodStudy settingThis study adopted a cross-sectional survey design as part of the Cancer Screening Program in Urban China.24 Seven provinces were purposely selected considering a balance of economic development across regions. One or two tertiary hospitals that treated cancer patients from each province were conveniently identified: one from the eastern developed region (Hospital A), three from the central developing region (Hospital B, C, D), and five from the western underdeveloped region (Hospital E, F, G, H, I).
Study participantsThe patients diagnosed with cancer and paid for cancer treatment were eligible for this study. Those with multiple primary malignancies were excluded.
Previous studies showed that about 43% households with a cancer patient experienced CHE events in the first year for diagnosis and treatment.9 A sample size of 2451 would allow an estimation of the CHE incidence with 2% precision.25 In this study, we extracted a minimal of 720 medical records and followed up at least 360 of the patients from each participating province.
Data collectionWe estimated annual costs associated with cancer treatment: from 2 months before diagnosis to 10 months after diagnosis. Data collection started in March 2018. Eligible patients were those diagnosed before April 2017. The sampling period was extended backward to 1 January 2015 and the required sample size was secured by the end of 2016.
The cancer patients were asked about their willingness to participate in this study when they were discharged from the participating hospitals. Data regarding patient name, age, gender, marital status, occupation, place of residence, health insurance coverage, and site of cancer were extracted from the medical records of those who were willing to participate (n=4874).
A follow-up questionnaire survey was then conducted. Data regarding household income, consumption, and cancer treatments were collected through face-to-face interviews at the households of the patients from March to December 2018 by trained investigators.
Participation in the survey was voluntary. Respondents were either the primary caregivers or the patients themselves. Written informed consent was obtained prior to the commencement of the survey.
In total, 2565 out of the 4874 recorded patients were randomly followed up. After exclusion of those containing missing data, 2534 responses were retained for data analyses: 360 in Heilongjiang, 368 in Anhui, 356 in Guangxi, 360 in Shanxi, 360 in Yunnan, 370 in Guangdong, 360 in Inno Mongolia. Over half (53%) were completed by the patients.
MeasurementsThe survey gathered data regarding household income, daily consumption, and expenses for cancer diagnosis and treatment. Income included wage, dividends and interests, return on capital investments, governmental subsidies, and monetary gifts. Consumption covered the spendings on clothing, foods, transportation, daily necessities, communication, education, housing (mortgage or rent and utilities such as water, electricity and gas), insurance, medical care, and cultural and entertainment activities. Spendings associated with leisure traveling, capital investment, and other profit generating investment activities were excluded.
Respondents were asked to report how much they spent on cancer diagnosis and treatment over a one-year period and whether they completed all required treatments. The one-year period started with two months prior to cancer diagnosis in order to capture the costs associated with diagnostic testing and examinations. Expenses in subsequent treatments ten months after the cancer diagnosis were estimated, including those incurred in the hospitals and in the community clinics and pharmacies.
Incomplete treatment included premature exit from the hospital or abandoning of subsequent treatments as prescribed. Respondents were asked to identify a single major cause of the incomplete treatment from a pre-defined list.
All respondents were asked to rate their financial pressure in seeking cancer treatment on a five-point Likert scale, ranging from “not matter at all” to “unaffordable”.
Data analysisTwo indicators were calculated to measure CHE events:
- 1)
CHE incidence: based on the studies, we defined CHE as proportion of households that spent 40% or more of daily consumption on cancer diagnosis and treatment [9-10, 23]. This indicator measures the breadth of CHE events.9,10
Ppre represents the percentage of household daily consumption used for cancer diagnosis and treatment before insurance compensation (Equation 1). Epre is the household spending on cancer diagnosis and treatment before insurance compensation. Cpre is the household daily consumption before insurance compensation. Ipre is the CHE incidence before insurance compensation (Equation 2). N is the number of participating households.
Ppost represents the percentage of household daily consumption used for cancer diagnosis and treatment after insurance compensation (Equation 3). Epost is the household spending on cancer diagnosis and treatment after insurance compensation. Cpost is the household daily consumption after insurance compensation. Ipost is the CHE incidence after insurance compensation (Equation 4).
O is the difference of CHE incidence before and after insurance compensation (Equation 5).
- 2)
CHE intensity: accrued expenses of cancer diagnosis and treatment above the 40% CHE threshold as a percentage of daily consumption in the households with CHE. This indicator measures the depth of CHE. The mean value of this indicator in the households with CHE is called catastrophic mean positive overshoot.9
Gpre represents the mean positive overshoot before insurance compensation (Equation 6), while Gpost represents the mean positive overshoot after insurance compensation (Equation 7). N is the number of participating households with CHE. R is the difference of the CHE mean positive overshoot before and after insurance compensation (Equation 8).

The marginal contribution of health insurance in alleviating CHE was calculated as the differences in the above two indicators pre- and post-insurance compensation. Chi-square test and t-test were respectively used for statistical testing on differences of incidence and intensity.
Inequalities in cancer-related CHE were assessed by comparing the CHE incidence and intensity indicators across the households with different income. Because there was not a clear monthly timeline attached to the income and consumption data, we used the average household income and daily consumption across the year of 2015 and 2016.
Multivariate logistic regression models were established to test the income-related inequality of and the role of social health insurance programs in alleviating the CHE incidence after adjustment for variations in other variables. The control variables were selected in line with the existing studies,8 including age, education, occupation, residential region, and site of cancer.
Data were double-entered into EpiData 3.1 to ensure accuracy of data input and analyzed using Excel 2010 and IBM SPSS Statistics v22.
Ethics approvalThe study protocol was approved by the Institutional Review Board of the Cancer Hospital of Chinese Academy of Medical Sciences (Approval No. 15-071/998).
ResultsMost of the cancer patients were older than 50 years (73.76%) and did not attend tertiary education (78.97%); 47.75% were BMIUE enrollees. Lung, breast, colorectum, esophageal, liver, and stomach cancers accounted for 70% of the total cancer cases.
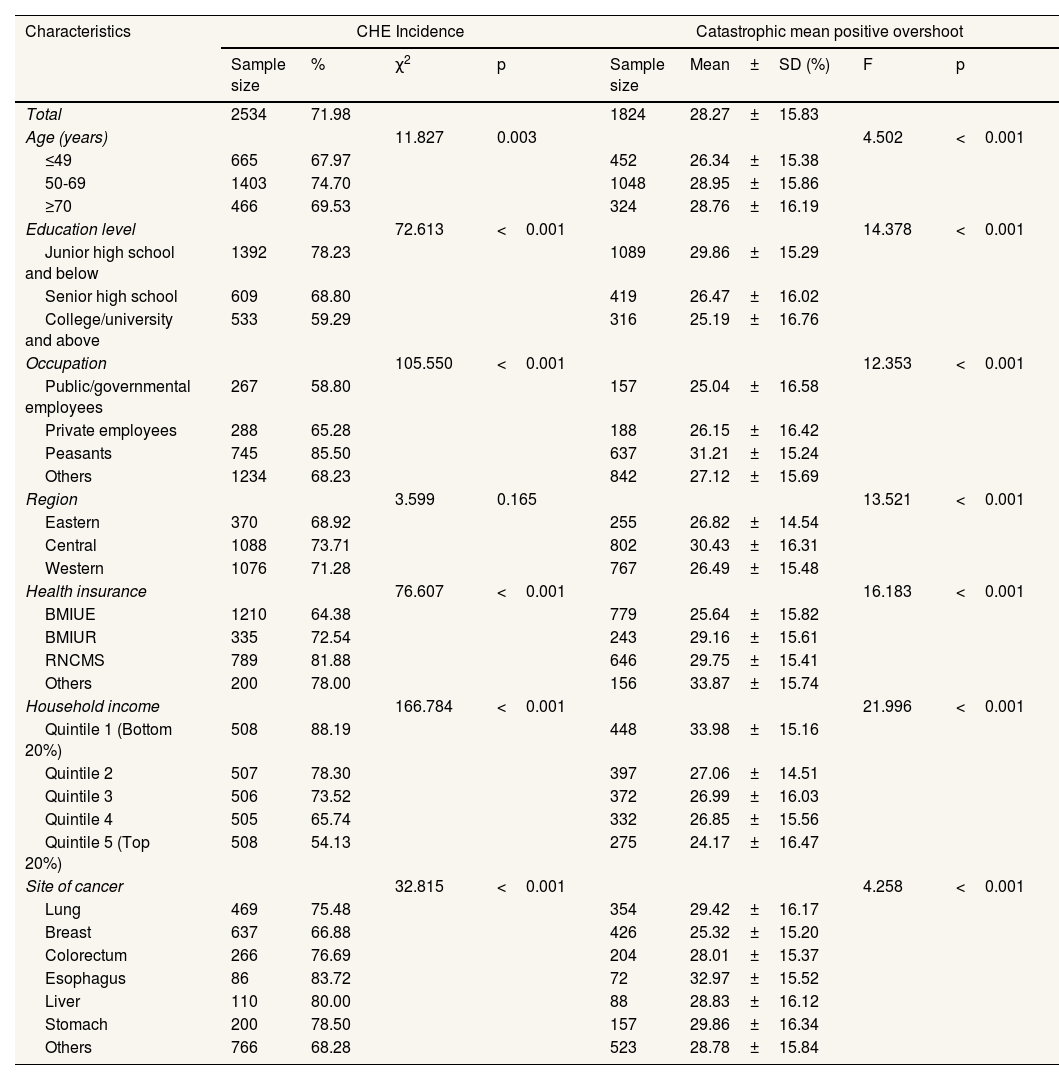
About 72% of the households experienced CHE. The cancer patients who were aged between 50 and 69 years (74.7%; p<0.003), received lower levels of education (p <0.001), worked as a peasant (85.5%; p<0.001), and enrolled with the RNCMS (81.9%; p<0.001) were more likely to have CHE. CHE incidence decreased with income: 88.2% in the households with the lowest quintile of income, compared with 54.1% in those with the highest quintile of income (p<0.001). The patients with esophagus cancer had the highest incidence (83.7%, p<0.001) of CHE (Table 1).
Incidence and intensity of catastrophic health expenditure in cancer treatment.
| Characteristics | CHE Incidence | Catastrophic mean positive overshoot | ||||||
|---|---|---|---|---|---|---|---|---|
| Sample size | % | χ2 | p | Sample size | Mean±SD (%) | F | p | |
| Total | 2534 | 71.98 | 1824 | 28.27±15.83 | ||||
| Age (years) | 11.827 | 0.003 | 4.502 | <0.001 | ||||
| ≤49 | 665 | 67.97 | 452 | 26.34±15.38 | ||||
| 50-69 | 1403 | 74.70 | 1048 | 28.95±15.86 | ||||
| ≥70 | 466 | 69.53 | 324 | 28.76±16.19 | ||||
| Education level | 72.613 | <0.001 | 14.378 | <0.001 | ||||
| Junior high school and below | 1392 | 78.23 | 1089 | 29.86±15.29 | ||||
| Senior high school | 609 | 68.80 | 419 | 26.47±16.02 | ||||
| College/university and above | 533 | 59.29 | 316 | 25.19±16.76 | ||||
| Occupation | 105.550 | <0.001 | 12.353 | <0.001 | ||||
| Public/governmental employees | 267 | 58.80 | 157 | 25.04±16.58 | ||||
| Private employees | 288 | 65.28 | 188 | 26.15±16.42 | ||||
| Peasants | 745 | 85.50 | 637 | 31.21±15.24 | ||||
| Others | 1234 | 68.23 | 842 | 27.12±15.69 | ||||
| Region | 3.599 | 0.165 | 13.521 | <0.001 | ||||
| Eastern | 370 | 68.92 | 255 | 26.82±14.54 | ||||
| Central | 1088 | 73.71 | 802 | 30.43±16.31 | ||||
| Western | 1076 | 71.28 | 767 | 26.49±15.48 | ||||
| Health insurance | 76.607 | <0.001 | 16.183 | <0.001 | ||||
| BMIUE | 1210 | 64.38 | 779 | 25.64±15.82 | ||||
| BMIUR | 335 | 72.54 | 243 | 29.16±15.61 | ||||
| RNCMS | 789 | 81.88 | 646 | 29.75±15.41 | ||||
| Others | 200 | 78.00 | 156 | 33.87±15.74 | ||||
| Household income | 166.784 | <0.001 | 21.996 | <0.001 | ||||
| Quintile 1 (Bottom 20%) | 508 | 88.19 | 448 | 33.98±15.16 | ||||
| Quintile 2 | 507 | 78.30 | 397 | 27.06±14.51 | ||||
| Quintile 3 | 506 | 73.52 | 372 | 26.99±16.03 | ||||
| Quintile 4 | 505 | 65.74 | 332 | 26.85±15.56 | ||||
| Quintile 5 (Top 20%) | 508 | 54.13 | 275 | 24.17±16.47 | ||||
| Site of cancer | 32.815 | <0.001 | 4.258 | <0.001 | ||||
| Lung | 469 | 75.48 | 354 | 29.42±16.17 | ||||
| Breast | 637 | 66.88 | 426 | 25.32±15.20 | ||||
| Colorectum | 266 | 76.69 | 204 | 28.01±15.37 | ||||
| Esophagus | 86 | 83.72 | 72 | 32.97±15.52 | ||||
| Liver | 110 | 80.00 | 88 | 28.83±16.12 | ||||
| Stomach | 200 | 78.50 | 157 | 29.86±16.34 | ||||
| Others | 766 | 68.28 | 523 | 28.78±15.84 | ||||
CHE: catastrophic health expenditure; BMIUE: Basic Medical Insurance for Urban Employees; BMIUR: Basic Medical Insurance for Urban Residents; F: ANOVA tests; RNCMS: Rural New Cooperative Medical Scheme; SD: standard deviation.
On average, each household with CHE (n=1824) accrued a mean positive overshoot equivalent to 28.3% daily household consumption. The same risk factors were identified for catastrophic mean positive overshoot as those for CHE incidence. Higher mean positive overshoot was also found in the central developing region compared to others (Table 1).
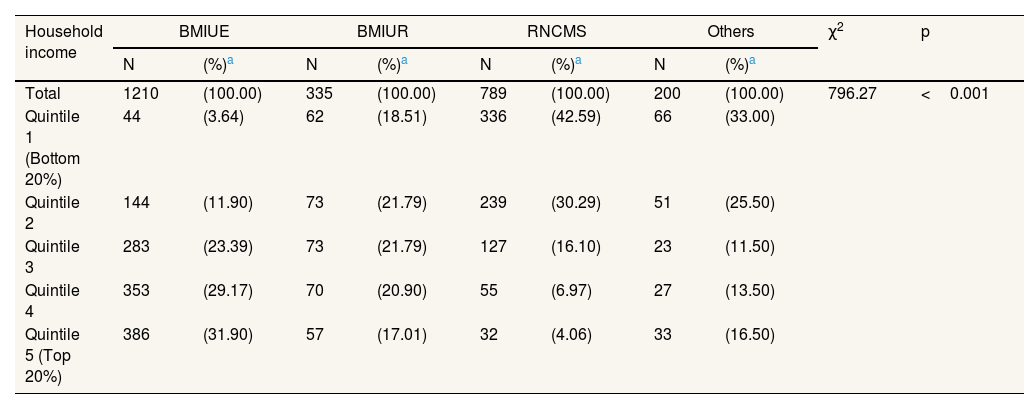
The BMIUE enrollees were more likely to have the highest quintile of income. By contrast, the RNCMS enrollees were more likely to have the lowest quintile of income (p<0.001) (Table 2).
Correlation between household income and health insurance enrolments.
| Household income | BMIUE | BMIUR | RNCMS | Others | χ2 | p | ||||
|---|---|---|---|---|---|---|---|---|---|---|
| N | (%)a | N | (%)a | N | (%)a | N | (%)a | |||
| Total | 1210 | (100.00) | 335 | (100.00) | 789 | (100.00) | 200 | (100.00) | 796.27 | <0.001 |
| Quintile 1 (Bottom 20%) | 44 | (3.64) | 62 | (18.51) | 336 | (42.59) | 66 | (33.00) | ||
| Quintile 2 | 144 | (11.90) | 73 | (21.79) | 239 | (30.29) | 51 | (25.50) | ||
| Quintile 3 | 283 | (23.39) | 73 | (21.79) | 127 | (16.10) | 23 | (11.50) | ||
| Quintile 4 | 353 | (29.17) | 70 | (20.90) | 55 | (6.97) | 27 | (13.50) | ||
| Quintile 5 (Top 20%) | 386 | (31.90) | 57 | (17.01) | 32 | (4.06) | 33 | (16.50) | ||
BMIUE: Basic Medical Insurance for Urban Employees; BMIUR: Basic Medical Insurance for Urban Residents; RNCMS: Rural New Cooperative Medical Scheme; SD: standard deviation.
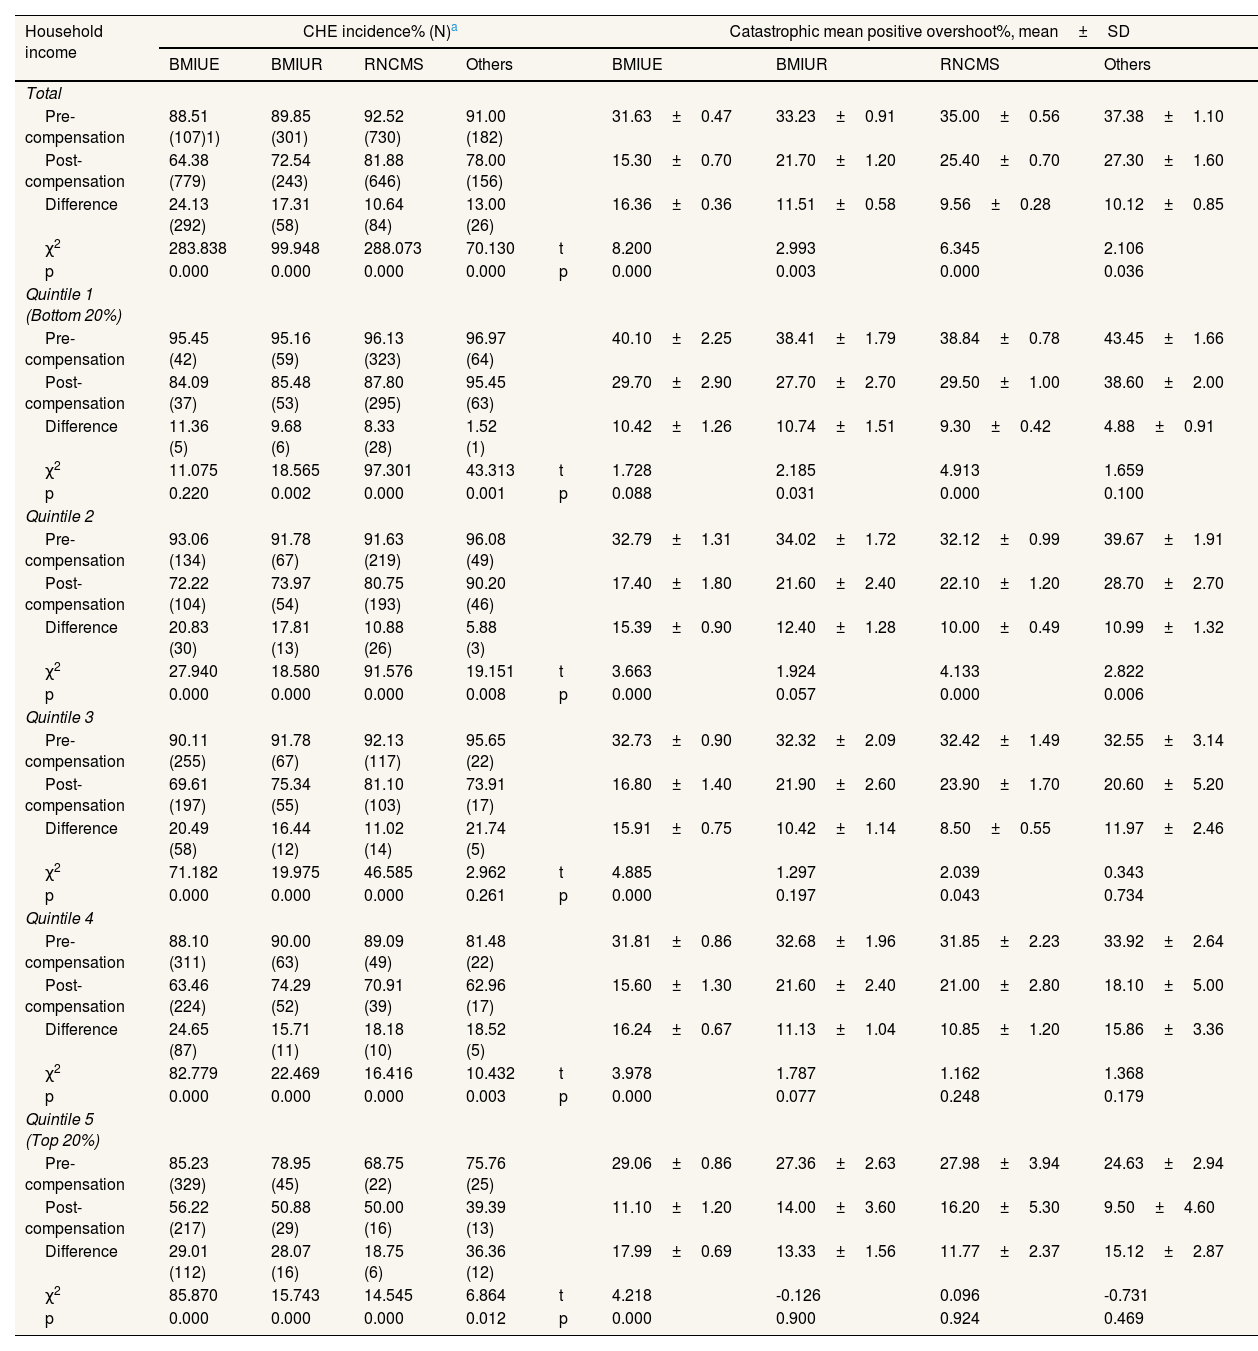
The marginal contribution of health insurance in alleviating CHE varied by household income and across insurance schemes. Those with higher income benefited more from insurance, with the top income group experiencing a 18.75-29.01% drop in CHE incidence, more than doubled that (8.33-11.36%) of the bottom income group, also the same general trend in CHE intensity. Higher pre-post compensation differences in CHE incidence and intensity were found in the BMIUE enrollees, respectively 24.13% and 16.36%, compared with their RNCMS counterparts with 10.64% and 9.56% (Table 3).
Incidence and intensity of catastrophic health expenditure before and after insurance compensation.
| Household income | CHE incidence% (N)a | Catastrophic mean positive overshoot%, mean±SD | |||||||
|---|---|---|---|---|---|---|---|---|---|
| BMIUE | BMIUR | RNCMS | Others | BMIUE | BMIUR | RNCMS | Others | ||
| Total | |||||||||
| Pre-compensation | 88.51 (107)1) | 89.85 (301) | 92.52 (730) | 91.00 (182) | 31.63±0.47 | 33.23±0.91 | 35.00±0.56 | 37.38±1.10 | |
| Post-compensation | 64.38 (779) | 72.54 (243) | 81.88 (646) | 78.00 (156) | 15.30±0.70 | 21.70±1.20 | 25.40±0.70 | 27.30±1.60 | |
| Difference | 24.13 (292) | 17.31 (58) | 10.64 (84) | 13.00 (26) | 16.36±0.36 | 11.51±0.58 | 9.56±0.28 | 10.12±0.85 | |
| χ2 | 283.838 | 99.948 | 288.073 | 70.130 | t | 8.200 | 2.993 | 6.345 | 2.106 |
| p | 0.000 | 0.000 | 0.000 | 0.000 | p | 0.000 | 0.003 | 0.000 | 0.036 |
| Quintile 1 (Bottom 20%) | |||||||||
| Pre-compensation | 95.45 (42) | 95.16 (59) | 96.13 (323) | 96.97 (64) | 40.10±2.25 | 38.41±1.79 | 38.84±0.78 | 43.45±1.66 | |
| Post-compensation | 84.09 (37) | 85.48 (53) | 87.80 (295) | 95.45 (63) | 29.70±2.90 | 27.70±2.70 | 29.50±1.00 | 38.60±2.00 | |
| Difference | 11.36 (5) | 9.68 (6) | 8.33 (28) | 1.52 (1) | 10.42±1.26 | 10.74±1.51 | 9.30±0.42 | 4.88±0.91 | |
| χ2 | 11.075 | 18.565 | 97.301 | 43.313 | t | 1.728 | 2.185 | 4.913 | 1.659 |
| p | 0.220 | 0.002 | 0.000 | 0.001 | p | 0.088 | 0.031 | 0.000 | 0.100 |
| Quintile 2 | |||||||||
| Pre-compensation | 93.06 (134) | 91.78 (67) | 91.63 (219) | 96.08 (49) | 32.79±1.31 | 34.02±1.72 | 32.12±0.99 | 39.67±1.91 | |
| Post-compensation | 72.22 (104) | 73.97 (54) | 80.75 (193) | 90.20 (46) | 17.40±1.80 | 21.60±2.40 | 22.10±1.20 | 28.70±2.70 | |
| Difference | 20.83 (30) | 17.81 (13) | 10.88 (26) | 5.88 (3) | 15.39±0.90 | 12.40±1.28 | 10.00±0.49 | 10.99±1.32 | |
| χ2 | 27.940 | 18.580 | 91.576 | 19.151 | t | 3.663 | 1.924 | 4.133 | 2.822 |
| p | 0.000 | 0.000 | 0.000 | 0.008 | p | 0.000 | 0.057 | 0.000 | 0.006 |
| Quintile 3 | |||||||||
| Pre-compensation | 90.11 (255) | 91.78 (67) | 92.13 (117) | 95.65 (22) | 32.73±0.90 | 32.32±2.09 | 32.42±1.49 | 32.55±3.14 | |
| Post-compensation | 69.61 (197) | 75.34 (55) | 81.10 (103) | 73.91 (17) | 16.80±1.40 | 21.90±2.60 | 23.90±1.70 | 20.60±5.20 | |
| Difference | 20.49 (58) | 16.44 (12) | 11.02 (14) | 21.74 (5) | 15.91±0.75 | 10.42±1.14 | 8.50±0.55 | 11.97±2.46 | |
| χ2 | 71.182 | 19.975 | 46.585 | 2.962 | t | 4.885 | 1.297 | 2.039 | 0.343 |
| p | 0.000 | 0.000 | 0.000 | 0.261 | p | 0.000 | 0.197 | 0.043 | 0.734 |
| Quintile 4 | |||||||||
| Pre-compensation | 88.10 (311) | 90.00 (63) | 89.09 (49) | 81.48 (22) | 31.81±0.86 | 32.68±1.96 | 31.85±2.23 | 33.92±2.64 | |
| Post-compensation | 63.46 (224) | 74.29 (52) | 70.91 (39) | 62.96 (17) | 15.60±1.30 | 21.60±2.40 | 21.00±2.80 | 18.10±5.00 | |
| Difference | 24.65 (87) | 15.71 (11) | 18.18 (10) | 18.52 (5) | 16.24±0.67 | 11.13±1.04 | 10.85±1.20 | 15.86±3.36 | |
| χ2 | 82.779 | 22.469 | 16.416 | 10.432 | t | 3.978 | 1.787 | 1.162 | 1.368 |
| p | 0.000 | 0.000 | 0.000 | 0.003 | p | 0.000 | 0.077 | 0.248 | 0.179 |
| Quintile 5 (Top 20%) | |||||||||
| Pre-compensation | 85.23 (329) | 78.95 (45) | 68.75 (22) | 75.76 (25) | 29.06±0.86 | 27.36±2.63 | 27.98±3.94 | 24.63±2.94 | |
| Post-compensation | 56.22 (217) | 50.88 (29) | 50.00 (16) | 39.39 (13) | 11.10±1.20 | 14.00±3.60 | 16.20±5.30 | 9.50±4.60 | |
| Difference | 29.01 (112) | 28.07 (16) | 18.75 (6) | 36.36 (12) | 17.99±0.69 | 13.33±1.56 | 11.77±2.37 | 15.12±2.87 | |
| χ2 | 85.870 | 15.743 | 14.545 | 6.864 | t | 4.218 | -0.126 | 0.096 | -0.731 |
| p | 0.000 | 0.000 | 0.000 | 0.012 | p | 0.000 | 0.900 | 0.924 | 0.469 |
CHE: catastrophic health expenditure; BMIUE: Basic Medical Insurance for Urban Employees; BMIUR: Basic Medical Insurance for Urban Residents; RNCMS: Rural New Cooperative Medical Scheme; SD: standard deviation.
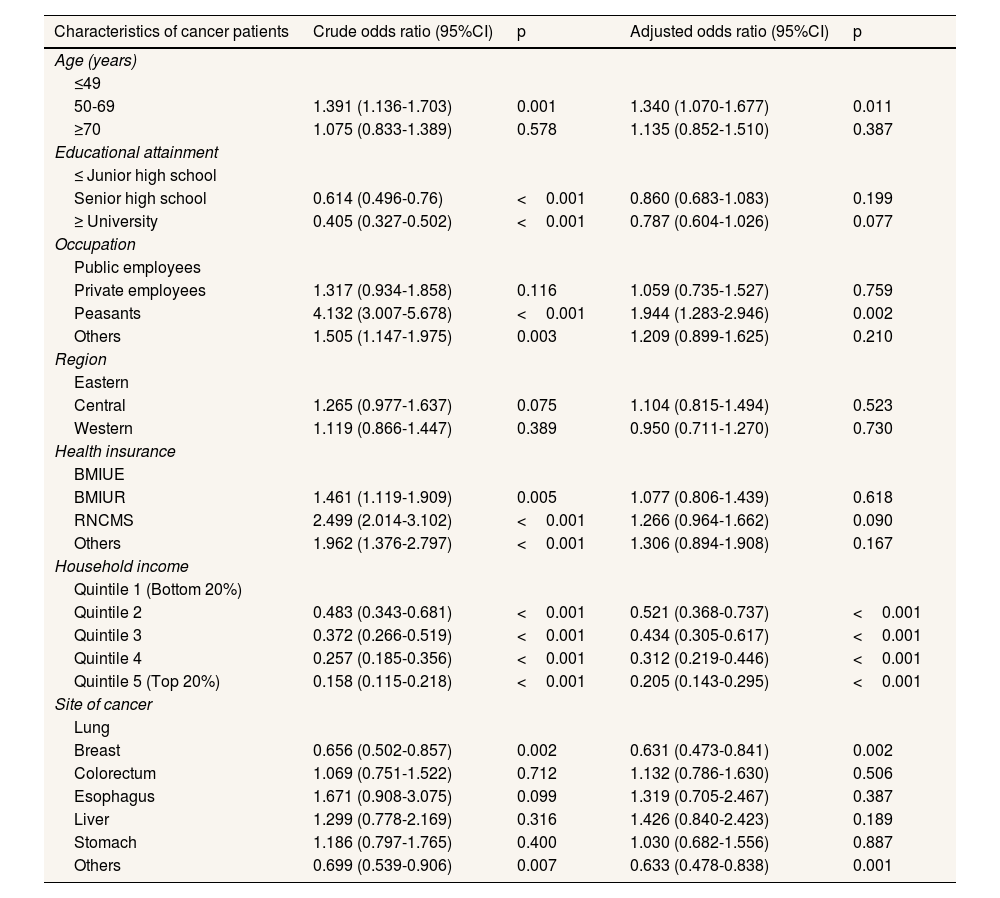
The logistic regression model confirmed that patient age, occupation, household income and site of cancer were significant predictors of CHE incidence. Those aged between 50 and 69 years had higher odds (AOR=1.340; p=0.011) of CHE than their younger counterparts. Peasants had higher odds (AOR=1.944; p=0.002) of CHE than those working in the public sector. Higher household income was associated with lower odds of CHE (p<0.001). Patients with breast cancer had lower odds (AOR=0.631; p=0.002) of CHE than those with lung cancer. The differences in CHE incidence across different insurance programs became statistically insignificant after adjustment for variations in other variables (Table 4). No significant multicollinearity was identified in the multivariate modelling (see Supplementary Table S1 in online Appendix).
Predictors of catastrophic health expenditure incidence. Results of logistic regression models.
| Characteristics of cancer patients | Crude odds ratio (95%CI) | p | Adjusted odds ratio (95%CI) | p |
|---|---|---|---|---|
| Age (years) | ||||
| ≤49 | ||||
| 50-69 | 1.391 (1.136-1.703) | 0.001 | 1.340 (1.070-1.677) | 0.011 |
| ≥70 | 1.075 (0.833-1.389) | 0.578 | 1.135 (0.852-1.510) | 0.387 |
| Educational attainment | ||||
| ≤ Junior high school | ||||
| Senior high school | 0.614 (0.496-0.76) | <0.001 | 0.860 (0.683-1.083) | 0.199 |
| ≥ University | 0.405 (0.327-0.502) | <0.001 | 0.787 (0.604-1.026) | 0.077 |
| Occupation | ||||
| Public employees | ||||
| Private employees | 1.317 (0.934-1.858) | 0.116 | 1.059 (0.735-1.527) | 0.759 |
| Peasants | 4.132 (3.007-5.678) | <0.001 | 1.944 (1.283-2.946) | 0.002 |
| Others | 1.505 (1.147-1.975) | 0.003 | 1.209 (0.899-1.625) | 0.210 |
| Region | ||||
| Eastern | ||||
| Central | 1.265 (0.977-1.637) | 0.075 | 1.104 (0.815-1.494) | 0.523 |
| Western | 1.119 (0.866-1.447) | 0.389 | 0.950 (0.711-1.270) | 0.730 |
| Health insurance | ||||
| BMIUE | ||||
| BMIUR | 1.461 (1.119-1.909) | 0.005 | 1.077 (0.806-1.439) | 0.618 |
| RNCMS | 2.499 (2.014-3.102) | <0.001 | 1.266 (0.964-1.662) | 0.090 |
| Others | 1.962 (1.376-2.797) | <0.001 | 1.306 (0.894-1.908) | 0.167 |
| Household income | ||||
| Quintile 1 (Bottom 20%) | ||||
| Quintile 2 | 0.483 (0.343-0.681) | <0.001 | 0.521 (0.368-0.737) | <0.001 |
| Quintile 3 | 0.372 (0.266-0.519) | <0.001 | 0.434 (0.305-0.617) | <0.001 |
| Quintile 4 | 0.257 (0.185-0.356) | <0.001 | 0.312 (0.219-0.446) | <0.001 |
| Quintile 5 (Top 20%) | 0.158 (0.115-0.218) | <0.001 | 0.205 (0.143-0.295) | <0.001 |
| Site of cancer | ||||
| Lung | ||||
| Breast | 0.656 (0.502-0.857) | 0.002 | 0.631 (0.473-0.841) | 0.002 |
| Colorectum | 1.069 (0.751-1.522) | 0.712 | 1.132 (0.786-1.630) | 0.506 |
| Esophagus | 1.671 (0.908-3.075) | 0.099 | 1.319 (0.705-2.467) | 0.387 |
| Liver | 1.299 (0.778-2.169) | 0.316 | 1.426 (0.840-2.423) | 0.189 |
| Stomach | 1.186 (0.797-1.765) | 0.400 | 1.030 (0.682-1.556) | 0.887 |
| Others | 0.699 (0.539-0.906) | 0.007 | 0.633 (0.478-0.838) | 0.001 |
BMIUE: Basic Medical Insurance for Urban Employees; BMIUR: Basic Medical Insurance for Urban Residents; 95%CI: 95% confidence interval; RNCMS: Rural New Cooperative Medical Scheme.
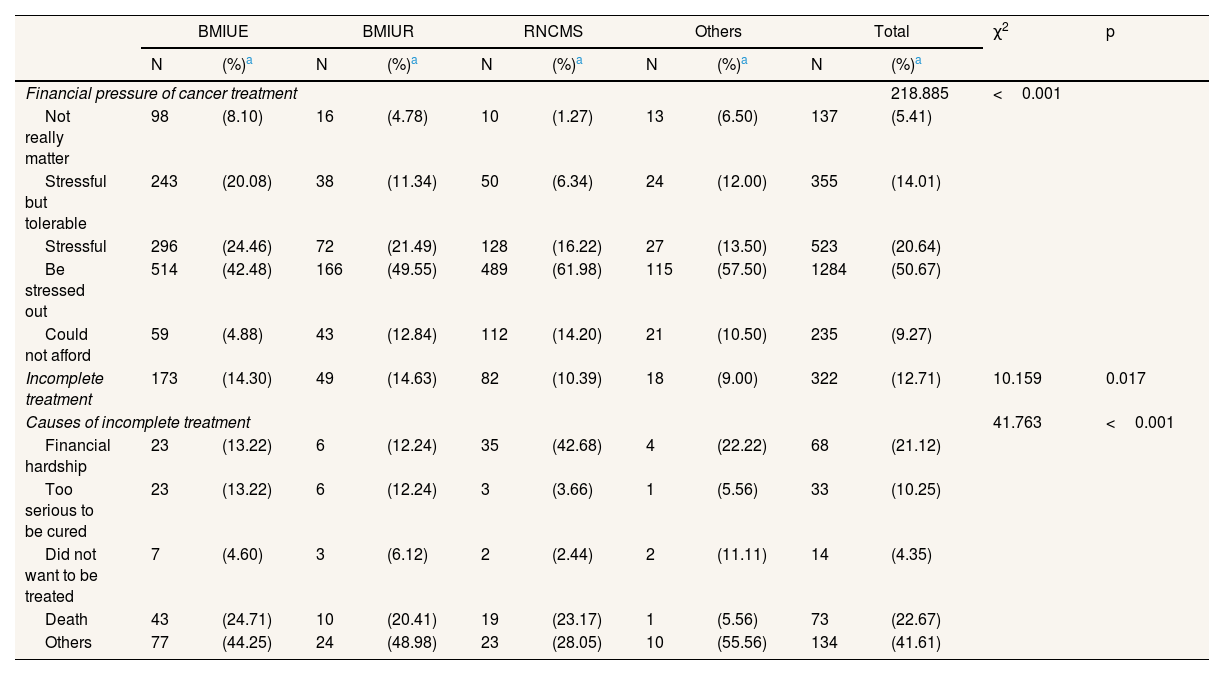
About 12.7% (n=322) respondents reported incomplete cancer treatment. Although the RNCMS enrollees were less likely to experience incomplete treatment than their BMIUE counterparts, 42.7% RNCMS enrollees identified financial hardship as a major reason compared with 13.2% in the BMIUE enrollees (p<0.001). Higher levels of financial hardship in the RNCMS enrollees was further confirmed by self-rating: 61.98% RNCMS enrollees felt financial burden of cancer treatment “stressful” and 14.2% “unaffordable”, compared with 49.55% and 12.84%, respectively, in the BMIUR enrollees, and 42.48% and 4.88%, respectively, in the BMIUE enrollees (p<0.001) (Table 5).
Financial pressure and incomplete cancer treatment.
| BMIUE | BMIUR | RNCMS | Others | Total | χ2 | p | ||||||
|---|---|---|---|---|---|---|---|---|---|---|---|---|
| N | (%)a | N | (%)a | N | (%)a | N | (%)a | N | (%)a | |||
| Financial pressure of cancer treatment | 218.885 | <0.001 | ||||||||||
| Not really matter | 98 | (8.10) | 16 | (4.78) | 10 | (1.27) | 13 | (6.50) | 137 | (5.41) | ||
| Stressful but tolerable | 243 | (20.08) | 38 | (11.34) | 50 | (6.34) | 24 | (12.00) | 355 | (14.01) | ||
| Stressful | 296 | (24.46) | 72 | (21.49) | 128 | (16.22) | 27 | (13.50) | 523 | (20.64) | ||
| Be stressed out | 514 | (42.48) | 166 | (49.55) | 489 | (61.98) | 115 | (57.50) | 1284 | (50.67) | ||
| Could not afford | 59 | (4.88) | 43 | (12.84) | 112 | (14.20) | 21 | (10.50) | 235 | (9.27) | ||
| Incomplete treatment | 173 | (14.30) | 49 | (14.63) | 82 | (10.39) | 18 | (9.00) | 322 | (12.71) | 10.159 | 0.017 |
| Causes of incomplete treatment | 41.763 | <0.001 | ||||||||||
| Financial hardship | 23 | (13.22) | 6 | (12.24) | 35 | (42.68) | 4 | (22.22) | 68 | (21.12) | ||
| Too serious to be cured | 23 | (13.22) | 6 | (12.24) | 3 | (3.66) | 1 | (5.56) | 33 | (10.25) | ||
| Did not want to be treated | 7 | (4.60) | 3 | (6.12) | 2 | (2.44) | 2 | (11.11) | 14 | (4.35) | ||
| Death | 43 | (24.71) | 10 | (20.41) | 19 | (23.17) | 1 | (5.56) | 73 | (22.67) | ||
| Others | 77 | (44.25) | 24 | (48.98) | 23 | (28.05) | 10 | (55.56) | 134 | (41.61) | ||
BMIUE: Basic Medical Insurance for Urban Employees; BMIUR: Basic Medical Insurance for Urban Residents; 95%CI: 95% confidence interval; RNCMS: Rural New Cooperative Medical Scheme.
This study revealed high levels of CHE incidence in the households with cancer patients and a limited role of social health insurance in alleviating the CHE events in China. Over 71% cancer patients experienced CHE events, with 28.3% catastrophic mean positive overshoot. About 60% reported financial burden of cancer treatment as “stressful” or “unaffordable”. More than 12.7% did not complete their cancer treatments, with 21.1% reporting financial hardship as the major reason.
The CHE incidence revealed in this study is higher compared with the findings of other studies using the same threshold. In Vietnam, cancer treatment resulted in 64.7% of CHE between 2012 and 2014.26 The average CHE incidence of cancer treatment in the Association of Southeast Asian Nations countries was around 48% in 2012.8 A 2011 study in China's Liaoning province found 42.8% CHE incidence in cancer patients.9 The sample of this study were all patients diagnosed with cancer and paid for cancer treatment in tertiary hospitals with higher technology and higher cost, not general disease population or general population, which mainly explain the higher level of CHE incidence. In addition to expensive technologies, those hospitals can also charge more for the same interventions.
The CHE intensity associated with cancer treatment was found to be 28.3% as measured by mean positive overshoot, which also appears to be higher in comparison with other studies using the same threshold. The 2011 Liaoning study in China reported 24.3% catastrophic mean positive overshoot for cancer treatment in the households with CHE.9 In Bangladesh, the average catastrophic overshoot was reported to be as low as 1.9%.23
We alarmingly found that the households with higher income benefited more from insurance. The households in the top income group experienced the highest level (18.8-29.0%) of drop in CHE incidence, more than doubled that (8.3-11.4%) of those in the bottom income group, which is consistent with the results of other studies.23 This may be due to the fact that richer people could afford medical services and were willing to pay large medical bills compared to poorer people. Cost containment is critical for the sustainable development of health insurance. OOP requirements are often considered as one of the most effective measures to deter over-use of healthcare services and contain the rapid growth of health expenditure. Unfortunately, this can lead to serious financial pressure on the patients. In China, OOP as a proportion of total health expenditure dropped from 59.97% in 2001 to 28.36% in 2019.19,27 However, such a level of OOP is still deemed high using the benchmark of some low- and middle-income countries such as Cuba, Romania and Thailand, let alone in comparison with the high income countries.19
According to the World Health Organization, health insurance should promote equal access to health care and provide financial protection for the most vulnerable.28–30 However, differences of impact on CHE still existed among different types of health insurance, although it was found to be statistically significant. The RNCMS is the insurance category with the lowest compensation level for both richer and poorer individuals. In 2014, insurance reimbursement for hospital inpatient services only reached 56% for RNCMS enrollees, compared with 73% for BMIUE enrollees.31 This may be due to the relatively low level of funding. The available RNCMS funds equal less than 5% of the net income of rural residents. By contrast, the available BMIUE funds have reached at least 8% of the salary of urban employees.32,33 Since the RNCMS enrollees are more likely to live with lower income compared with their BMIUE counterparts, more favorable policies are needed to enhance the ability of the RNCMS in providing financial protections. With the integration of BMIUR and RNCMS as well as the continuously increasing of the financing and compensation ratio of medical insurance in recent years, the medical insurance will be more and more effective.17,34
There are several limitations in this study. Self-report data were used in this study, which may contain recall bias. The data collection strategy was designed for ensuring data consistency, but it may lead to challenges for the earlier diagnosed patients to recall data accurately (>2 years). However, patients usually have an accurate record about the cancer treatment expenses as they are a large expense (covering multiple providers in and outside of hospitals) that would usually need support/subsidize from others such as insurance funds and family members. The CHE events might be underestimated as we did not consider the source of income for household consumption. Some households experiencing financial difficulties might borrow money to pay for daily consumption. The nature of cross-sectional design prevented us from making causal conclusions. This study did not intend to draw a nationally representative sample. Instead, study participants were evenly distributed despite variations in population size across provinces for the purpose of estimating CHE incidence and intensity.
ConclusionsCancer treatment is associated with high incidence of CHE events in China. The households with lower income are more likely to suffer from CHE. The alleviating effect of social health insurance on CHE events is limited. The health insurance programs have failed to address income-related inequality problems in CHE resulting from cancer treatment. Given that supplementary insurance for catastrophic diseases and medical assistance programs have already been tried, China may need to consider some pro-poor insurance compensation policies, such as higher reimbursement rate for patients with lower income. Under a system that has yet to achieve universal health coverage, targeted interventions (such as those on the older people and rural residents) may be more effective and efficient for improving health equity. Further studies are also needed to better understand the underlying reasons of CHE inequality, including the role of the site of cancer.
The health insurance programs have failed to address the income-related inequality problem in catastrophic health expenditure CHE resulting from cancer treatment.
What does the study add to the literature?The households with a higher income benefited more from the insurance programs.
What are the implication of the results?Presenting evidence for governments to reduce the catastrophic impact of cancer on families and improve equity in health services.
David Cantarero.
Transparency declarationThe corresponding author on behalf of the other authors guarantee the accuracy, transparency and honesty of the data and information contained in the study, that no relevant information has been omitted and that all discrepancies between authors have been adequately resolved and described.
Authorship contributionsConceptualization and design: G. Liu, J. Shi, W. Fu, W. Chen and J. He. Data acquisition and analysis: W. Fu and C. Liu. Drafting of the manuscript: W. Fu and C. Liu. Overall supervision: G. Liu. All authors read and approved the final manuscript.
AcknowledgmentsThe authors appreciate support from the National Cancer Center of China, the seven participating provinces, the Health Economic Evaluation Working Group, and the Cancer Screening Program in Urban China. We thank all of the study participants.
FundingThis work was supported by National Key R&D Program of China grant number (2017YFC1308700, 2017YFC1308705), National Natural Science Foundation of China grant number (71603065,71673071), and the National Key Public Health Program of China (Cancer Screening Program in Urban China) (Grant number: N/A).
Conflicts of interestNone.


