


To compare the use of healthcare resources among the Gipuzkoa population with and without dementia.
MethodA retrospective, cross-sectional cost study was conducted on the entire population over 60 years of age registered with the Basque Health Service. We measured the use of health services (hospital and primary care) and health needs as a function of the presence of dementia and neuropsychiatric symptoms, adjusting for age, sex and comorbidity. Generalised linear models from the Tweedie family distribution were fitted, taking into account the asymmetric distribution of costs.
ResultsOf the 215,859 over-60-year-olds in Gipuzkoa registered, 7553 (3.5%) had dementia. The median (interquartile range) cost was €743 (241-1682) for the total population, broken down into €722 (241-1660) for individuals without dementia and €1090 (481-2140) for those with dementia. In the Tweedie models adjusted for need, the estimated costs were €496 for the group with only neuropsychiatric symptoms, compared to €358 for the group with both conditions.
ConclusionsWhen healthcare resource use is adjusted for need, people with dementia receive less care than those without. However, it is difficult to determine whether this is harmful, depriving people with dementia of necessary care (inverse care law), or beneficial, sparing them from unnecessary treatment (overuse).
.
Comparar el uso de los recursos sanitarios entre la población de Gipuzkoa con y sin demencia.
MétodoEstudio de costes retrospectivo y transversal en toda la población mayor de 60 años de Gipuzkoa para medir su uso de servicios sanitarios y sus necesidades de cuidados según la presencia de demencia y de síntomas neuropsiquiátricos, ajustado por edad, sexo y comorbilidad. Por la distribución asimétrica de los costes se usaron modelos lineales generalizados de la familia de distribución Tweedie.
ResultadosDe los 215.859 individuos mayores de 60 años de la población guipuzcoana, 7553 (3,5%) tenían demencia. El coste mediano (rango intercuartílico) fue de 743€ (241-1682) en el total de la población, desagregada en población sin demencia en 722€ (241-1660) y con demencia en 1090€ (481-2140). En los modelos Tweedie ajustados por necesidad, el grupo con solo síntomas neuropsiquiátricos presentó un estimador de 496€, frente a los 358€ del grupo con demencia y síntomas neuropsiquiátricos.
ConclusionesCuando el uso de los recursos se ajusta a las necesidades, las personas con demencia reciben menos atención sanitaria. Sin embargo, es difícil determinar si esto resulta perjudicial, ya que podría privarles de la atención necesaria (ley de cuidado inverso), o beneficioso, ya que les evitaría recibir tratamientos innecesarios (sobreuso).
Physical frailty, impaired mobility, dysphagia and higher rates of comorbidity mean people with dementia have more healthcare needs.1 But dementia is not only a neurocognitive disorder but also a condition that severely impacts autonomy, communication, physical health, and social participation, all of which contribute to reduced ability to report needs and enhanced vulnerability.1,2 People living with Alzheimer's disease and related dementias have been found to have less access to healthcare interventions than the general population.3,4 These findings must be analysed using two different approaches. Firstly, their social isolation due to cognitive and functional impairment, as well as the association of dementia with the female gender and a low socioeconomic status, hinders communication. This means that their significant needs may not have been reflected in the amount of healthcare they received,5,6 and being an example of the disproportionate care law, as defined by Cookson et al.,5 which occurs when people receive less care than others as a proportion of their need for care, calling it the disproportionate care law.5,7 Secondly, overuse of healthcare services, which are more likely to cause harm than good, is recognised as an increasing problem, particularly among the elderly with multiple chronic conditions.8 Older adults with dementia often suffer from medical overuse, particularly in the form of inappropriate medication prescriptions and aggressive end-of-life interventions.8 Even though people with dementia use social benefits more frequently, resulting in higher formal social costs,9 it is unclear whether their hospital and primary care resource use are also higher.8
To assess inequities associated with dementia, we need to measure the use of resources, as well as variables indicating a need for healthcare in people with dementia,5,7 such as neuropsychiatric symptoms, age, socioeconomic status, and somatic comorbidity. At the same time, inequity is evident among dementia patients with a low socioeconomic status, in that they are more likely to be prescribed antipsychotics.9,10
This study hypothesises that people with dementia are a vulnerable group at risk of receiving inappropriate healthcare.1,2 Therefore, we aimed to analyse the use of healthcare resources among people with dementia in the Gipuzkoa population based on the presence of neuropsychiatric symptoms, gender, socioeconomic status, and comorbidity.
MethodDesignA retrospective cross-sectional cost study was conducted on the entire population over the age of 60 (n=215,859) to measure people's use of health services and gather data to assess their care needs. In this study, costs were used as a surrogate measure of healthcare resource utilisation in order to take into account all healthcare services.
Study population and variablesThe first stage involved extracting data from the Basque Health Service's Oracle Analytics Server health database for the entire population over 60 years of age in Gipuzkoa (a province in the Basque Country) as of 31 December 2022. The following variables were extracted: age, sex, pharmaceutical co-payment category, diagnosis of dementia, date of dementia diagnosis; the 19 diagnoses included in the Charlson Comorbidity Index (CCI),11,12 and use of primary care and hospital resources. The diagnoses of interest were identified in records of primary care episodes, hospitalisations and outpatient visits (see Supplementary material for criteria).13 We referred to gender in the introduction and the discussion to take into account the social and cultural dimension of gender,14 but we used the term sex in the methods and results sections. As the Basque Health System databases do not contain information on socioeconomic status, the pharmaceutical contribution established according to family household income was used as an approximation. This was categorised as follows:
- •
Disadvantaged population: individuals whose holder was exempt from payment (TSI 001).
- •
Low level: workers or pensioners with an income of less than €18,000 (TSI 002–01 and TSI 003).
- •
Medium level: workers or pensioners with an income of less than €18,000 (TSI 002–01 and TSI 003).
- •
High level: those with an income equal to or greater than €18,000 (TSI 002 – 01, TSI 004, TSI 005, TSI 005 – 03, TSI 006).
The lack of formal recording of neuropsychiatric symptoms in medical records has been previously demonstrated,13,15 and was addressed through the use of validated random forest algorithms (machine learning) built from comorbidity and pharmaceutical prescriptions.16 Performance indicators with this approach are good, with an area under the receiver operating characteristic curve of 0.80. In the original study, two clusters (psychotic and depressive) were identified. However, given that these two types of symptoms frequently occur together, we merged them into a single variable describing neuropsychiatric symptoms status in order to improve the interpretability of the results: “without neuropsychiatric symptoms” versus “with neuropsychiatric symptoms”. However, we recognise that this process involves a loss of information and a risk of the effects being diluted.
Cost analysisThis study examined direct healthcare costs, through the perspective of the Basque Health Service, by recording retrospectively primary care contacts, hospital admissions, home hospitalizations, emergency department attendances and outpatient consultations from 1 January 2021 to 31 December 2022. Although the pandemic led to a reduction in service usage in 2020, the Basque Health Service had fully recovered by 2021 and 2022. Unit costs for 2022 were obtained from the management accounting system (see Table S1 in Supplementary Material) as “relative value units”, to make a joint comparison of resource use. The costs incurred by individuals were calculated by multiplying their resource consumption over the two-year period by the relevant unit cost. This conversion allows us to consider multiple services together. However, we recognise that these unit costs may underestimate the actual costs, as they are based on the 2018 accounting systems of hospitals and primary care institutions and updated according to the consumer price index to 2022. In fact, healthcare costs rose by more than the consumer price index in those years.
Statistical analysisFirst, a univariate statistical analysis was performed to compare the observed data in individuals with and without dementia, and with and without neuropsychiatric symptoms, for each variable. For categorical variables, the χ2 test was then used to determine whether the distribution of the variables differed between the groups. As the costs did not follow a normal distribution, a non-parametric test (the Mann-Whitney U test) was used to compare medians.
In the regression models, the dependent variable (outcome variable) was total healthcare costs, including hospital and primary care costs. The main independent variable was the presence or absence of dementia. Age group, CCI and the presence of neuropsychiatric symptoms were included as covariates indicating the need of health resources. Socioeconomic status and sex were also included as adjustment covariates. The analysis was conducted in two phases. First, a model without interactions was constructed. Secondly, the interactions between dementia status and each of the covariates (age group, CCI, neuropsychiatric symptoms, socioeconomic status and sex) were analysed separately.
Modelling healthcare costs is challenging due to the data's asymmetric distribution and the large point mass at or near zero. To address this, we used generalized linear models from the Tweedie family, which are well-suited for continuous, asymmetric data with a point mass at zero. The Tweedie distribution is a special case of an exponential dispersion model where the mean-variance relationship is defined by a power parameter, p. We selected p within the range (1, 2) to model a compound Poisson-Gamma distribution. The optimal value of p was determined through a sensitivity analysis based on the lowest Akaike information criterion.
All statistical analyses were performed using the open-source statistical software R (version 4.3.3, R Core Team, Vienna, Austria) with a significance level of 95%. The following packages were used for specific analyses: compareGroups package17 for descriptive statistical analyses, statmod package18 for the Tweedie distribution in the models, and ggplot2 package19 for graphical visualization. The code to reproduce these analyses is open and available at https://github.com/lzumeta/HealthCare_costs_Dementia_Gipuzkoa.
Compliance with ethical standardsThis study was performed in line with the principles of the Declaration of Helsinki and received approval on May 12, 2021 from the Ethics and Clinical Research Committee of Euskadi (study code PI2021085) which waived the informed consent as all data were anonymized.
Institutional Review Board StatementThe study protocol (ref: PI21/01405), was approved by the Ethics and Clinical Research Committee of the Basque Country on 12 May 2021.
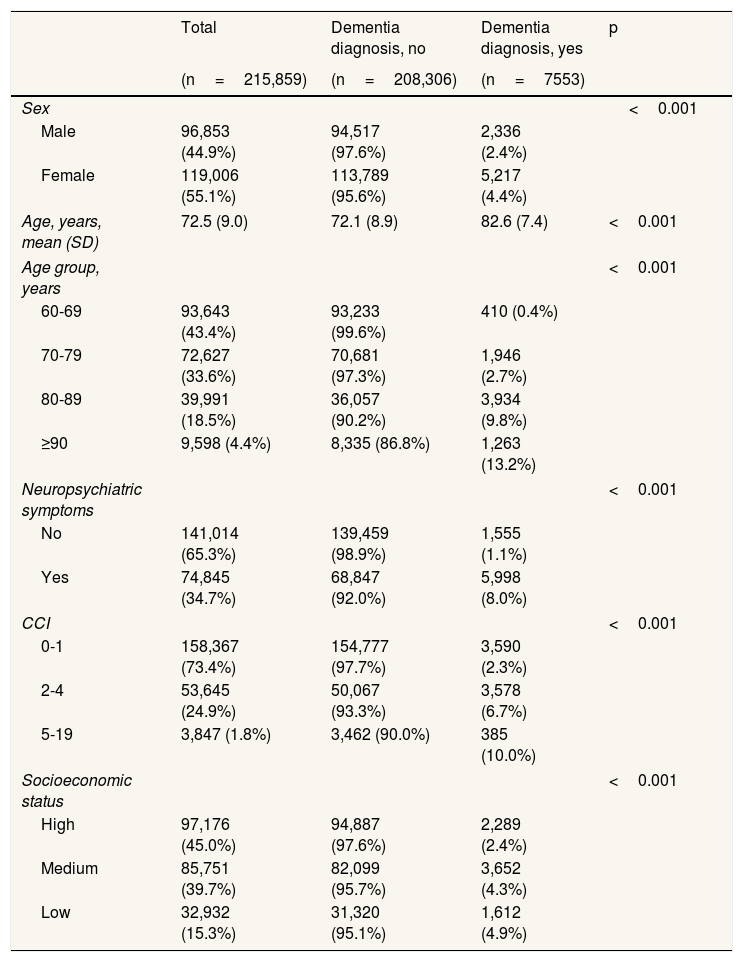
ResultsThe description of the population cohort by dementia status (Table 1) shows that of the 215,859 over-60-year-olds in Gipuzkoa registered, 7553 (3.5%) had been diagnosed with dementia. The prevalence of dementia was 4.9% in the low socioeconomic status group, compared to 2.4% in the high socioeconomic status population. The same magnitude of inequality was evident when comparing by sex (4.4% in women and 2.4% in men). Furthermore, the prevalence of dementia was higher in individuals with greater comorbidity, advanced age and/or neuropsychiatric symptoms.
Demographic and clinical characteristics of the study population disaggregated by dementia status.
| Total | Dementia diagnosis, no | Dementia diagnosis, yes | p | |
|---|---|---|---|---|
| (n=215,859) | (n=208,306) | (n=7553) | ||
| Sex | <0.001 | |||
| Male | 96,853 (44.9%) | 94,517 (97.6%) | 2,336 (2.4%) | |
| Female | 119,006 (55.1%) | 113,789 (95.6%) | 5,217 (4.4%) | |
| Age, years, mean (SD) | 72.5 (9.0) | 72.1 (8.9) | 82.6 (7.4) | <0.001 |
| Age group, years | <0.001 | |||
| 60-69 | 93,643 (43.4%) | 93,233 (99.6%) | 410 (0.4%) | |
| 70-79 | 72,627 (33.6%) | 70,681 (97.3%) | 1,946 (2.7%) | |
| 80-89 | 39,991 (18.5%) | 36,057 (90.2%) | 3,934 (9.8%) | |
| ≥90 | 9,598 (4.4%) | 8,335 (86.8%) | 1,263 (13.2%) | |
| Neuropsychiatric symptoms | <0.001 | |||
| No | 141,014 (65.3%) | 139,459 (98.9%) | 1,555 (1.1%) | |
| Yes | 74,845 (34.7%) | 68,847 (92.0%) | 5,998 (8.0%) | |
| CCI | <0.001 | |||
| 0-1 | 158,367 (73.4%) | 154,777 (97.7%) | 3,590 (2.3%) | |
| 2-4 | 53,645 (24.9%) | 50,067 (93.3%) | 3,578 (6.7%) | |
| 5-19 | 3,847 (1.8%) | 3,462 (90.0%) | 385 (10.0%) | |
| Socioeconomic status | <0.001 | |||
| High | 97,176 (45.0%) | 94,887 (97.6%) | 2,289 (2.4%) | |
| Medium | 85,751 (39.7%) | 82,099 (95.7%) | 3,652 (4.3%) | |
| Low | 32,932 (15.3%) | 31,320 (95.1%) | 1,612 (4.9%) | |
CCI: Charlson Comorbidity Index; SD: standard deviation.
Means (SD) are shown for continuous variables and absolute (%) frequencies for categorical variables.
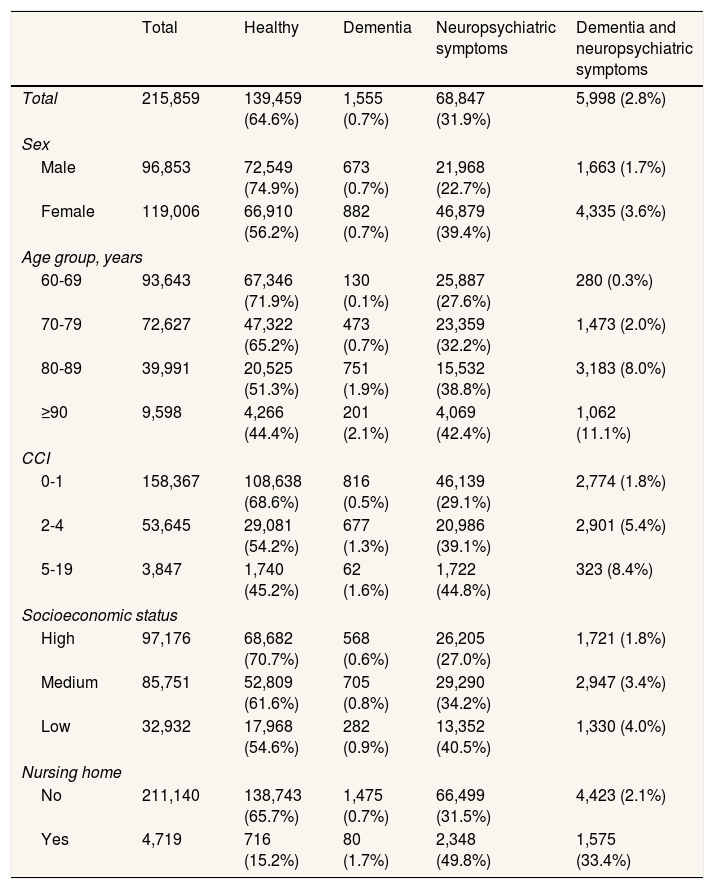
Table 2 shows the distribution of variables by the four categories based on dementia and neuropsychiatric symptoms status across the covariates. Of the total population over 60 years (215,859 individuals), 0.7% had dementia only, 31.9% had neuropsychiatric symptoms only, 2.8% had both conditions, and 64.6% had neither. Notably, 79% of people with dementia also had neuropsychiatric symptoms. The percentage of people in the dual diagnosis group rose from 1.8% in the high socioeconomic status group to 4.0% in the low socioeconomic status group, while the percentage in the “healthy” group (not diagnosed with either dementia or neuropsychiatric symptoms) dropped from 70.7% in the high socioeconomic status group to 54.6% in the low group.
Demographic and clinical characteristics of the study population disaggregated by dementia and neuropsychiatric symptom status.
| Total | Healthy | Dementia | Neuropsychiatric symptoms | Dementia and neuropsychiatric symptoms | |
|---|---|---|---|---|---|
| Total | 215,859 | 139,459 (64.6%) | 1,555 (0.7%) | 68,847 (31.9%) | 5,998 (2.8%) |
| Sex | |||||
| Male | 96,853 | 72,549 (74.9%) | 673 (0.7%) | 21,968 (22.7%) | 1,663 (1.7%) |
| Female | 119,006 | 66,910 (56.2%) | 882 (0.7%) | 46,879 (39.4%) | 4,335 (3.6%) |
| Age group, years | |||||
| 60-69 | 93,643 | 67,346 (71.9%) | 130 (0.1%) | 25,887 (27.6%) | 280 (0.3%) |
| 70-79 | 72,627 | 47,322 (65.2%) | 473 (0.7%) | 23,359 (32.2%) | 1,473 (2.0%) |
| 80-89 | 39,991 | 20,525 (51.3%) | 751 (1.9%) | 15,532 (38.8%) | 3,183 (8.0%) |
| ≥90 | 9,598 | 4,266 (44.4%) | 201 (2.1%) | 4,069 (42.4%) | 1,062 (11.1%) |
| CCI | |||||
| 0-1 | 158,367 | 108,638 (68.6%) | 816 (0.5%) | 46,139 (29.1%) | 2,774 (1.8%) |
| 2-4 | 53,645 | 29,081 (54.2%) | 677 (1.3%) | 20,986 (39.1%) | 2,901 (5.4%) |
| 5-19 | 3,847 | 1,740 (45.2%) | 62 (1.6%) | 1,722 (44.8%) | 323 (8.4%) |
| Socioeconomic status | |||||
| High | 97,176 | 68,682 (70.7%) | 568 (0.6%) | 26,205 (27.0%) | 1,721 (1.8%) |
| Medium | 85,751 | 52,809 (61.6%) | 705 (0.8%) | 29,290 (34.2%) | 2,947 (3.4%) |
| Low | 32,932 | 17,968 (54.6%) | 282 (0.9%) | 13,352 (40.5%) | 1,330 (4.0%) |
| Nursing home | |||||
| No | 211,140 | 138,743 (65.7%) | 1,475 (0.7%) | 66,499 (31.5%) | 4,423 (2.1%) |
| Yes | 4,719 | 716 (15.2%) | 80 (1.7%) | 2,348 (49.8%) | 1,575 (33.4%) |
CCI: Charlson Comorbidity Index.
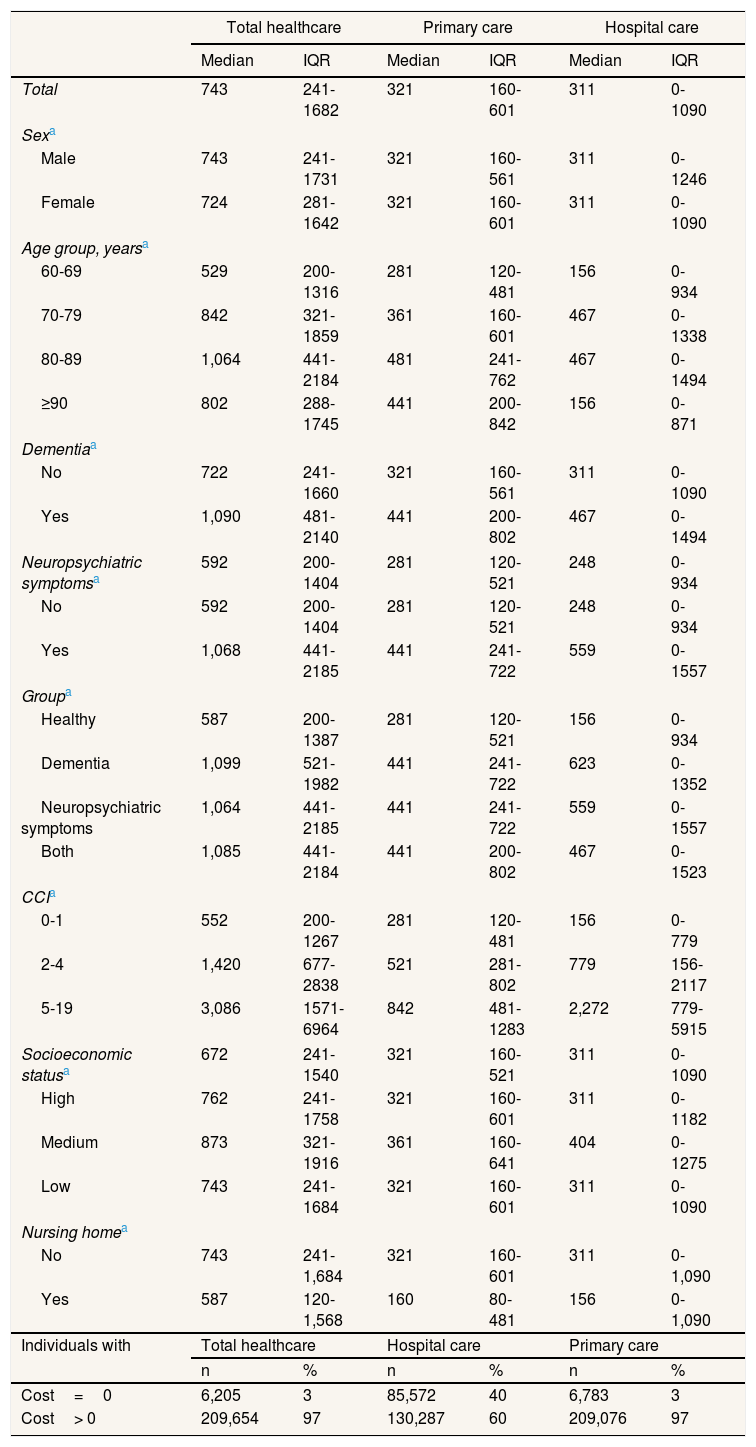
The raw costs broken down by category of descriptive variable are listed in Table 3. The median cost was €743 (interquartile range [IQR]: 241-182) for the total population, which can be broken down into €311 (IQR: 0-1090) for hospital care and €321 (IQR: 160-601) for primary care. When comparing groups by dementia status, it was found that those with dementia had higher costs in three types of cost. Comparing groups by dementia status, those with dementia had higher costs in three types of cost. The characteristic that varied most between categories was CCI, the median cost ranging from €552 for the group with the lowest level of comorbidity to €3086 for the group with the highest. The total costs increased with age up to the 80–89 age group (median cost of €1,064) and then decreased in the ≥90-year-olds group (€802). When total hospital care costs were broken down by population group, the main differences emerged in hospital admissions (see Table S3 in Supplementary Material).
Two-year median raw costs for total healthcare, hospital care and primary care, broken down by descriptive variable categories, in euros in 2022.
| Total healthcare | Primary care | Hospital care | ||||
|---|---|---|---|---|---|---|
| Median | IQR | Median | IQR | Median | IQR | |
| Total | 743 | 241-1682 | 321 | 160-601 | 311 | 0-1090 |
| Sexa | ||||||
| Male | 743 | 241-1731 | 321 | 160-561 | 311 | 0-1246 |
| Female | 724 | 281-1642 | 321 | 160-601 | 311 | 0-1090 |
| Age group, yearsa | ||||||
| 60-69 | 529 | 200-1316 | 281 | 120-481 | 156 | 0-934 |
| 70-79 | 842 | 321-1859 | 361 | 160-601 | 467 | 0-1338 |
| 80-89 | 1,064 | 441-2184 | 481 | 241-762 | 467 | 0-1494 |
| ≥90 | 802 | 288-1745 | 441 | 200-842 | 156 | 0-871 |
| Dementiaa | ||||||
| No | 722 | 241-1660 | 321 | 160-561 | 311 | 0-1090 |
| Yes | 1,090 | 481-2140 | 441 | 200-802 | 467 | 0-1494 |
| Neuropsychiatric symptomsa | 592 | 200-1404 | 281 | 120-521 | 248 | 0-934 |
| No | 592 | 200-1404 | 281 | 120-521 | 248 | 0-934 |
| Yes | 1,068 | 441-2185 | 441 | 241-722 | 559 | 0-1557 |
| Groupa | ||||||
| Healthy | 587 | 200-1387 | 281 | 120-521 | 156 | 0-934 |
| Dementia | 1,099 | 521-1982 | 441 | 241-722 | 623 | 0-1352 |
| Neuropsychiatric symptoms | 1,064 | 441-2185 | 441 | 241-722 | 559 | 0-1557 |
| Both | 1,085 | 441-2184 | 441 | 200-802 | 467 | 0-1523 |
| CCIa | ||||||
| 0-1 | 552 | 200-1267 | 281 | 120-481 | 156 | 0-779 |
| 2-4 | 1,420 | 677-2838 | 521 | 281-802 | 779 | 156-2117 |
| 5-19 | 3,086 | 1571-6964 | 842 | 481-1283 | 2,272 | 779-5915 |
| Socioeconomic statusa | 672 | 241-1540 | 321 | 160-521 | 311 | 0-1090 |
| High | 762 | 241-1758 | 321 | 160-601 | 311 | 0-1182 |
| Medium | 873 | 321-1916 | 361 | 160-641 | 404 | 0-1275 |
| Low | 743 | 241-1684 | 321 | 160-601 | 311 | 0-1090 |
| Nursing homea | ||||||
| No | 743 | 241-1,684 | 321 | 160-601 | 311 | 0-1,090 |
| Yes | 587 | 120-1,568 | 160 | 80-481 | 156 | 0-1,090 |
| Individuals with | Total healthcare | Hospital care | Primary care | |||
| n | % | n | % | n | % | |
| Cost=0 | 6,205 | 3 | 85,572 | 40 | 6,783 | 3 |
| Cost> 0 | 209,654 | 97 | 130,287 | 60 | 209,076 | 97 |
CCI: Charlson Comorbidity Index. IQR: interquartile range.
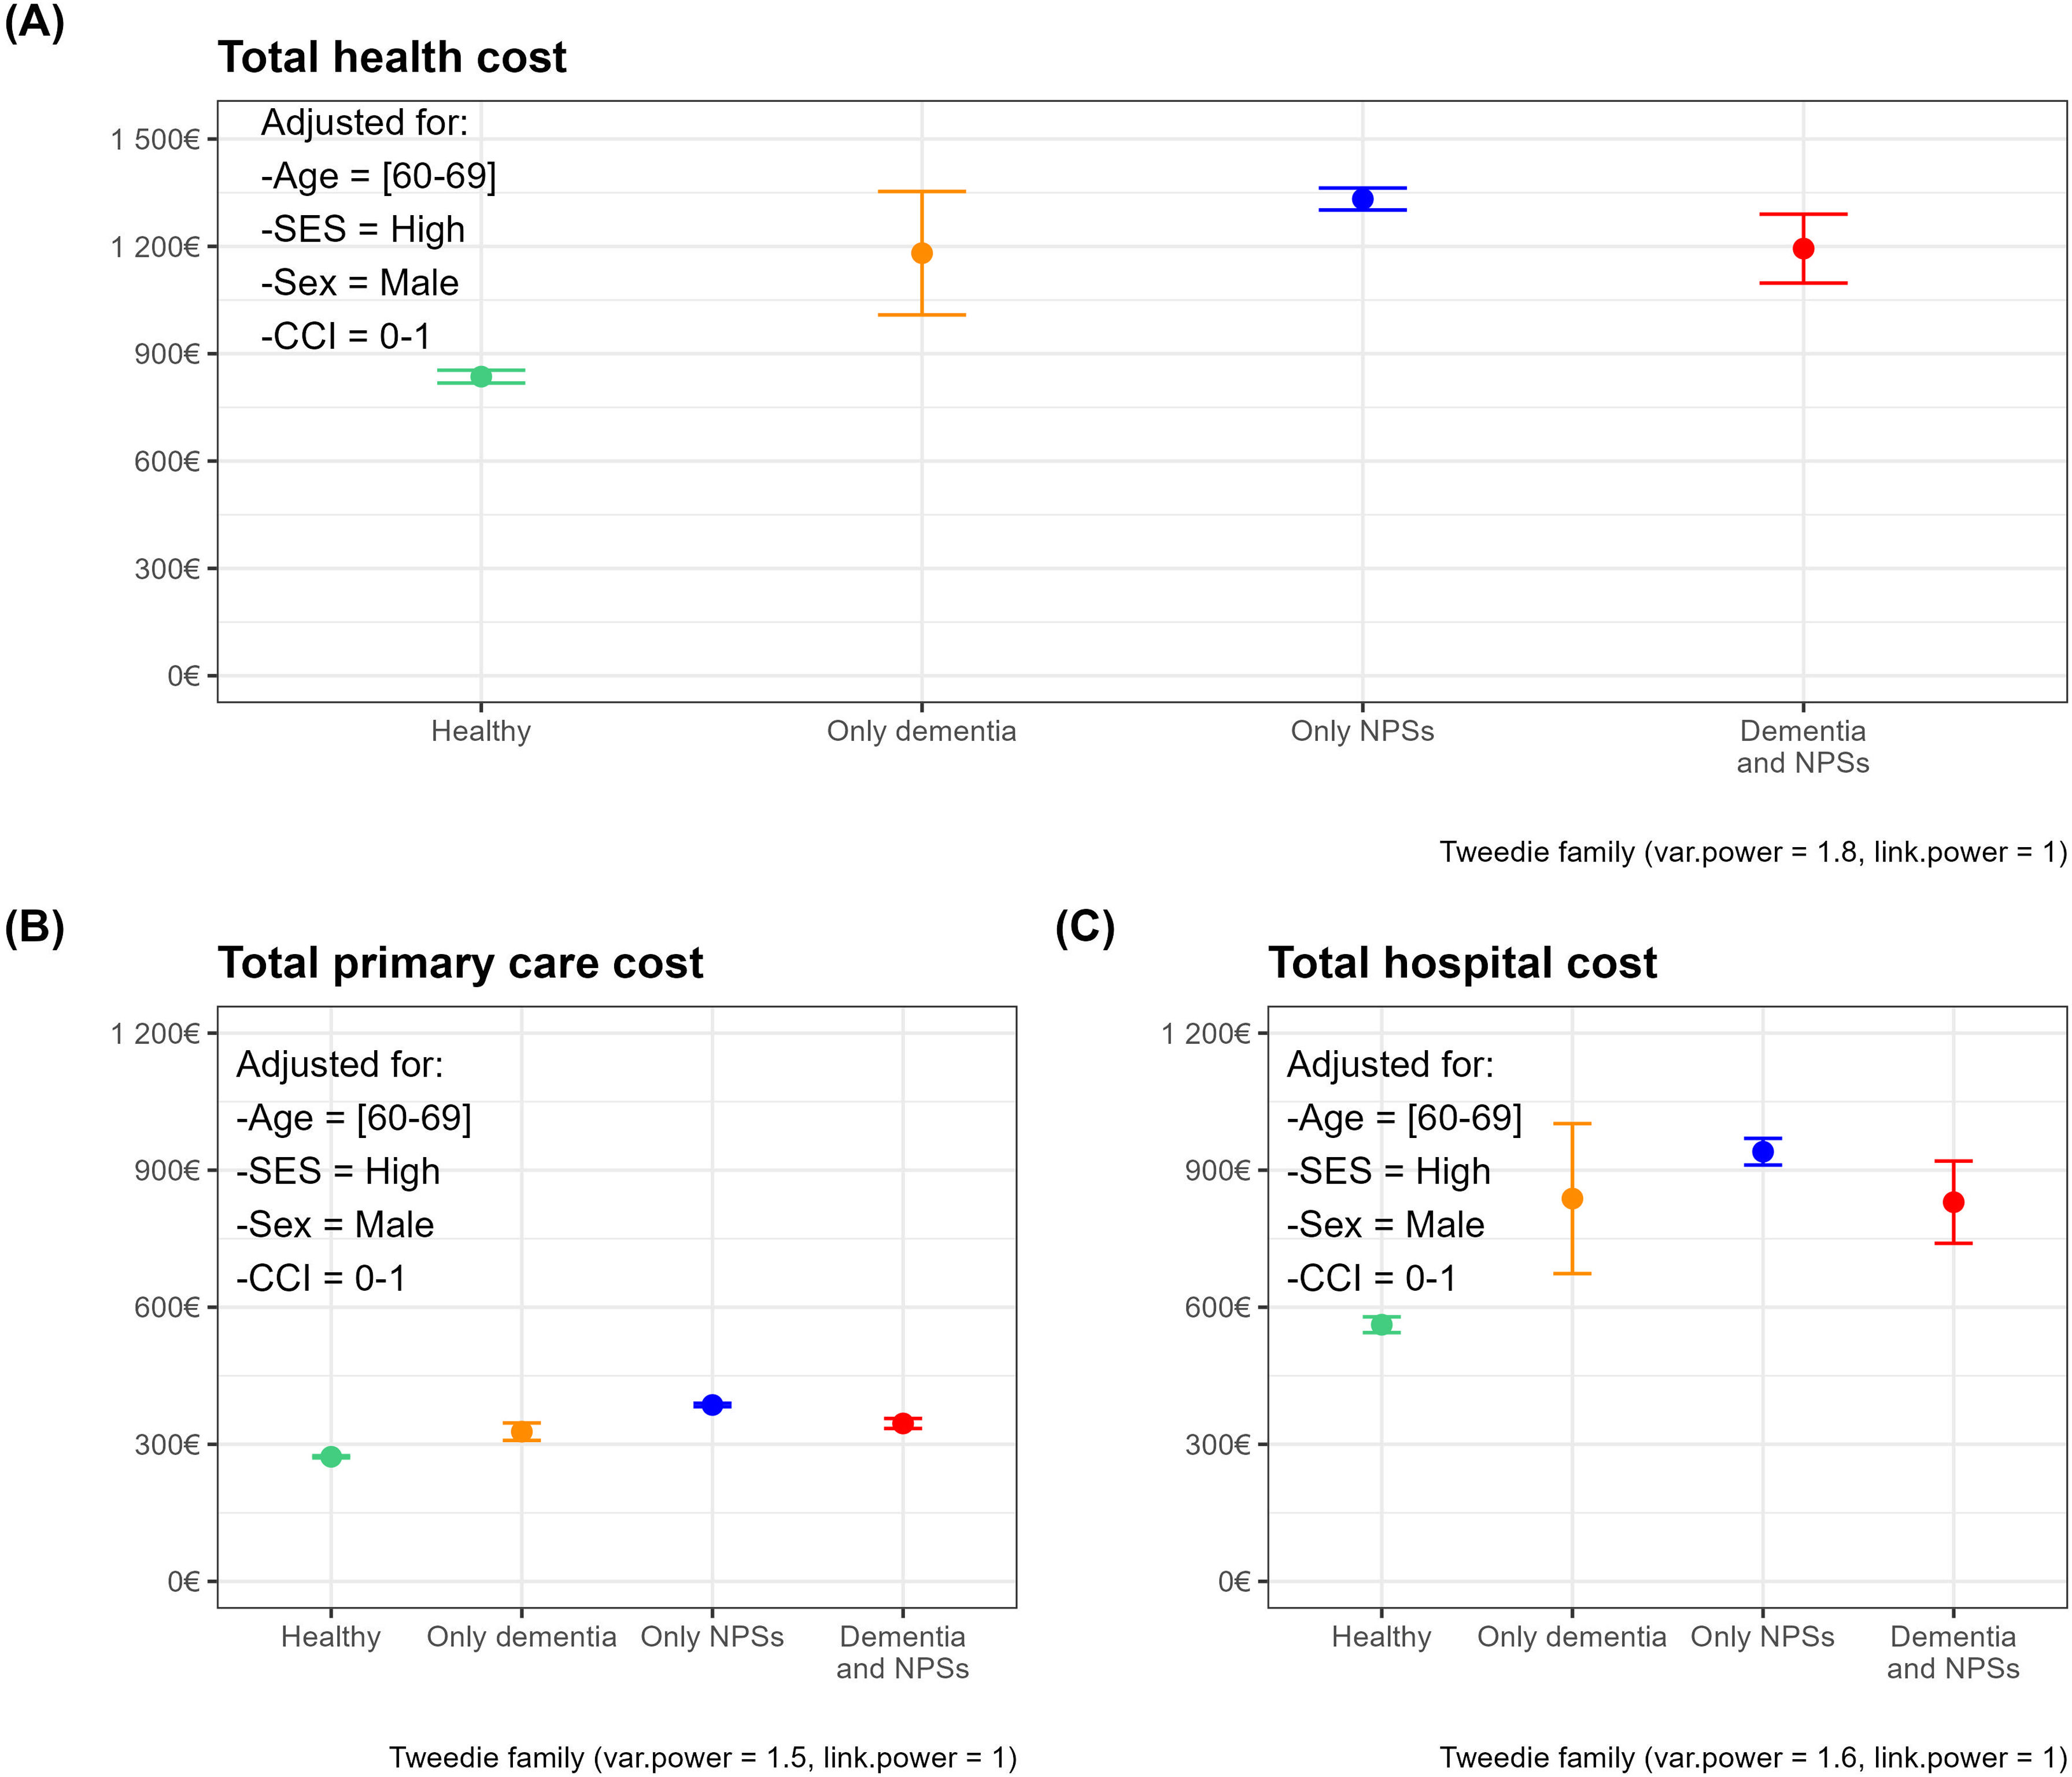
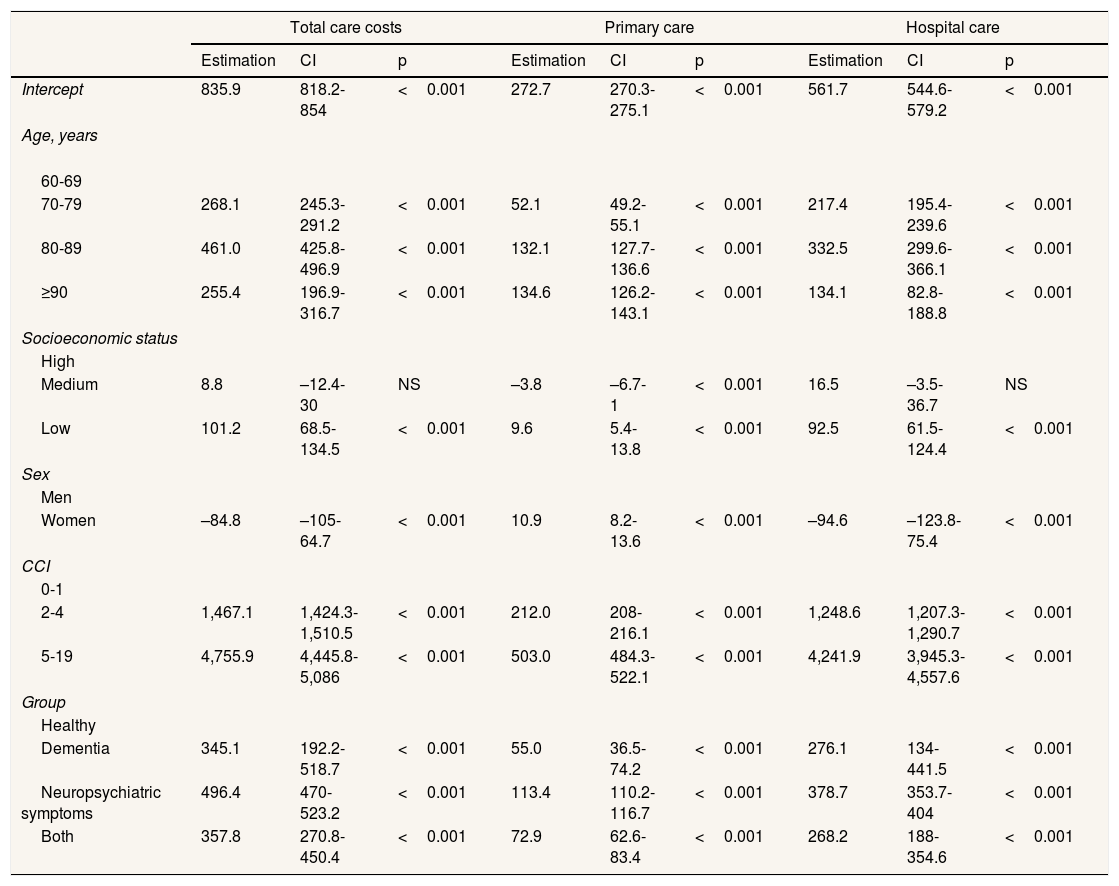
The Tweedie regression models (Table 4) indicate that the only-neuropsychiatric symptoms group used the most healthcare resources when adjusted for the other variables, with an estimator of €496 compared to €358 for the group with both conditions. The results for other variables show the same pattern as the raw costs listed in Table 3, with gradients according to CCI, socioeconomic status, and age. It is also apparent that the estimator is lower in the ≥90 age group than in the 80–89 age group. The complete Tweedie models of total, primary care and hospital costs without interactions and with interactions between population group and socioeconomic status are provided in the supplementary material (see Tables S4 to S9 in Supplementary Material) and showed significant interactions.
Result of the generalised linear models (Tweedie family) for two-year total healthcare costs, primary care costs and hospital care costs adjusted for gender, age group, Charlson Comorbidity Index, socioeconomic status, and population group (dementia/neuropsychiatric symptoms).
| Total care costs | Primary care | Hospital care | |||||||
|---|---|---|---|---|---|---|---|---|---|
| Estimation | CI | p | Estimation | CI | p | Estimation | CI | p | |
| Intercept | 835.9 | 818.2-854 | <0.001 | 272.7 | 270.3-275.1 | <0.001 | 561.7 | 544.6-579.2 | <0.001 |
| Age, years | |||||||||
| 60-69 | |||||||||
| 70-79 | 268.1 | 245.3-291.2 | <0.001 | 52.1 | 49.2-55.1 | <0.001 | 217.4 | 195.4-239.6 | <0.001 |
| 80-89 | 461.0 | 425.8-496.9 | <0.001 | 132.1 | 127.7-136.6 | <0.001 | 332.5 | 299.6-366.1 | <0.001 |
| ≥90 | 255.4 | 196.9-316.7 | <0.001 | 134.6 | 126.2-143.1 | <0.001 | 134.1 | 82.8-188.8 | <0.001 |
| Socioeconomic status | |||||||||
| High | |||||||||
| Medium | 8.8 | –12.4-30 | NS | –3.8 | –6.7-1 | <0.001 | 16.5 | –3.5-36.7 | NS |
| Low | 101.2 | 68.5-134.5 | <0.001 | 9.6 | 5.4-13.8 | <0.001 | 92.5 | 61.5-124.4 | <0.001 |
| Sex | |||||||||
| Men | |||||||||
| Women | –84.8 | –105-64.7 | <0.001 | 10.9 | 8.2-13.6 | <0.001 | –94.6 | –123.8-75.4 | <0.001 |
| CCI | |||||||||
| 0-1 | |||||||||
| 2-4 | 1,467.1 | 1,424.3-1,510.5 | <0.001 | 212.0 | 208-216.1 | <0.001 | 1,248.6 | 1,207.3-1,290.7 | <0.001 |
| 5-19 | 4,755.9 | 4,445.8-5,086 | <0.001 | 503.0 | 484.3-522.1 | <0.001 | 4,241.9 | 3,945.3-4,557.6 | <0.001 |
| Group | |||||||||
| Healthy | |||||||||
| Dementia | 345.1 | 192.2-518.7 | <0.001 | 55.0 | 36.5-74.2 | <0.001 | 276.1 | 134-441.5 | <0.001 |
| Neuropsychiatric symptoms | 496.4 | 470-523.2 | <0.001 | 113.4 | 110.2-116.7 | <0.001 | 378.7 | 353.7-404 | <0.001 |
| Both | 357.8 | 270.8-450.4 | <0.001 | 72.9 | 62.6-83.4 | <0.001 | 268.2 | 188-354.6 | <0.001 |
CCI: Charlson Comorbidity Index. CI: confidence interval; NS: non significant (p ≥0.05).
Figure 1 represents the mean of the estimated costs and upper and lower confidence limits for each population group for the reference categories of covariates obtained from total healthcare costs (Fig. 1 A), primary care (Fig. 1 B) and hospital costs (Fig. 1C).

Adjusted mean health costs and confidence intervals by population group. Panels correspond to cost-specific models: total (A), primary care (B), and hospital costs (C). The reference subject is a male, 60-69-year-old with high socioeconomic status and a Charlson Comorbidity Index (CCI) of 0-1. NPS: neuropsychiatric symptoms; SES: socioeconomic status.
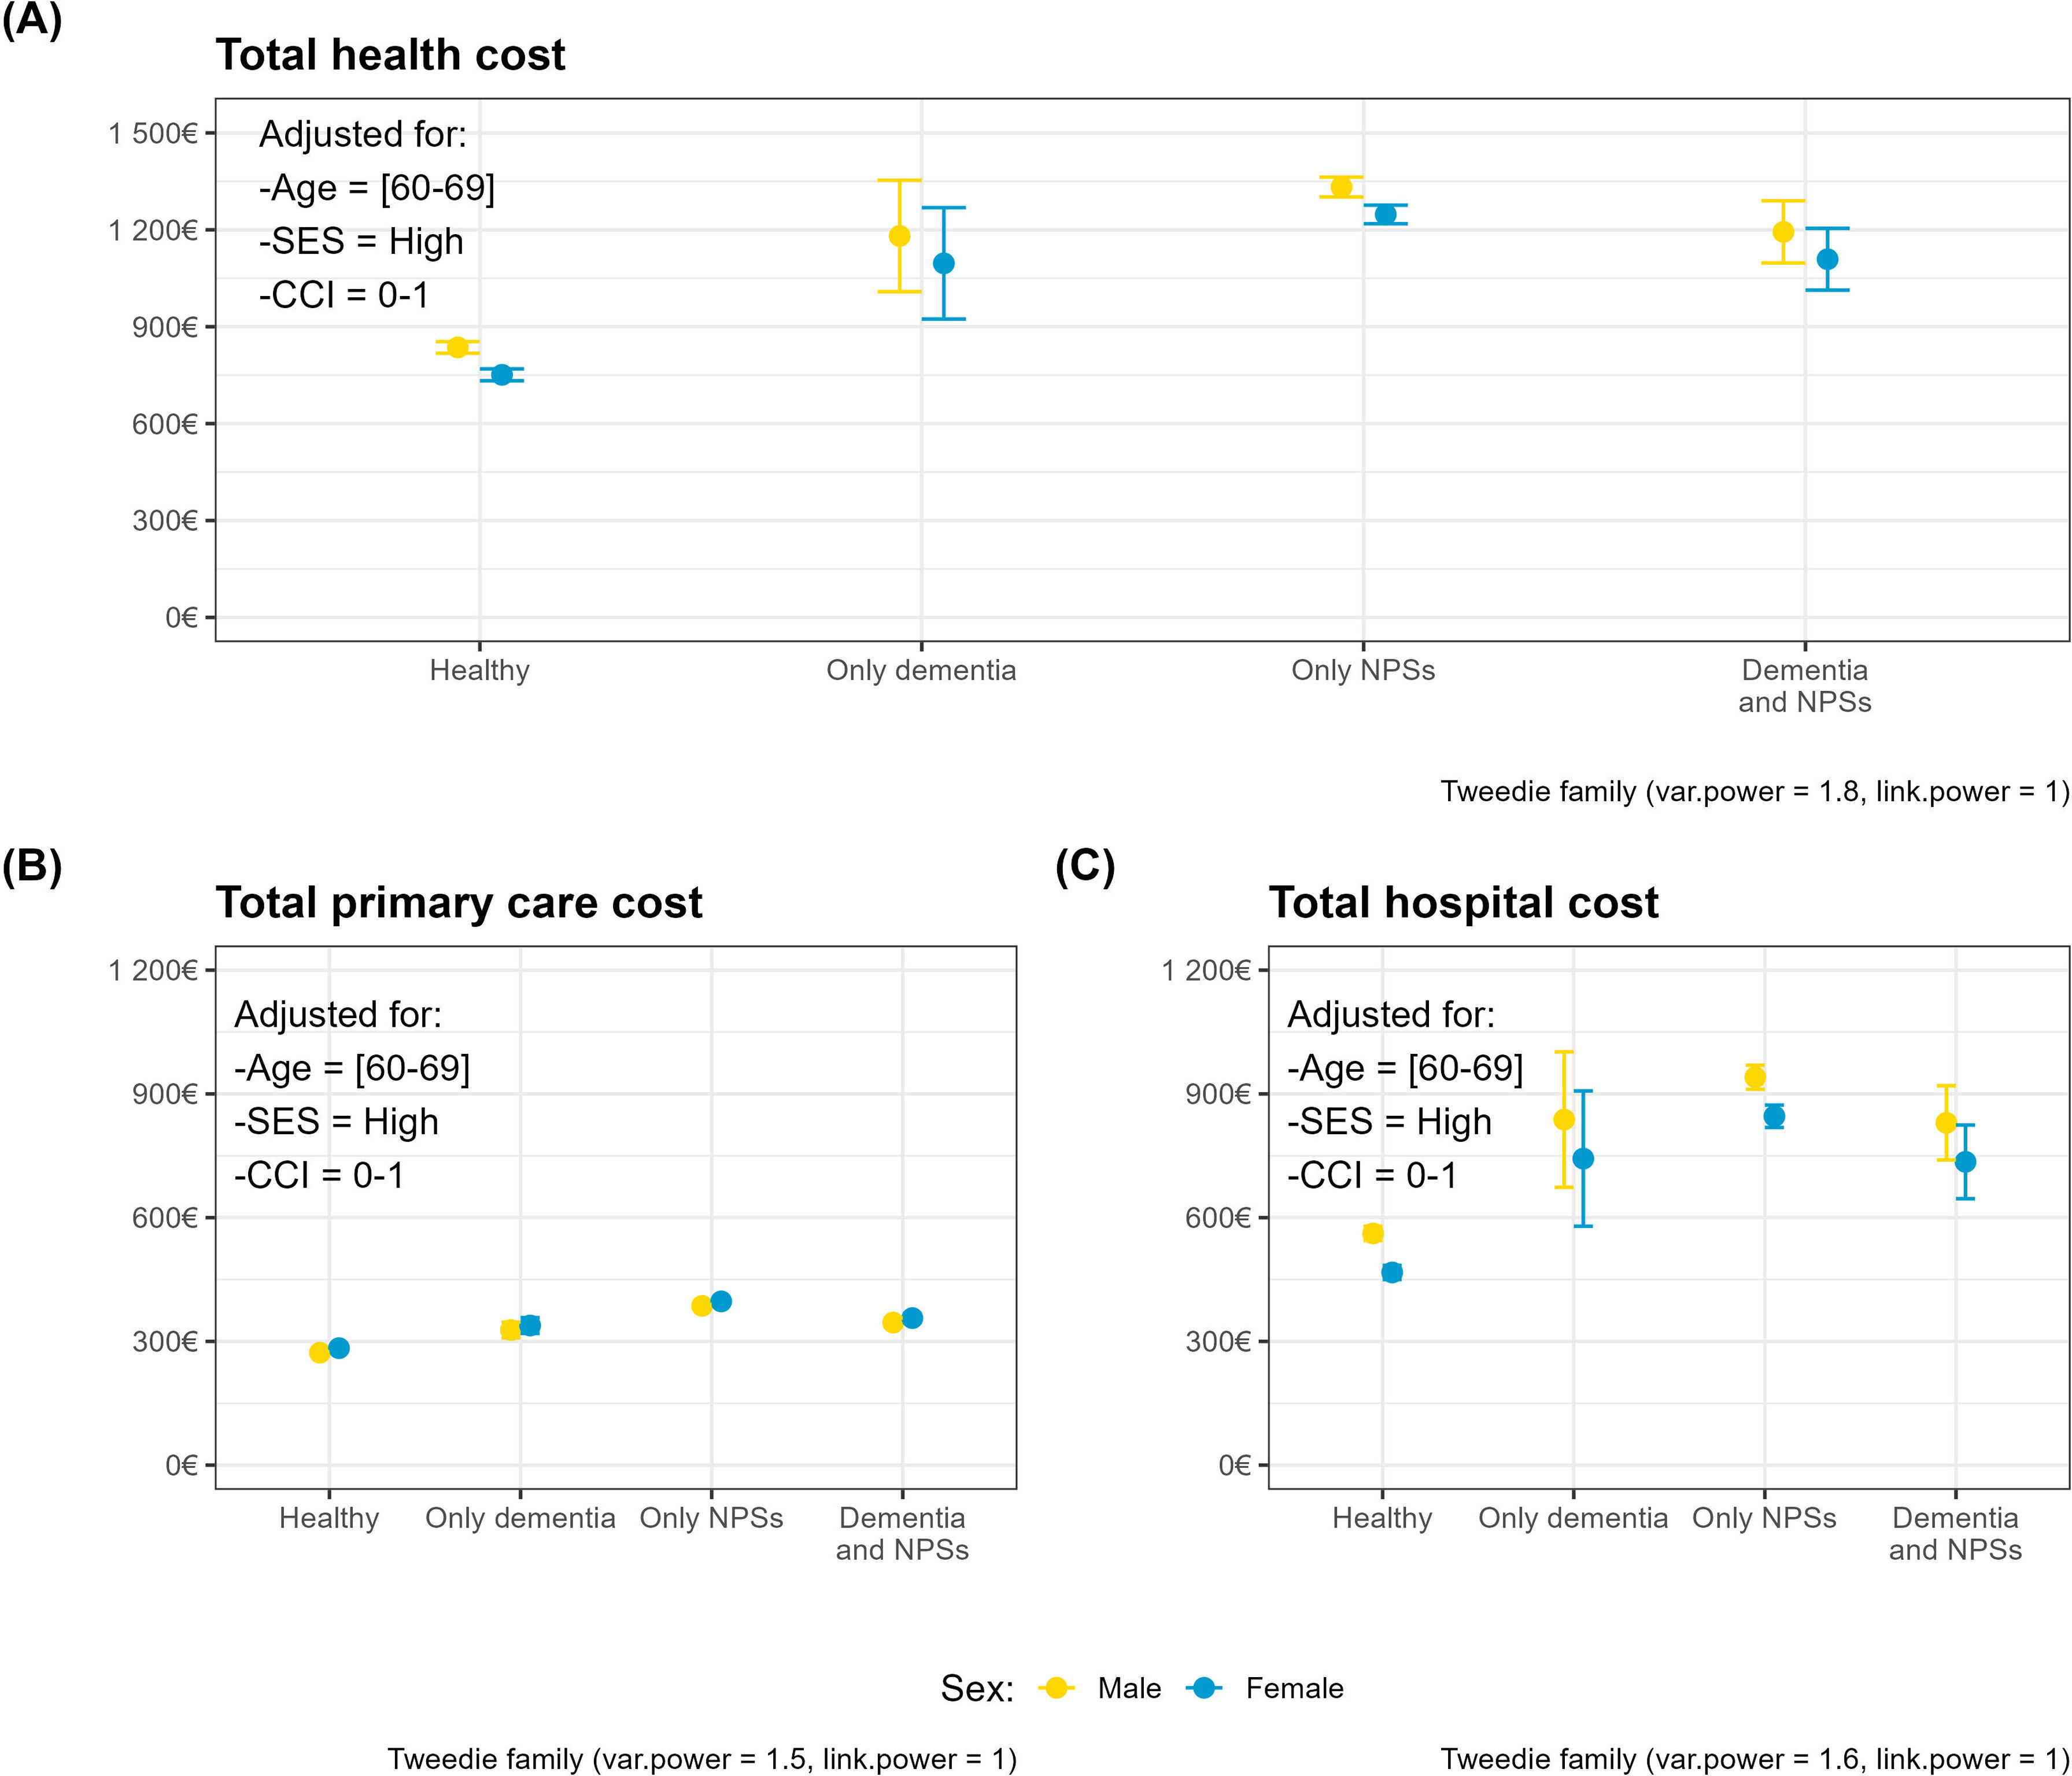
Figure 2 shows the same indicators for each of the cost-specific models, broken down by sex. These plots help visualise the higher costs in the only-neuropsychiatric symptoms group versus the both conditions group. Furthermore, women receive a lower amount of healthcare than men, despite this being adjusted according to need.

Adjusted mean health costs and confidence intervals by population group and sex. Panels correspond to cost-specific models: total (A), primary care (B), and hospital costs (C). The reference subject is a 60-69-year-old with high socioeconomic status and a Charlson Comorbidity Index (CCI) of 0-1. NPS: neuropsychiatric symptoms; SES: socioeconomic status.
The main finding of this study is that, when resource use, or better expenditure adjusted for need, is adjusted for need, people with dementia receive less healthcare than people without dementia. However, it is difficult to determine whether this is harmful because it deprives people with dementia of necessary care,20 or beneficial because it spares them from receiving unnecessary treatment.21 In the former instance, the law on disproportionate care5 would be complied with, and overuse of health services would be avoided in the latter. Although the raw cost is higher in groups with dementia, in the populations characterised by the presence of neuropsychiatric symptoms, the total healthcare cost estimator adjusted for CCI, age and gender is higher in the group without dementia than in that with dementia (€496 vs €358). This difference between raw and adjusted costs can be explained by the fact that individuals in the dementia group are older and have more comorbidities. In accordance with the terminology of the disproportionate care law, this could mean that, their higher needs are not being met proportionally. Adequate access to healthcare resources is essential for enabling people with dementia to maintain their independence, as emphasised in the Global Action Plan on the Public Health Response to Dementia 2017–2025, adopted by World Health Organization member states at the 70th World Health Assembly.1 However, defining appropriate care is challenging because more is not always better in healthcare, especially for multimorbid elderly patients.21 The challenge lies in addressing all conditions that may reduce quality of life and avoiding interventions whose potential for harm exceeds possible benefit.20,21
Combating stigma is critical to ensuring equity of access to services for vulnerable groups, particularly those affected by social interactions associated with a stigmatised characteristic.22,23 The management of neuropsychiatric symptoms in dementia patients is an example of overuse of antipsychotics. Reducing the use of antipsychotics in low socioeconomic status patients by increasing the availability of non-pharmacological treatments could help reduce inequity in the management of neuropsychiatric symptoms 10. At the same time, in order to reduce their severity, expert recommendations emphasise that efforts must be made to control all conditions that may affect patients’ well-being such as pain from musculoskeletal problems and urinary tract infections.24,25
The higher healthcare costs in the low socioeconomic status group can be partly explained by the fact that 15% of the population in Gipuzkoa has dual healthcare coverage,26 and most of these people have a high socioeconomic status. In any case, only 15% of the population in Gipuzkoa had dual health coverage in 2020.26 On the other hand, the Basque Health Service is a tax-funded Beveridge-style system providing universal coverage.27 The benefits of this type of system in terms of greater equity have been widely demonstrated.28 Nonetheless, while universal health coverage may appear to guarantee equity, it is essential to assess resource use and ensure that vulnerable groups, such as people with dementia, receive adequate healthcare. As is well known, conditions not quantitatively measured are undervalued. Providing equitable care requires acknowledging people's vulnerability and specific care requirements. The interaction between the three analysed costs (total, hospital and primary care) and socioeconomic status was significant, showing that the medium socioeconomic status and neuropsychiatric symptoms group increased its costs. For individuals with neuropsychiatric symptoms, dementia status determines whether the level of healthcare they receive.
As expected, the differences according to CCI show that the greater the comorbidity, the higher the costs in both hospital and non-hospital settings.29 Although people with higher comorbidity tend to be men, older people and more likely to have dementia, the gradient in total and primary care costs as a function of CCI remains in the regression models. This can be interpreted as an absence of inequity.
Clear differences by gender indicate that women receive less care for equal needs.30,31 Inequities related to dementia in women are mediated by their lower income, older age, higher risk of dementia and lower level of comorbidity.6,10 Therefore, the relevant results are those adjusted for these variables, which reveal gender-related inequities at both hospital and primary care levels. Similarly, the conclusions of Cooper et al. suggest greater inequity among women with dementia, who receive less healthcare than men with dementia.4
The healthcare system also treats differently the ≥90 age group, as they use services less frequently than the 80–89 age group, both in raw terms and when adjusted for covariates indicative of need such as CCI, dementia, and/or neuropsychiatric symptoms. This finding is evident in both total costs and primary care costs. Within the context of overuse, this pattern could be attributed to the belief that it is better for this age group not to receive care in order to avoid potential harm.3,21
As Cookson et al.5 point out, measuring healthcare service delivery is easier than measuring need for care. One strength of this study is that population data were available from electronic health record databases. These sources provided data that can be used to assess the need for healthcare, such as the presence of non-communicable diseases, age, gender, comorbidity and socioeconomic status. Although they do not offer the depth of information provided by surveys,32,33 such records do contain data on entire populations, unlike survey-based studies.34
LimitationsThe lack of data on the costs of private healthcare is a limitation that should be recognised, particularly since under-reporting primarily affects higher-income populations. As this is a retrospective study, only individuals who survived until the end of the two years were included. This introduced a survival bias, which may have distorted the actual level of inequity by eliminating the most fragile individuals. However, this limitation is partly offset as it affects all the analysed groups. Furthermore, patients with dual coverage use the public system to access subsidised medication, meaning their contact details are recorded. We also recognise that measuring only healthcare costs does not take into account the care ecosystem for dementia patients, which consists of a combination of healthcare, informal care provided by families, and social care provided by social services. Moreover, our dataset did not include key variables such as loneliness status, marital status and family support, all of which play a crucial role in dementia patient care. Another limitation to note is that the unit costs are derived from updated figures from 2018, which underestimate the value in 2022 because the growth in healthcare costs was higher than the consumer price index. This may explain why the average cost is lower than that indicated by the Organisation for Economic Co-operation and Development in its report on Spain.35
ConclusionsPeople with dementia, women and those aged 90 and over receive less care than others with comparable needs. This could be an example of the disproportionate care law, or it could be a way of avoiding unnecessary treatment and overuse of health services. In any case, reducing the stigma surrounding cognitive impairment would convey the message that it is not a contraindication to healthcare that can improve the quality of life of patients and their families.
Availability of data and materialsAll statistical analyses were performed using the open-source statistical software R (version 4.3.3, R Core Team, Vienna, Austria) with a significance level of 95%. The following packages were used for specific analyses: compareGroups package17 for descriptive statistical analyses, statmod package18 for the Tweedie distribution in the models, and ggplot2 package19 for graphical visualization. The code to reproduce these analyses is open and available at https://github.com/lzumeta/HealthCare_costs_Dementia_Gipuzkoa. The owner of the data is the Basque Health Service which maintains a policy of restricted data access for ethical reasons. Our agreement with the Basque Health Service establishes that individual level data cannot be shared publicly because of confidentiality. Applications for access to the dataset must be made with the approval of the Basque Health Service (https://www.osakidetza.euskadi.eus/servicios-para-profesionales/webosk00-sercon/es/).
People living with Alzheimer's disease and related dementias are a vulnerable group who are at risk of receiving less care than they could need.
What does this study add to the literature?People with dementia, women and those aged 60 and over of both sexes receive less care.
What are the implications of the results?This can be either a case of disproportionate care, or an attempt to avoid causing more harm than good.
Salvador Peiró.
Transparency declarationThe corresponding author, on behalf of the other authors guarantee the accuracy, transparency and honesty of the data and information contained in the study, that no relevant information has been omitted and that all discrepancies between authors have been adequately resolved and described.
Authorship contributionsJ. Mar, M. Soto-Gordoa and M. Merino designed the study. J. Mar wrote the main manuscript text (Introduction and Discussion). L. Zumeta-Olaskoaga wrote the main manuscript text (Method and Results). L. Zumeta-Olaskoaga and O. Ibarrondo conducted the statistical analysis. M. Soto-Gordoa and O. Ibarrondo collected the data and reviewed the literature. All authors reviewed the manuscript.
We acknowledge the help of Ideas Need Communicating Language Services in improving the use of English in the manuscript.


