


To analyse the effect of the Great Recession (2008) on primary care (PC) and secondary care (SC) inequalities in Spain.
MethodRepeated cross-sectional study using Spanish Health Surveys from 2001 to 2017 (n=139,566). Prevalence of PC and SC utilization were calculated standardized by age. Chi square tests for trend were conducted to explore the evolution. We performed logistic regression analyses adjusted by the Andersen's model of demand for care to explore inequalities prior to, during and following the recession. All the analyses were stratified by sex.
ResultsHealthcare use trends changed from a rapid increase in the pre-recession period to a plateau during the recession and a decrease in the post-recession period. Healthcare use was higher in women (PC: 15.8% to 32.5%; SC: 8.2% to 16.2%) than in men (PC: 11.3% to 24.1%; SC: 5.4% to 11.6%) and the gender gap increased. During the recession the likelihood of PC use was higher in disadvantaged groups, while SC had greater usage amongst more advantaged social groups. Inequalities in SC use increased during the recession and could not be attributed to factors of need.
ConclusionsHealthcare use trends changed as a result of the recession. There are socioeconomic inequalities in the use of PC and SC in Spain, which increased in secondary care, during the recession and in the post-recession period. It is necessary to take into account socioeconomic determinants in health planning, in order to achieve equity in healthcare services.
Analizar el efecto de la Gran Recesión en las desigualdades en el uso de atención primaria (AP) y atención especializada (AE) en España.
MétodoAnálisis transversal repetido (Encuestas Nacionales de Salud 2001-2017; n=139.566). Se calcularon las prevalencias de utilización estandarizadas por edad y se realizó el cálculo de tendencias para explorar la evolución. Se llevaron a cabo análisis de regresión logística ajustados por el Modelo de demanda asistencial de Andersen para estudiar las desigualdades en los periodos anterior, durante y posterior a la crisis. Todos los análisis se estratificaron por sexo.
ResultadosLa tendencia en la utilización de los servicios sanitarios pasó de un rápido incremento en el periodo anterior a la crisis a una estabilización durante la crisis y un posterior descenso. La utilización de los servicios sanitarios fue mayor en las mujeres (AP: 15,8% a 32,5%; AE: 8,2% a 16,2%) que en los hombres (AP: 11,3% a 24,1%; AE: 5,4% a 11,6%), aumentando las diferencias. Durante la crisis, la probabilidad de usar la AP fue mayor en los grupos más desfavorecidos, mientras que en la AE se observa la tendencia contraria. Las desigualdades en la AE aumentaron durante la recesión, pero ello no puede atribuirse a factores de necesidad.
ConclusionesLa tendencia de la utilización de los servicios sanitarios cambió en la Gran Recesión. Existen desigualdades en la utilización de servicios sanitarios en España, que han aumentado en AE durante el periodo de crisis y poscrisis. Es necesario considerar los factores socioeconómicos en planificación sanitaria con el fin de lograr la equidad.
Health inequalities have their origin in the political, economic and social context of a society.1 These inequalities affect not only the health status of individuals and communities, but also the use of health care services. Several studies have demonstrated that health services utilization differs by social group. Primary care (PC) is mainly used by the lowest social classes, while secondary care (SC) utilization is more frequent in high classes.2,3 The existence of access barriers to health services, mainly in SC, such as increasing waiting times, lack of health literacy and reduction of available resources, are some of the main factors involved in the existence of a social gradient in the use of health care services.4,5
From 2008 to 2014 almost all European countries were affected by an economic recession.6 Public debt rose rapidly, as did unemployment.7 European governments implemented austerity policies in different areas, such as health care.6,8 This led to situations, such as having to decide in a family between spending on health care or food, prioritizing the latter.7,8 In Spain, one of the countries most affected by the Great Recession, austerity policies such as pharmaceutical co-payment or the closure of hospital beds, among others,7,9 were implemented to limit spending on health.7,9 This economic context had a direct and indirect impact on both health and the use of health systems, especially in some vulnerable groups10 such as ethnic minorities, children,11 the young and the elderly,2 among others.12 Now, it is widely asserted that the economic recession is over,13 but there remains doubt as to whether it has really ended or, on the contrary, the population has learned to live in a negative context.14 The population that became accustomed to living with fewer resources gave rise to the phenomenon of a group known as “the children of the crisis”. The economic status and health of these people are adversely affected throughout their lives, aspects which worsen due to a lack of related governmental policies.5,15
Several studies have been carried out to analyze the effect of the Great Recession on the population's health.16,17 There are also some studies that explore the impact of economic recession on the use of health services.7,12,18 In this context, the objective of our study is to analyze the evolution of inequalities in health care service utilization in Spain and the impact of the Great Recession on these inequalities.
MethodWe used a repeated cross-sectional study design. Data were obtained from Spanish National Health Surveys (NHS) conducted in 2001, 2003, 2006, 2011, and 2017 and Spanish European Health Interview Survey (EHIS) in 2014. The economic recession period is split into three, with three surveys before (2001,2003, 2006), two during (2011, 2014) and one post-recession period (2017). NHS and EHIS are representative surveys, with a stratified multistage design. They were performed by means of personal interview among a non-institutionalized population from 15 years old. Therefore, in order to homogenize the sample in this study, only those over 16 were included in the analysis. Seasonal effect was avoided by including autumnal months in the sample collection.19,20 The methodology applied allows comparability between surveys. Sample sizes ranged from 21,067 in 2001, 22,575 in 2003, 29,478 in 2006, 20,884 in 2011, 22,659 in 2014 and 22,903 in 2017, with a total sample size of 139,566 subjects. The 2009 EHIS was not included in this study because of the different collection methods of some key variables, such as social class and level of education which made it incomparable with the other surveys. More information about data sources can be consulted in the reference section.21
Variables included in the studyTo analyze healthcare utilization during the study period, two levels of healthcare services were considered: PC and SC, both in the private and public sector. To ascertain the use of PC, the following question was used: “In the last two weeks, have you consulted a family doctor for any problems, discomfort or illness?”. Information about the use of SC was obtained from the question: “In the last four weeks, have you consulted a specialist doctor about any problems, discomfort or illness?”.
In order to determine socioeconomic characteristics of the subjects, three variables were used: social class, educational level and employment status. These variables are the most commonly used in public health studies in order to identify health inequalities.22 Social class was obtained from the social class of the household's main supporter. It was classified into manual and non-manual, from the 2011 National Classification of Occupations.23 Educational level was classified into three categories according to the International Standard Classification of Education (ISCED):24 low (primary studies: ISCED 0-1), medium (secondary education: ISCED 2, 3, and 4), and high educational level (higher education and university studies, ISCED 5 and 6). Employment status was obtained through the profession or trade that the surveyed person performed in the last job, and was classified into five categories: workers (paid work), the unemployed, students, pensioners (retired persons and those who receive some kind of pension) and those doing unpaid household labor. Andersen's model originally included educational level in occupation as a component of predisposing characteristics, but it can also be considered as an influential enabling variable, as we have done in this study.
Finally, we included the variables of the Andersen's Model of Demand for care,25 a theoretical framework widely used to analyze health care service utilization.12 It classifies the determinants of healthcare use into three groups: predisposing factors (age and sex); factors of need (self-rated health, chronic disease/disorder, limitation of physical activity in the last 6 months and limitation during the last two weeks to perform everyday activities due to pain or any other symptom); and factors that facilitate access and use of health care (personal and/or family characteristics that may influence the use of health services: employment status, social class, educational level, marital status, tobacco consumption and health insurance model) (see Table I in online Appendix).
All the variables were collected in all surveys in the same way, which allows comparability across time.21 Included in the analyses were data regarding chronic diseases: high blood pressure, hypercholesterolemia, heart disease, bronchitis, stomach ulcer, allergy and depression, that had been collected in the six surveys.
Statistical analysisFirst, a descriptive study of the socioeconomic characteristics of the sample was carried out. Prevalence with their 95% confidence intervals (95%CI) were calculated. Then, the estimated prevalence of healthcare services utilization (PC and SC) was calculated according to socioeconomic indicators. Trend analyses (chi-square for trend) were performed in order to observe the evolution of health services use during the study period. All the analyses were stratified by sex and standardized by age to guarantee data comparability, taking year 2001 as reference (first year of study). In order to facilitate readability, only the results of the first and last survey were presented.
Secondly, to study the influence of socioeconomic factors on the use of healthcare services, logistic regression analyses, stratified by sex, were carried out. We pooled data into three periods: pre-recession (2001, 2003 and 2006 surveys), recession (2011 and 2014 surveys) and post-recession (2017 survey). Although the economic recovery started in 2014,13 in this survey it has been considered as a “crisis year”. This is because data collection in that year started in January,21 and because health spending, mainly for PC, did not increase for all the Autonomous Communities.26 Two models were employed: a first model (model 1) adjusted by age, and a second model (model 2) adjusted by the variables included in the Andersen's Model of Demand. The adjustment by Andersen's Model allowed isolation of the role of socioeconomic factors in the use of health care services, after controlling by characteristics that have been strongly associated with subject utilization. Finally, the C statistic (area under the ROC curve) was calculated to know the predictive capacity of the models, where 1 indicates perfect prediction and 0.5 indicate a low predictive capacity.
All the analyses were done using the weighting factors that each survey provided, to avoid errors associated with survey design or bias associated with no response. All tests were considered significant when p<0.05. Analyses were performed with IBM SPSS Statistics 19®, Stata 14® and RStudio. Ethical approval was not required due to the public and anonymous characteristics of micro-data.
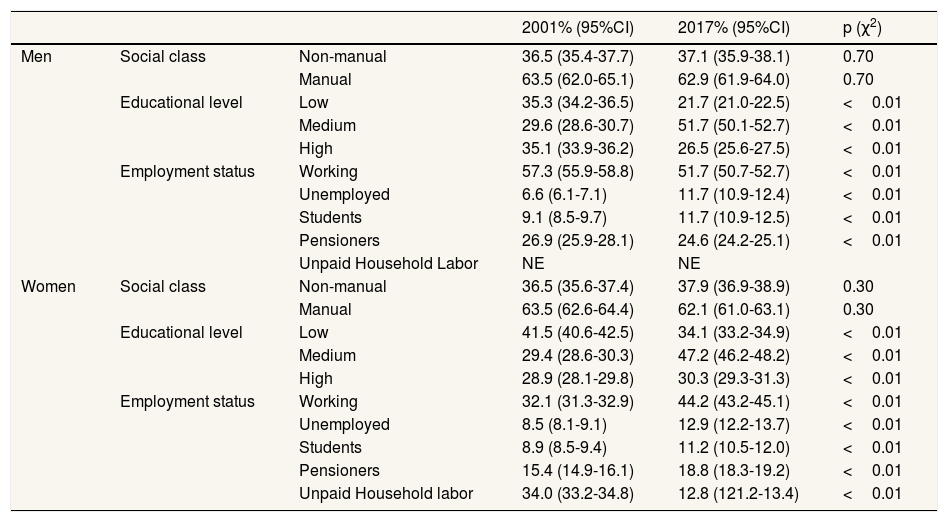
ResultsEvolution of socioeconomic characteristicsEducational level improved from 2001 to 2017 in men and women, with an important increase in the number of people with medium studies (Table 1). High educational level decreased in men (35.1 vs. 26.5%), but increased in women (28.9% vs. 30.3%). Regarding employment status, an important increase in the prevalence of unemployment was observed in men (6.6% vs. 11.7%). In women, the most important changes were the significant increase in working women (32.1% vs. 44.2%) and the reduction of women whose main occupation was unpaid household labor (34.0% vs. 12.8%). Social class did not vary for the study period, with a majority of manual workers (60%).
Percentage of Spanish population by social class, educational level and employment status with their 95% confidence interval (Spain, 2001-2017). Results standardized by age and weighted.
| 2001% (95%CI) | 2017% (95%CI) | p (χ2) | |||
|---|---|---|---|---|---|
| Men | Social class | Non-manual | 36.5 (35.4-37.7) | 37.1 (35.9-38.1) | 0.70 |
| Manual | 63.5 (62.0-65.1) | 62.9 (61.9-64.0) | 0.70 | ||
| Educational level | Low | 35.3 (34.2-36.5) | 21.7 (21.0-22.5) | <0.01 | |
| Medium | 29.6 (28.6-30.7) | 51.7 (50.1-52.7) | <0.01 | ||
| High | 35.1 (33.9-36.2) | 26.5 (25.6-27.5) | <0.01 | ||
| Employment status | Working | 57.3 (55.9-58.8) | 51.7 (50.7-52.7) | <0.01 | |
| Unemployed | 6.6 (6.1-7.1) | 11.7 (10.9-12.4) | <0.01 | ||
| Students | 9.1 (8.5-9.7) | 11.7 (10.9-12.5) | <0.01 | ||
| Pensioners | 26.9 (25.9-28.1) | 24.6 (24.2-25.1) | <0.01 | ||
| Unpaid Household Labor | NE | NE | |||
| Women | Social class | Non-manual | 36.5 (35.6-37.4) | 37.9 (36.9-38.9) | 0.30 |
| Manual | 63.5 (62.6-64.4) | 62.1 (61.0-63.1) | 0.30 | ||
| Educational level | Low | 41.5 (40.6-42.5) | 34.1 (33.2-34.9) | <0.01 | |
| Medium | 29.4 (28.6-30.3) | 47.2 (46.2-48.2) | <0.01 | ||
| High | 28.9 (28.1-29.8) | 30.3 (29.3-31.3) | <0.01 | ||
| Employment status | Working | 32.1 (31.3-32.9) | 44.2 (43.2-45.1) | <0.01 | |
| Unemployed | 8.5 (8.1-9.1) | 12.9 (12.2-13.7) | <0.01 | ||
| Students | 8.9 (8.5-9.4) | 11.2 (10.5-12.0) | <0.01 | ||
| Pensioners | 15.4 (14.9-16.1) | 18.8 (18.3-19.2) | <0.01 | ||
| Unpaid Household labor | 34.0 (33.2-34.8) | 12.8 (121.2-13.4) | <0.01 |
95%CI: 95% confidence interval; NE: not evaluable (low number of subjects).
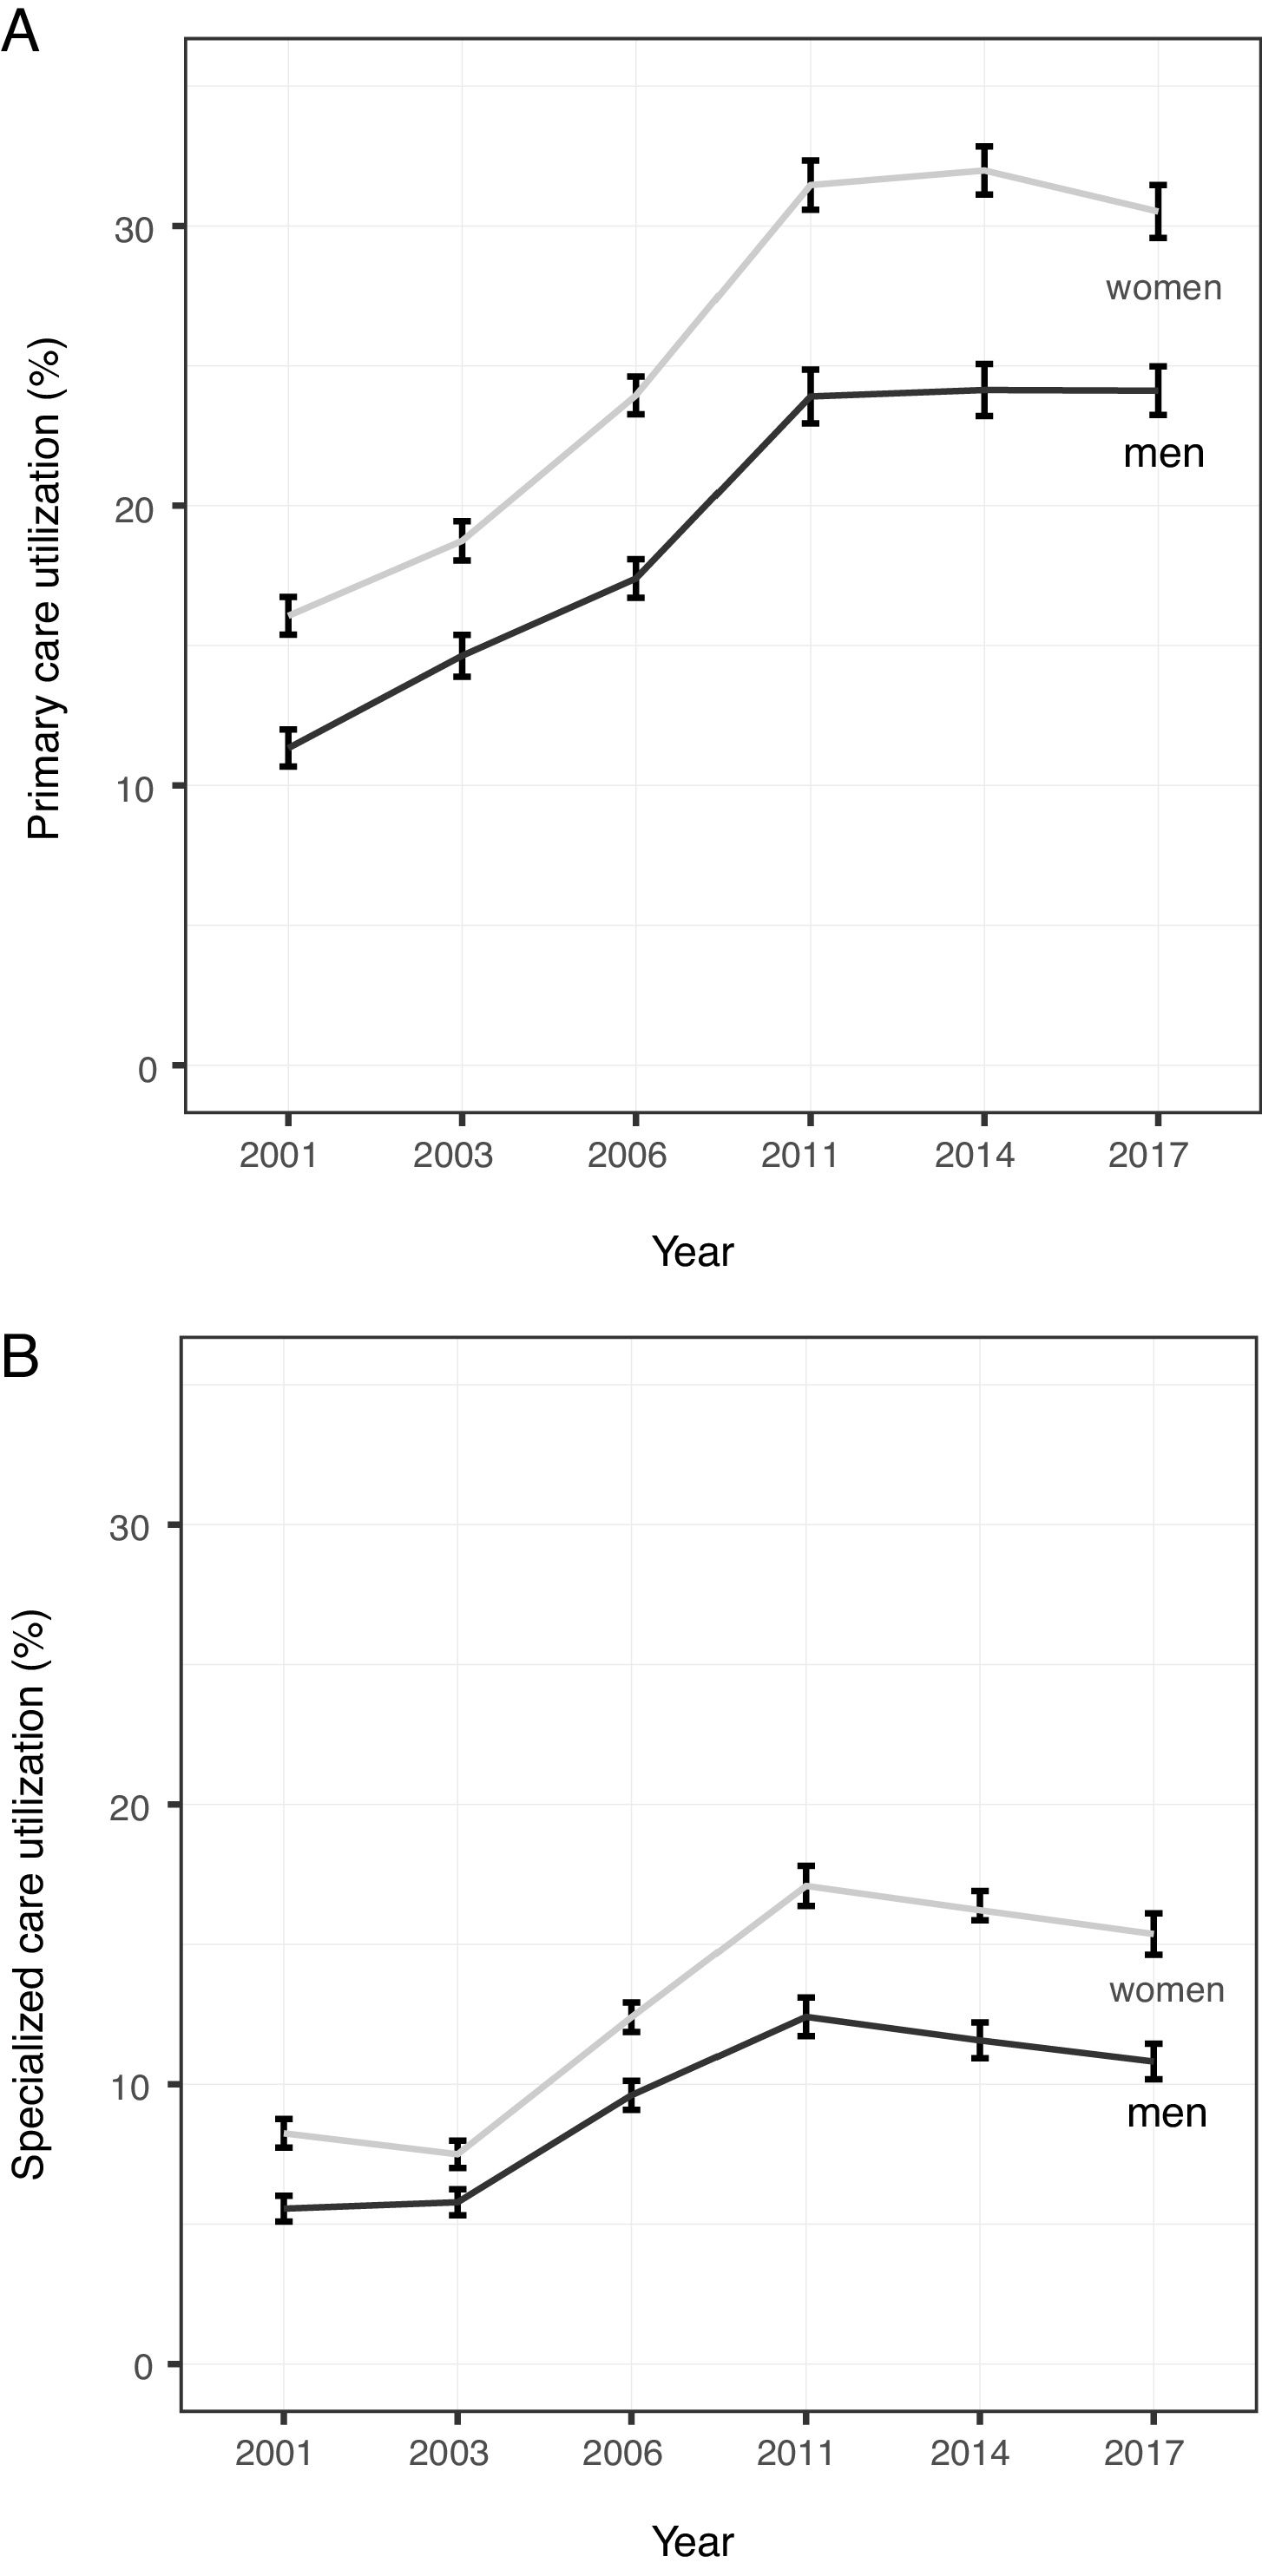
The use of PC and SC increased throughout the period analyzed, with a higher utilization in women. PC use (Fig. 1A) increased from 16.1 in 2001 to 30.1 in 2017 in women (slope 0.00999, p <0.001). SC utilization (Fig. 1B) also increased from 8.2 to 15.4 in 2017 in women (slope: 0.00577; p <0.001). This increase was not linear. There was an important increase in the use of PC and SC from 2001 to 2011, a plateau during the recession and a slow decrease, mainly for SC, in the post-recession period. This trend was similar for both sexes, with an increasing gap between women and men for both PC and SC levels of use.

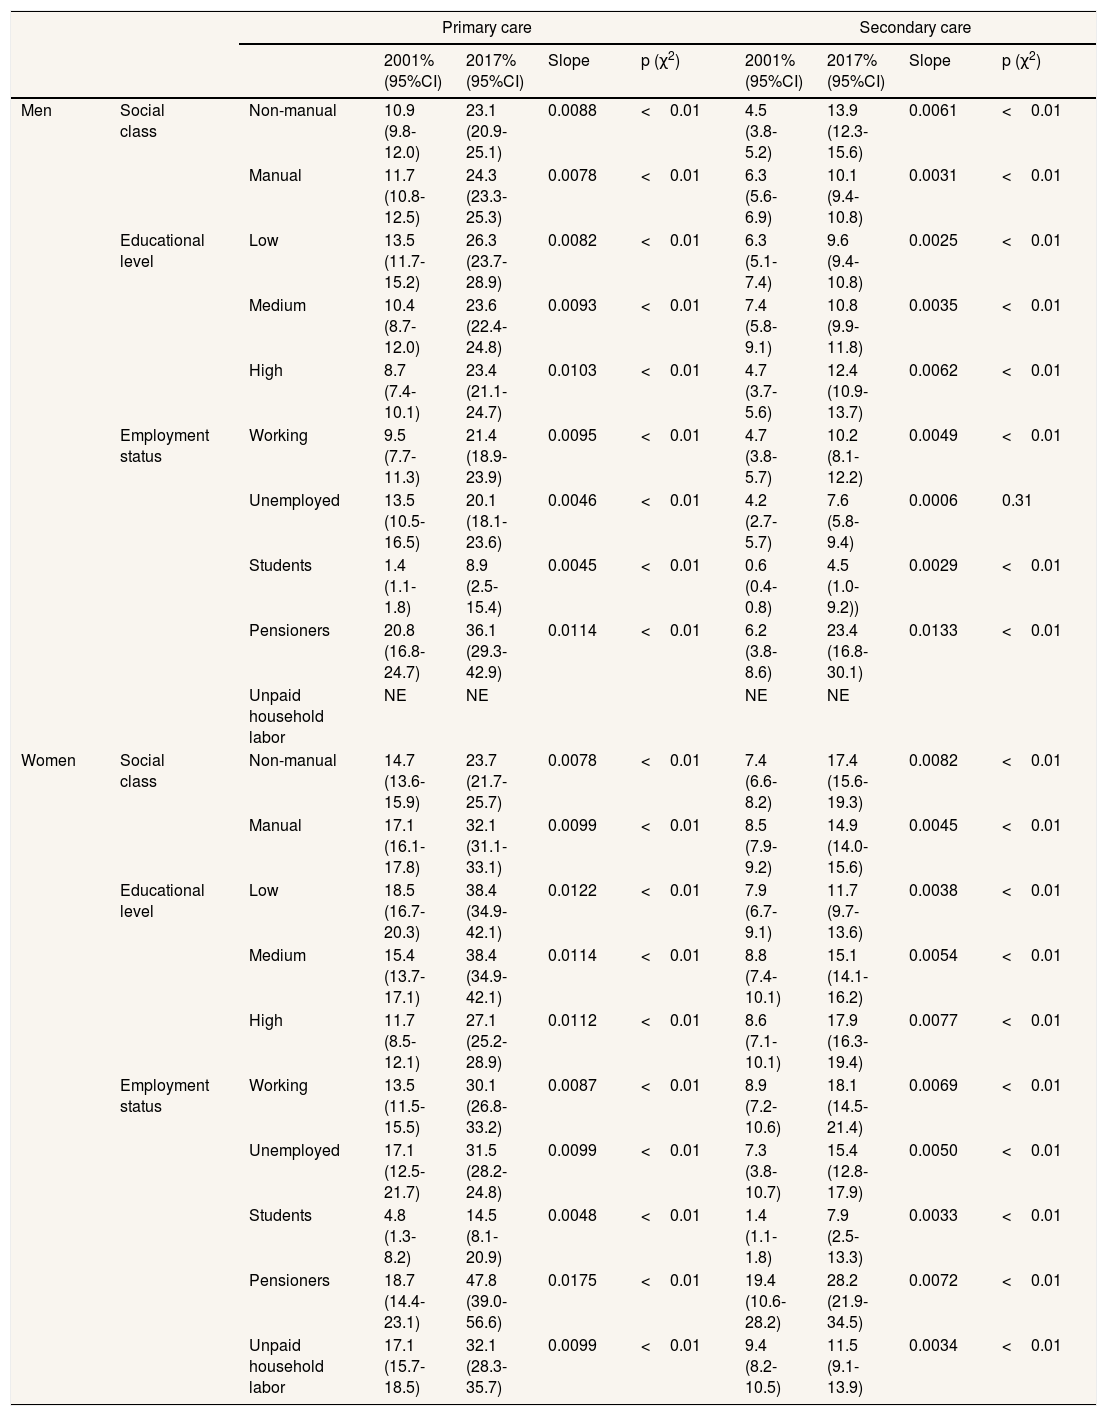
When the use of PC was analyzed by socioeconomic determinants (Table 2), it was observed that utilization doubled for the period 2001-2017 for all the categories considered. Some categories showed an even higher increase, such as in the PC utilization amongst men with high educational level (2001: 8.7, 95%CI: 7.4-10.1 vs. 2017: 23.4, 95%CI: 21.1-24.7) and students (men 2001: 1.4, 95%CI: 1.1-1.8 vs. 2017: 8.9, 95%CI: 2.5-15.4; women 2001: 4.8, 95%CI: 1.3-8.2 vs. 2017: 14.5, 95%CI: 8.1-20.9). In men, the gap in the use of PC between those of low and high educational level disappeared. On the other hand, the existing gap between male workers (2001: 9.5, 95%CI: 7.7-11.3 vs. 2017: 21.4, 95%CI: 18.9-23.9) and pensioners (2001: 20.8, 95%CI: 16.8-24.7 vs. 2017: 36.1, 95%CI: 29.3-42.9) increased. In women, the socioeconomic gap persisted between social classes and between those of low and high educational level. Regarding employment status, statistically significant differences were found among workers (2001: 13.5, 95%CI: 11.5-15.5 vs. 2017: 30.1, 95%CI: 26.8-33.2) and the rest of the categories, with the lowest utilization being in students (2001: 4.8, 95%CI: 1.3-8.2 vs. 2017: 14.5, 95%CI: 8.1-20.9) and the highest among pensioners (2001:18.7, 95%CI: 14.4-23.1 vs. 2017: 47.8, 95%CI: 39.0-56.6).
Use of primary care and secondary care in men and women according to social class, educational level and employment status (Spain 2001-2017). Results standardized by age and weighted.
| Primary care | Secondary care | |||||||||
|---|---|---|---|---|---|---|---|---|---|---|
| 2001% (95%CI) | 2017% (95%CI) | Slope | p (χ2) | 2001% (95%CI) | 2017% (95%CI) | Slope | p (χ2) | |||
| Men | Social class | Non-manual | 10.9 (9.8-12.0) | 23.1 (20.9-25.1) | 0.0088 | <0.01 | 4.5 (3.8-5.2) | 13.9 (12.3-15.6) | 0.0061 | <0.01 |
| Manual | 11.7 (10.8-12.5) | 24.3 (23.3-25.3) | 0.0078 | <0.01 | 6.3 (5.6-6.9) | 10.1 (9.4-10.8) | 0.0031 | <0.01 | ||
| Educational level | Low | 13.5 (11.7-15.2) | 26.3 (23.7-28.9) | 0.0082 | <0.01 | 6.3 (5.1-7.4) | 9.6 (9.4-10.8) | 0.0025 | <0.01 | |
| Medium | 10.4 (8.7-12.0) | 23.6 (22.4-24.8) | 0.0093 | <0.01 | 7.4 (5.8-9.1) | 10.8 (9.9-11.8) | 0.0035 | <0.01 | ||
| High | 8.7 (7.4-10.1) | 23.4 (21.1-24.7) | 0.0103 | <0.01 | 4.7 (3.7-5.6) | 12.4 (10.9-13.7) | 0.0062 | <0.01 | ||
| Employment status | Working | 9.5 (7.7-11.3) | 21.4 (18.9-23.9) | 0.0095 | <0.01 | 4.7 (3.8-5.7) | 10.2 (8.1-12.2) | 0.0049 | <0.01 | |
| Unemployed | 13.5 (10.5-16.5) | 20.1 (18.1-23.6) | 0.0046 | <0.01 | 4.2 (2.7-5.7) | 7.6 (5.8-9.4) | 0.0006 | 0.31 | ||
| Students | 1.4 (1.1-1.8) | 8.9 (2.5-15.4) | 0.0045 | <0.01 | 0.6 (0.4-0.8) | 4.5 (1.0-9.2)) | 0.0029 | <0.01 | ||
| Pensioners | 20.8 (16.8-24.7) | 36.1 (29.3-42.9) | 0.0114 | <0.01 | 6.2 (3.8-8.6) | 23.4 (16.8-30.1) | 0.0133 | <0.01 | ||
| Unpaid household labor | NE | NE | NE | NE | ||||||
| Women | Social class | Non-manual | 14.7 (13.6-15.9) | 23.7 (21.7-25.7) | 0.0078 | <0.01 | 7.4 (6.6-8.2) | 17.4 (15.6-19.3) | 0.0082 | <0.01 |
| Manual | 17.1 (16.1-17.8) | 32.1 (31.1-33.1) | 0.0099 | <0.01 | 8.5 (7.9-9.2) | 14.9 (14.0-15.6) | 0.0045 | <0.01 | ||
| Educational level | Low | 18.5 (16.7-20.3) | 38.4 (34.9-42.1) | 0.0122 | <0.01 | 7.9 (6.7-9.1) | 11.7 (9.7-13.6) | 0.0038 | <0.01 | |
| Medium | 15.4 (13.7-17.1) | 38.4 (34.9-42.1) | 0.0114 | <0.01 | 8.8 (7.4-10.1) | 15.1 (14.1-16.2) | 0.0054 | <0.01 | ||
| High | 11.7 (8.5-12.1) | 27.1 (25.2-28.9) | 0.0112 | <0.01 | 8.6 (7.1-10.1) | 17.9 (16.3-19.4) | 0.0077 | <0.01 | ||
| Employment status | Working | 13.5 (11.5-15.5) | 30.1 (26.8-33.2) | 0.0087 | <0.01 | 8.9 (7.2-10.6) | 18.1 (14.5-21.4) | 0.0069 | <0.01 | |
| Unemployed | 17.1 (12.5-21.7) | 31.5 (28.2-24.8) | 0.0099 | <0.01 | 7.3 (3.8-10.7) | 15.4 (12.8-17.9) | 0.0050 | <0.01 | ||
| Students | 4.8 (1.3-8.2) | 14.5 (8.1-20.9) | 0.0048 | <0.01 | 1.4 (1.1-1.8) | 7.9 (2.5-13.3) | 0.0033 | <0.01 | ||
| Pensioners | 18.7 (14.4-23.1) | 47.8 (39.0-56.6) | 0.0175 | <0.01 | 19.4 (10.6-28.2) | 28.2 (21.9-34.5) | 0.0072 | <0.01 | ||
| Unpaid household labor | 17.1 (15.7-18.5) | 32.1 (28.3-35.7) | 0.0099 | <0.01 | 9.4 (8.2-10.5) | 11.5 (9.1-13.9) | 0.0034 | <0.01 | ||
95%CI: 95% confidence interval; NE: not evaluable (low number of subjects).
SC utilization also increased from 2001 to 2017 (Table 2). This increase was more marked for male pensioners (2001: 6.2, 95%CI: 3.8-8.6 vs. 2017: 23.4, 95%CI: 16.8-30.1). With regard to educational level, men having a low educational level showed lower utilization of SC (2001: 6.3, 95%CI: 5.1-7.4, 2017: 9.6, 95%CI: 9.4-10.8) than those with middle and high educational level. Women with low educational level presented with a lower SC utilization than those with medium and high educational level, with an increasing educational gap. Regarding employment, pensioners showed the highest prevalence of SC utilization for both sexes (men 2017: 23.4, 95%CI: 16.8-30.1; women 2017: 28.2, 95%CI: 21.9-34.5).
In all groups studied and for both health care levels, with the only exception of unemployed men in SC (p=0.31), trend analyses showed a statistically significant increase (p <0.001).
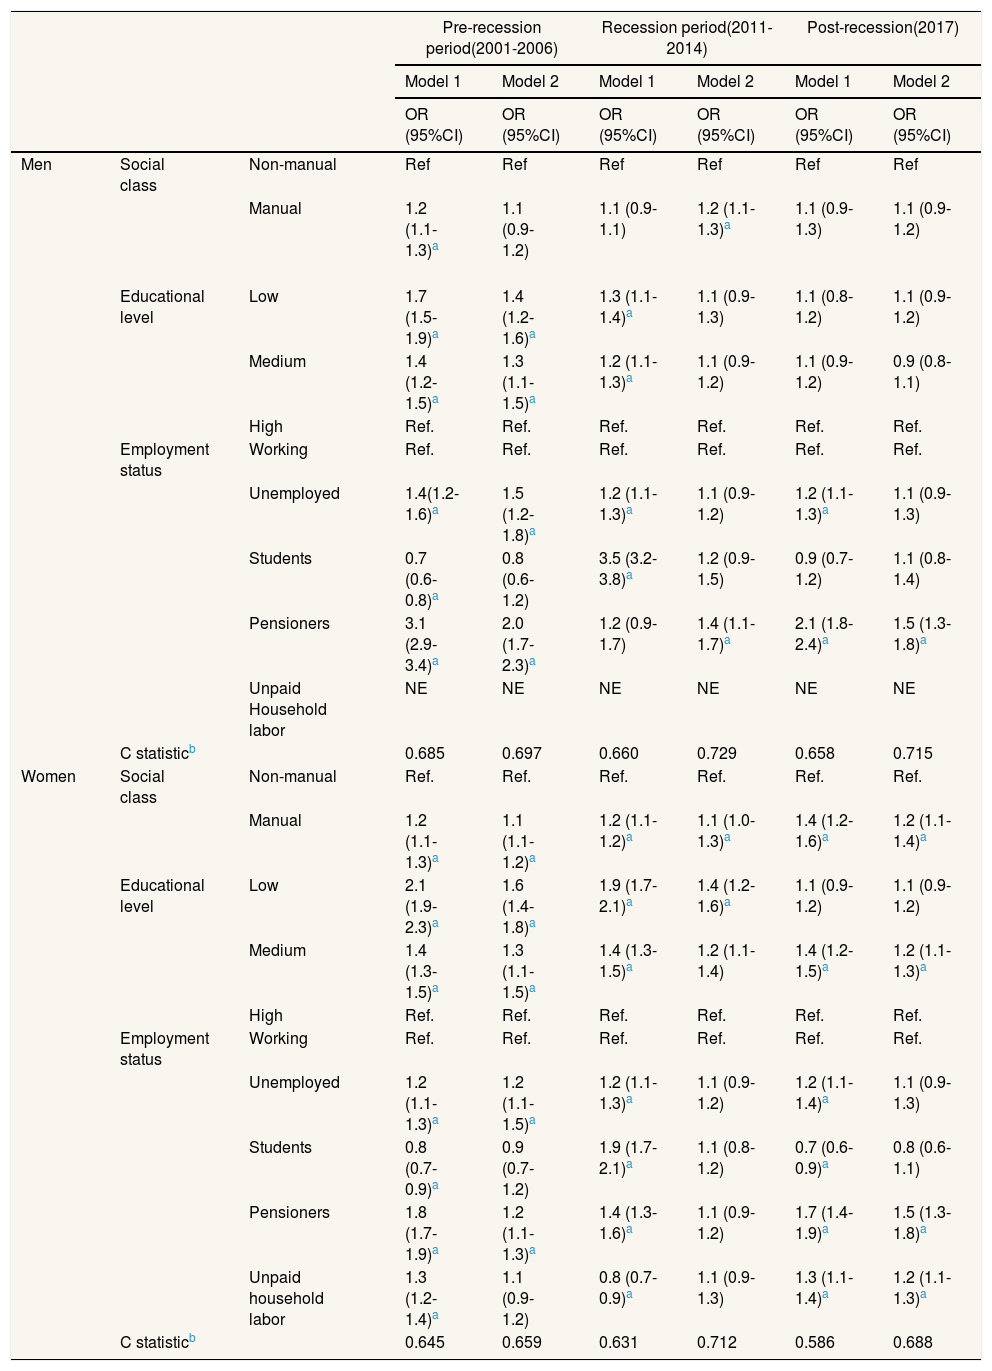
Economic recession influence on the use of primary care and secondary care according to socioeconomic variablesTable 3 shows the influence of socioeconomic determinants in PC utilization before, during and after economic recession. In men before the recession, people with low and medium educational level had a higher probability of PC utilization, taking as reference those with high educational level. In the same way, unemployed people and pensioners showed a higher probability of PC utilization than workers. During the recession, manual workers (reference category: non-manual) and pensioners (reference category: workers) had a higher probability of PC use, independent of their level of need. For women, in the pre-recession period, there was a greater probability of using PC in manual workers than in non-manual, those with low and medium educational level (reference category: high studies), the unemployed and pensioners (reference category: workers). This employment effect was lost during the recession period. Regarding the post-recession period (2017), the pattern of PC use was similar to the previous period. In men, the probability of use was higher in pensioners than in workers. In women this association was also observed, as well as a higher likelihood of PC use in manual workers (reference category: non-manual), those doing unpaid household labor (reference category: workers) and women with a low educational level (reference category: high studies)
Odds ratios and their 95% confidence intervals of primary care use by social class, educational level and employment status, stratified by sex. Comparison of the pre-recession (2001-2006), recession period (2011-2014), and post- recession period (2017).
| Pre-recession period(2001-2006) | Recession period(2011-2014) | Post-recession(2017) | ||||||
|---|---|---|---|---|---|---|---|---|
| Model 1 | Model 2 | Model 1 | Model 2 | Model 1 | Model 2 | |||
| OR (95%CI) | OR (95%CI) | OR (95%CI) | OR (95%CI) | OR (95%CI) | OR (95%CI) | |||
| Men | Social class | Non-manual | Ref | Ref | Ref | Ref | Ref | Ref |
| Manual | 1.2 (1.1-1.3)a | 1.1 (0.9-1.2) | 1.1 (0.9-1.1) | 1.2 (1.1-1.3)a | 1.1 (0.9-1.3) | 1.1 (0.9-1.2) | ||
| Educational level | Low | 1.7 (1.5-1.9)a | 1.4 (1.2-1.6)a | 1.3 (1.1-1.4)a | 1.1 (0.9-1.3) | 1.1 (0.8-1.2) | 1.1 (0.9-1.2) | |
| Medium | 1.4 (1.2-1.5)a | 1.3 (1.1-1.5)a | 1.2 (1.1-1.3)a | 1.1 (0.9-1.2) | 1.1 (0.9-1.2) | 0.9 (0.8-1.1) | ||
| High | Ref. | Ref. | Ref. | Ref. | Ref. | Ref. | ||
| Employment status | Working | Ref. | Ref. | Ref. | Ref. | Ref. | Ref. | |
| Unemployed | 1.4(1.2-1.6)a | 1.5 (1.2-1.8)a | 1.2 (1.1-1.3)a | 1.1 (0.9-1.2) | 1.2 (1.1-1.3)a | 1.1 (0.9-1.3) | ||
| Students | 0.7 (0.6-0.8)a | 0.8 (0.6-1.2) | 3.5 (3.2-3.8)a | 1.2 (0.9-1.5) | 0.9 (0.7-1.2) | 1.1 (0.8-1.4) | ||
| Pensioners | 3.1 (2.9-3.4)a | 2.0 (1.7-2.3)a | 1.2 (0.9-1.7) | 1.4 (1.1-1.7)a | 2.1 (1.8-2.4)a | 1.5 (1.3-1.8)a | ||
| Unpaid Household labor | NE | NE | NE | NE | NE | NE | ||
| C statisticb | 0.685 | 0.697 | 0.660 | 0.729 | 0.658 | 0.715 | ||
| Women | Social class | Non-manual | Ref. | Ref. | Ref. | Ref. | Ref. | Ref. |
| Manual | 1.2 (1.1-1.3)a | 1.1 (1.1-1.2)a | 1.2 (1.1-1.2)a | 1.1 (1.0-1.3)a | 1.4 (1.2-1.6)a | 1.2 (1.1-1.4)a | ||
| Educational level | Low | 2.1 (1.9-2.3)a | 1.6 (1.4-1.8)a | 1.9 (1.7-2.1)a | 1.4 (1.2-1.6)a | 1.1 (0.9-1.2) | 1.1 (0.9-1.2) | |
| Medium | 1.4 (1.3-1.5)a | 1.3 (1.1-1.5)a | 1.4 (1.3-1.5)a | 1.2 (1.1-1.4) | 1.4 (1.2-1.5)a | 1.2 (1.1-1.3)a | ||
| High | Ref. | Ref. | Ref. | Ref. | Ref. | Ref. | ||
| Employment status | Working | Ref. | Ref. | Ref. | Ref. | Ref. | Ref. | |
| Unemployed | 1.2 (1.1-1.3)a | 1.2 (1.1-1.5)a | 1.2 (1.1-1.3)a | 1.1 (0.9-1.2) | 1.2 (1.1-1.4)a | 1.1 (0.9-1.3) | ||
| Students | 0.8 (0.7-0.9)a | 0.9 (0.7-1.2) | 1.9 (1.7-2.1)a | 1.1 (0.8-1.2) | 0.7 (0.6-0.9)a | 0.8 (0.6-1.1) | ||
| Pensioners | 1.8 (1.7-1.9)a | 1.2 (1.1-1.3)a | 1.4 (1.3-1.6)a | 1.1 (0.9-1.2) | 1.7 (1.4-1.9)a | 1.5 (1.3-1.8)a | ||
| Unpaid household labor | 1.3 (1.2-1.4)a | 1.1 (0.9-1.2) | 0.8 (0.7-0.9)a | 1.1 (0.9-1.3) | 1.3 (1.1-1.4)a | 1.2 (1.1-1.3)a | ||
| C statisticb | 0.645 | 0.659 | 0.631 | 0.712 | 0.586 | 0.688 | ||
95%CI: 95% confidence interval; NE: not evaluable (low number of subjects); OR: odds ratio; Ref.: reference category.
Area under the curve ROC.
Model 1 adjusted by age. Model 2 adjusted by age and by the variables of Andersen's Model for care (self-rated health, chronic disease/disorder, limitation of physical activity in the last 6 months and limitation during the last two weeks to perform usual activities due to pain or any other symptom, employment status, social class, educational level, marital status, tobacco consumption and health insurance model).
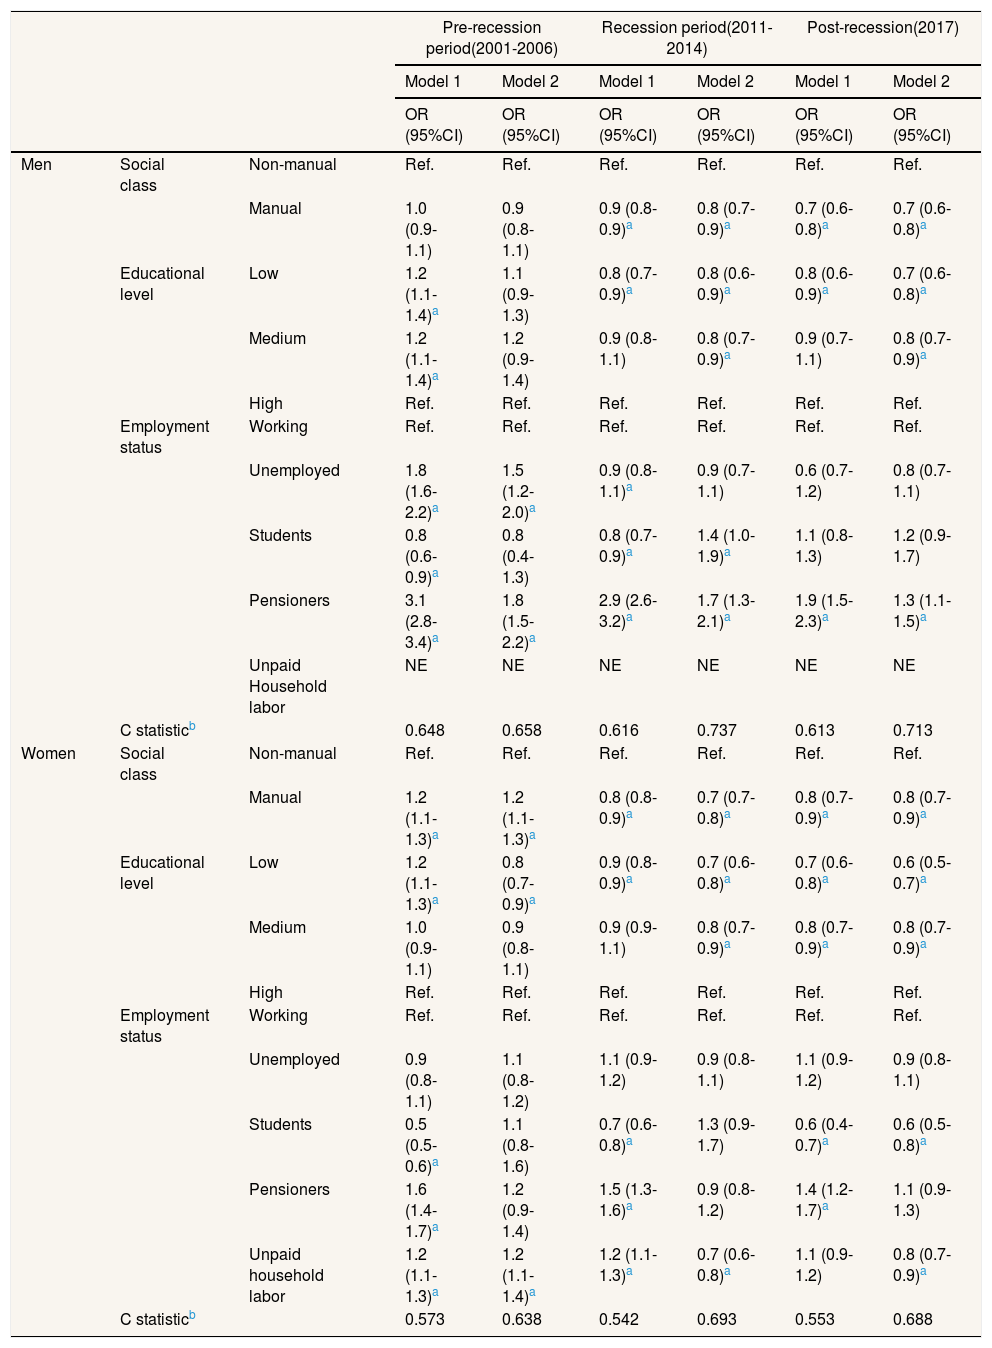
For SC utilization (Table 4), unemployed men and pensioners had, in the pre-recession years, a higher probability of SC use than workers, being the only socioeconomic indicator with statistical differences after adjusting by the Andersen's Model. In women manual workers (ref. non-manual workers) and those doing unpaid household labor (ref. workers) showed a higher probability of SC use, while women with low educational level presented a lower likelihood of SC use than women with high level. During the recession period, inequalities increased for the use of SC, after adjusting for need. Manual workers (ref. non-manual workers) and those with a lower level of education (ref. high studies) showed a lower probability of utilization of SC, each having the same level of need. According to data observed in the post-recession period, association was similar to those observed for the recession period for both sexes.
Odds ratios and their 95% confidence intervals of secondary care use by social class, educational level and employment status, stratified by sex. Comparison of the pre-recession (2001-2006), recession period (2011-2014) and post-recession period (2017).
| Pre-recession period(2001-2006) | Recession period(2011-2014) | Post-recession(2017) | ||||||
|---|---|---|---|---|---|---|---|---|
| Model 1 | Model 2 | Model 1 | Model 2 | Model 1 | Model 2 | |||
| OR (95%CI) | OR (95%CI) | OR (95%CI) | OR (95%CI) | OR (95%CI) | OR (95%CI) | |||
| Men | Social class | Non-manual | Ref. | Ref. | Ref. | Ref. | Ref. | Ref. |
| Manual | 1.0 (0.9-1.1) | 0.9 (0.8-1.1) | 0.9 (0.8-0.9)a | 0.8 (0.7-0.9)a | 0.7 (0.6-0.8)a | 0.7 (0.6-0.8)a | ||
| Educational level | Low | 1.2 (1.1-1.4)a | 1.1 (0.9-1.3) | 0.8 (0.7-0.9)a | 0.8 (0.6-0.9)a | 0.8 (0.6-0.9)a | 0.7 (0.6-0.8)a | |
| Medium | 1.2 (1.1-1.4)a | 1.2 (0.9-1.4) | 0.9 (0.8-1.1) | 0.8 (0.7-0.9)a | 0.9 (0.7-1.1) | 0.8 (0.7-0.9)a | ||
| High | Ref. | Ref. | Ref. | Ref. | Ref. | Ref. | ||
| Employment status | Working | Ref. | Ref. | Ref. | Ref. | Ref. | Ref. | |
| Unemployed | 1.8 (1.6-2.2)a | 1.5 (1.2-2.0)a | 0.9 (0.8-1.1)a | 0.9 (0.7-1.1) | 0.6 (0.7-1.2) | 0.8 (0.7-1.1) | ||
| Students | 0.8 (0.6-0.9)a | 0.8 (0.4-1.3) | 0.8 (0.7-0.9)a | 1.4 (1.0-1.9)a | 1.1 (0.8-1.3) | 1.2 (0.9-1.7) | ||
| Pensioners | 3.1 (2.8-3.4)a | 1.8 (1.5-2.2)a | 2.9 (2.6-3.2)a | 1.7 (1.3-2.1)a | 1.9 (1.5-2.3)a | 1.3 (1.1-1.5)a | ||
| Unpaid Household labor | NE | NE | NE | NE | NE | NE | ||
| C statisticb | 0.648 | 0.658 | 0.616 | 0.737 | 0.613 | 0.713 | ||
| Women | Social class | Non-manual | Ref. | Ref. | Ref. | Ref. | Ref. | Ref. |
| Manual | 1.2 (1.1-1.3)a | 1.2 (1.1-1.3)a | 0.8 (0.8-0.9)a | 0.7 (0.7-0.8)a | 0.8 (0.7-0.9)a | 0.8 (0.7-0.9)a | ||
| Educational level | Low | 1.2 (1.1-1.3)a | 0.8 (0.7-0.9)a | 0.9 (0.8-0.9)a | 0.7 (0.6-0.8)a | 0.7 (0.6-0.8)a | 0.6 (0.5-0.7)a | |
| Medium | 1.0 (0.9-1.1) | 0.9 (0.8-1.1) | 0.9 (0.9-1.1) | 0.8 (0.7-0.9)a | 0.8 (0.7-0.9)a | 0.8 (0.7-0.9)a | ||
| High | Ref. | Ref. | Ref. | Ref. | Ref. | Ref. | ||
| Employment status | Working | Ref. | Ref. | Ref. | Ref. | Ref. | Ref. | |
| Unemployed | 0.9 (0.8-1.1) | 1.1 (0.8-1.2) | 1.1 (0.9-1.2) | 0.9 (0.8-1.1) | 1.1 (0.9-1.2) | 0.9 (0.8-1.1) | ||
| Students | 0.5 (0.5-0.6)a | 1.1 (0.8-1.6) | 0.7 (0.6-0.8)a | 1.3 (0.9-1.7) | 0.6 (0.4-0.7)a | 0.6 (0.5-0.8)a | ||
| Pensioners | 1.6 (1.4-1.7)a | 1.2 (0.9-1.4) | 1.5 (1.3-1.6)a | 0.9 (0.8-1.2) | 1.4 (1.2-1.7)a | 1.1 (0.9-1.3) | ||
| Unpaid household labor | 1.2 (1.1-1.3)a | 1.2 (1.1-1.4)a | 1.2 (1.1-1.3)a | 0.7 (0.6-0.8)a | 1.1 (0.9-1.2) | 0.8 (0.7-0.9)a | ||
| C statisticb | 0.573 | 0.638 | 0.542 | 0.693 | 0.553 | 0.688 | ||
95%CI: 95% confidence interval; NE: not evaluable (low number of subjects); OR: odds ratio; Ref.: reference category.
Area under the curve ROC.
Model 1 adjusted by age. Model 2 adjusted by age and by the variables of Andersen's Model for care (self-rated health, chronic disease/disorder, limitation of physical activity in the last 6 months and limitation during the last two weeks to perform usual activities due to pain or any other symptom, employment status, social class, educational level, marital status, tobacco consumption and health insurance model).
C statistic showed a fair explanatory capacity of the models developed. The regression models conducted for the recession period had greater explanatory power than pre and post-recession models. The explanatory capacity of the model was higher for men than for women, and similar for both health care levels. Full models are available in Tables II and III in online Appendix.
DiscussionIn Spain, from 2001 to 2017, there was a change in the use of health services. The increase observed in the pre-recession period led to a plateau during the recession and a decrease in the post-recession period, which was more marked in SC. This trend existed for both sexes, with a higher utilization in women and an increase in the gender gap. Socioeconomic differences in the use of PC and SC were observed for all the socioeconomic indicators used, and persisted even after adjusting for factors of need. These socioeconomic differences increased for SC during the recession period.
Spanish social structure improved for the period considered in terms of education. Nonetheless, unlike other surrounding countries,9 it has not been linked with a change in social class, which could be explained by different factors. First, Spain is one of The Organisation for Economic Co-operation and Development (OECD) countries where economic inequalities have increased more markedly in recent years, mainly because of unemployment and the lack of social policies to protect the most vulnerable groups.27 Other reasons may be related to the type of manufacturing work in Spain and the “brain drain” to other European countries with better job opportunities during the Great Recession. Because of that, the 2011 data reflected a negative migration balance with a significant migration rate amongst young Spanish workers with a high educational level.28
In relation to health care use patterns during the study period, our findings are consistent with the literature.11,29 The prevalence of health care utilization was higher in women, which has been justified by the social roles assumed by women and men. Women use health services not only to cover their own health needs, but also those of their family members. On the contrary, there are still men who consider that going to the doctor as negatively related to their masculinity.30,31 Authors29,32 have associated the increasing trend in health services utilization for various reasons. Firstly, the increase in SC may be due to changes in clinical practice. Lostao et al.33 related this with an increase in the rate of patient referral from general practitioners to specialist physicians. Secondly, this increase could be due to the worsening of health status and changes in the perception of health needs, mainly in the elderly. In this sense, some health indicators have worsened during this period, such as the deceleration of improvement in mortality rates since 2008, mainly in winter and in women, and increases in the prevalence of psychosocial stress.5
The plateau in the use of health services during the economic recession has also been found in other studies, and has been associated to an increased number of households that have given up or postponed medical care for financial reasons.12 In addition, other measures to control health care demand, such as an increase in waiting times, a reduction in service supply or in pharmaceutical co-payments34 could explain this trend.
There are socioeconomic inequalities in Spain in the use of healthcare services.10,29,34 The probability of PC use is higher for those in vulnerable socioeconomic conditions. Lostao et al.29,33 found that lower income categories used mainly PC, and Córdoba-Doña et al.35 observed a pro-low social class in the use of PC in Andalusia. These inequalities cannot be explained by health or sociodemographic characteristics. As we have observed for PC, after adjusting by the Andersen's Model, inequalities persist according to socioeconomic conditions, such as social class. This fact has been associated with different factors, such as low use of preventive services or low frequency of private health insurance, which forces disadvantage social classes to use PC.35 The characteristics of PC, in which access barriers are low and medical attention is supply on demand, could also impact the use of PC by disadvantaged people. With regard to the most advantaged groups, their high access to SC could be related with their better knowledge of the health system, as well as a higher use of private insurance.29 In contrast, the higher utilization observed amongst the unemployed for both sexes in the pre-recession period was lost during and after the recession. This reduction in use among low income groups has been attributed to a new pharmaceutical co-payment system as well as other measures. The pharmaceutical co-payment system led to difficulty for some in accessing certain medications that had been subsidized before the recession, and had been introduced due to difficulty in covering the cost of the previous arrangements.12,34,36
SC utilization was more frequent in people with positive socioeconomic indicators, and these inequalities increased during the recession period. People with medium and low educational level showed, during the economic recession, a lower probability of SC use than those with high education, even after adjusting for factors of need. In Spain, patients cannot use SC unless they are referred from PC.7 So, a deficit in health literacy amongst these educational groups could explain, at least partly, their lower utilization.6,29 Regarding social class, García-Subirats et al.12 reported that high social classes use SC with higher frequency than low social classes, as was observed in this study. This could be associated, also, to health literacy, which facilitates SC access to more advantaged social groups.
Finally, on both PC and SC, it is possible to observe a high probability of utilization by male pensioners during the recession that is not associated with factors of need. This result is consistent with other studies33,34 and has been related to a high frequency of health insurance plans in this group.
This study has some limitations associated with the use of health surveys as an information source, such as the inability to establish causality and the lack of temporality of the exposure-effect association. Health care use information was obtained from direct statements of those interviewed. However, health results obtained by survey are similar to those registered by electronic medical records.37 In addition, we could not use income level due to the high percentage of absent observations and the different criteria used among surveys. Instead of income, we have used three different socioeconomic indicators as proxies of socioeconomic level, which also provide different perspectives of the socioeconomic context. On the other hand, the surveys used are representative at a national level with a substantial sample available and a low number of absent values in the variables included (less than 5%).
The results of our study show that, in Spain, for the period 2001-2017, the use of healthcare services has increased, showing a plateau during the economic recession and a decrease when the recession ended. There are socioeconomic inequalities in the use of health services, with a higher use of PC by disadvantaged socioeconomic classes and a lower SC utilization. These inequalities increased for SC during the recession, and cannot be attributed to factors of need. Explaining the use of health care services based on socioeconomic indicators should be part of explanatory models in order to achieve health equity38 as well as to explore how these socioeconomic differences translate into different health results. Socioeconomic inequalities must be taken into account in order to control the effect of the subject's economic context on our health systems.
The Great Recession in Spain led to an increase in the most vulnerable groups, because of the rapid rise in unemployment and the lack of social policies. In addition, there are social inequalities in the use of health services: low social classes mainly use primary care, while specialized care utilization is more frequent in high classes.
What does this study add to the literature?Health care use trend have changed from a rapid increased in the pre-crisis to a plateau during the crisis and a decrease in the post-crisis period. Inequalities in health care use have increased for the crisis and post-crisis period mainly in Specialized Care. Explaining the use of health care services based on socioeconomic indicators should be part of explanatory models in order to achieve health equity.
María-Victoria Zunzunegui.
Transparency declarationThe corresponding author on behalf of the other authors guarantee the accuracy, transparency and honesty of the data and information contained in the study, that no relevant information has been omitted and that all discrepancies between authors have been adequately resolved and described.
Authorship contributionsR. Sánchez-Recio, J.P. Alonso-Pérez de Ágreda and I. Aguilar Palacio conceived and designed the study. R. Sánchez-Recio, J.P. Alonso-Pérez de Ágreda and I. Aguilar Palacio participated in the study, obtaining the data, interpreting the results, and writing and critically reviewing the manuscript. All signatories have approved the final version of the text.
FundingThis study was carried out with the financial support of the Grupo de Investigación en Servicios Sanitarios de Aragón (GRISSA) (B09-17R). This research group is funded by Gobierno de Aragón and Fondo Europeo de Desarrollo Regional (FEDER).
Conflicts of interestNone.


