


Edited by: Carme Borell
Last update: March 2023
More infoTo analyse the trend in life expectancy (LE), healthy life expectancy (HLE) and socio-economic inequalities by neighbourhood in Barcelona from the pre-pandemic period (2018-2019) to the pandemic period (2020-2021).
MethodLE and HLE at birth were computed using the municipal register of inhabitants and quality of life (EuroQol) from the Barcelona Health Survey of 2016. Inequalities were assessed with the gap between quantiles of neighbourhood income.
ResultsIn 2020, there was a reduction in LE among men (−1.98 years) and women (−2.44) and in HLE among men (−1.44). Socio-economic inequalities in LE and HLE between neighbourhoods widened since 2019 to 2021 (LE: from 3.92 to 4.86 years for men, and from 1.30 to 3.60 for women; HLE: from 6.88 to 7.70 years for men, and from 7.85 to 9.31 for women).
ConclusionsThe pandemic has substantially reduced LE and HLE, with larger effects among low-income neighbourhoods, especially among women.
Analizar la evolución de la esperanza de vida (EV), la esperanza de vida en buena salud (EVBS) y las desigualdades socioeconómicas por barrios en Barcelona desde el periodo prepandémico (2018-2019) hasta el periodo de pandemia (2020-2021).
MétodoSe calcularon la EV y la EVBS al nacimiento utilizando el registro municipal de habitantes y la calidad de vida (EuroQol) de la Encuesta de Salud de Barcelona de 2016. Las desigualdades se valoraron mediante la brecha entre los cuantiles de ingreso por barrios.
ResultadosEn 2020 hubo una reducción en la EV en los hombres (−1,98 años) y las mujeres (−2,44), y en la EVBS en los hombres (−1,44). Las desigualdades socioeconómicas en EV y EVBS por barrios se ampliaron de 2019 a 2021 (EV: de 3,92 hasta 4,86 años en hombres y de 1,30 hasta 3,60 años en mujeres; EVBS: de 6,88 hasta 7,70 años en hombres y de 7,85 hasta 9,31 años en mujeres).
ConclusionesLa pandemia ha reducido sustancialmente la EV y la EVBS, con mayores efectos en los barrios de menor renta, en especial en las mujeres.
The first studies that appeared during the COVID-19 pandemic in 2020 documented decreases in life expectancy (LE) with the largest reduction in Russia (men−2.33 years, women −2.14 years), followed by the USA, Bulgaria and Lithuania, mostly attributable to COVID-19 and excess deaths in persons younger than 65 years.1,2 Official regional statistics have also yielded regional data showing the highest LE drops in the regions of Madrid (−3.5 years), Castille-La-Mancha and Lombardy (−2.8), among others.3
Regarding inequalities, larger reductions in LE have been reported among the black and Latino populations than among the non-Hispanic white American population and among low-income census tracts in California.4,5 Larger effects of years of life lost have also been reported in the most deprived areas in Scotland, mainly driven by deaths at younger ages.6 Another report showed that significant increases in LE inequalities during the pandemic in deprived areas of England, but no significant changes in inequalities in healthy life expectancy (HLE)7. In Spain, two studies, one conducted in the region of Madrid and the other in city of Barcelona, found an association between the incidence of COVID-19 and deprived areas, depending on pandemic waves.8,9 However, the evidence on socioeconomic inequalities in LE and HLE during the COVID-19 pandemic are still scarce. Probably because it is a recent phenomenon, there are no systematic reviews yet. Even so, HLE more accurately captures differences in the well-being of years lived across socioeconomic groups than LE.
The aim of this study was to describe trends in LE and HLE and their inequalities by neighbourhood income for the period 2018-2021. Barcelona has a population close to 1.7 million inhabitants distributed unevenly in 73 neighbourhoods within 10 administrative districts and wide income variability among neighbourhoods.
MethodLE at birth was obtained by abridged (from less than 1 year and thereafter in 5-year age groups, from 1-4 years to 85-89 and 90 and over years) life tables by sex from 2018-2021 which were computed based on the size of the population and number of deaths from the register of inhabitants. Standard error for LE was obtained by modelling the number of deaths for each age group as a binomial event.10 The reliability of LE estimates was assessed with the ratio of the standard error and LE (RSE).
HLE at birth was computed with the Sullivan method,11 applying the Euroqol-5D-5L weights validated for the Spanish population12 obtained from the Barcelona Health Surveys (BHS) for 2016 and applied to LE years from 2018 to 2021. Due to the small sample sizes in some age groups, smoothed estimates of the EuroQol 5D-5L utilities were computed by a quadratic polynomial. For the age groups under 14 years, the closest utility was imputed to these groups. For 2021, for which EuroQol is also available, we ran a sensitivity analysis to determine whether the results differed when applying EuroQol utilities for 2016. Differences between years in LE and HLE were confirmed with the corresponding p-values.11
Neighbourhoods were grouped in quantiles by income for the year 2018. The number of quantiles was selected, as recommended, by preserving a minimum of 25,000 population by sex in each quantile.13 Inequalities were assessed by both the difference between the lowest and the highest resulting quantiles and by computing the Slope Index of Inequality, which involved fitting a linear regression to the ranked income quantiles and (H)LE. All computations were done with Stata v15.
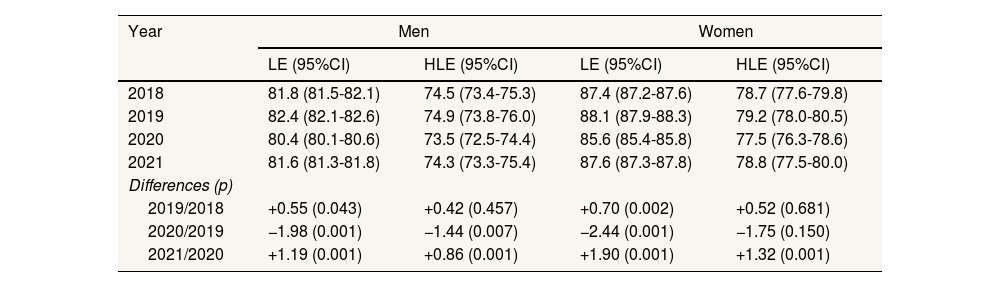
ResultsLE in Barcelona city was rising before the COVID-19 pandemic in 2020, when it dropped by 1.98 years for men and by 2.44 for women. HLE decreased by 1.44 years for men and by a non-significant 1.75 years for women. Both LE and HLE recovered the following year, 2021, but remained below the pre-pandemic values for 2019 (Table 1). There was a gap between LE and HLE of around 7 years for men and more than 8 years for women across the years except in 2020, when the gap narrowed.
Life expectancy and healthy life expectancy with 95% confidence intervals in Barcelona, 2018-2021.
| Year | Men | Women | ||
|---|---|---|---|---|
| LE (95%CI) | HLE (95%CI) | LE (95%CI) | HLE (95%CI) | |
| 2018 | 81.8 (81.5-82.1) | 74.5 (73.4-75.3) | 87.4 (87.2-87.6) | 78.7 (77.6-79.8) |
| 2019 | 82.4 (82.1-82.6) | 74.9 (73.8-76.0) | 88.1 (87.9-88.3) | 79.2 (78.0-80.5) |
| 2020 | 80.4 (80.1-80.6) | 73.5 (72.5-74.4) | 85.6 (85.4-85.8) | 77.5 (76.3-78.6) |
| 2021 | 81.6 (81.3-81.8) | 74.3 (73.3-75.4) | 87.6 (87.3-87.8) | 78.8 (77.5-80.0) |
| Differences (p) | ||||
| 2019/2018 | +0.55 (0.043) | +0.42 (0.457) | +0.70 (0.002) | +0.52 (0.681) |
| 2020/2019 | −1.98 (0.001) | −1.44 (0.007) | −2.44 (0.001) | −1.75 (0.150) |
| 2021/2020 | +1.19 (0.001) | +0.86 (0.001) | +1.90 (0.001) | +1.32 (0.001) |
95%CI: 95% confidence interval; HLE: healthy life expectancy; LE: life expectancy.
All HLE computed with EuroQol 5D-5L for 2016.
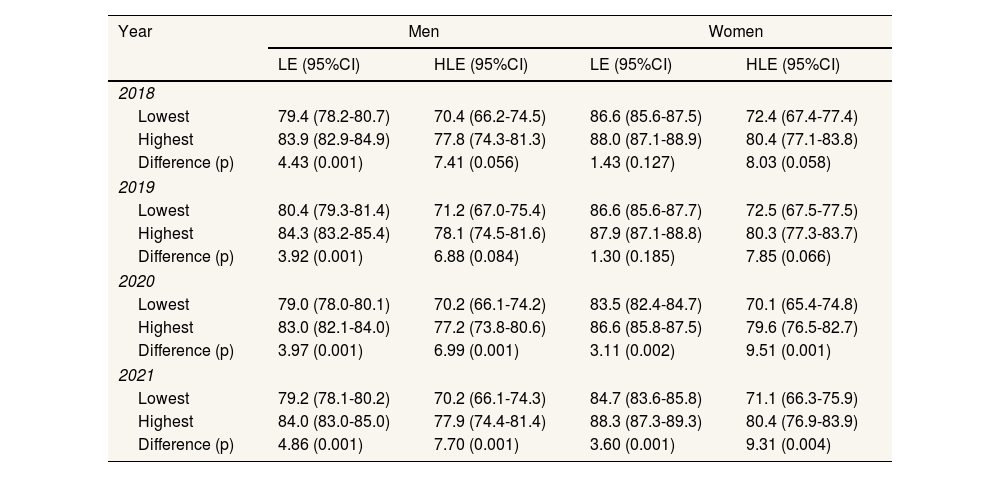
The aggregate LE and HLE masked differences by neighbourhood income (Table 2). Among men, these inequalities appeared to widen after 2019 (LE: from 3.92 years in 2019 up to 4.86 years in 2021; HLE: from 6.88 to 7.70 years) due to the faster recovery among the highest income neighbourhoods. Among women, inequalities by neighbourhood income were also lower before the pandemic (LE: from 1.30 years in 2019 to 3.60 years in 2021; HLE: from 7.85 years to 9.31 years, respectively) with a larger drop in HLE in low-income areas among women. Inequalities in HLE by neighbourhood income were larger than for LE because of the lower quality of life among the most deprived men and women.
Difference by lowest and highest 14 income quantiles in life expectancy and healthy life expectancy with 95% confidence intervals in Barcelona, 2018-2021.
| Year | Men | Women | ||
|---|---|---|---|---|
| LE (95%CI) | HLE (95%CI) | LE (95%CI) | HLE (95%CI) | |
| 2018 | ||||
| Lowest | 79.4 (78.2-80.7) | 70.4 (66.2-74.5) | 86.6 (85.6-87.5) | 72.4 (67.4-77.4) |
| Highest | 83.9 (82.9-84.9) | 77.8 (74.3-81.3) | 88.0 (87.1-88.9) | 80.4 (77.1-83.8) |
| Difference (p) | 4.43 (0.001) | 7.41 (0.056) | 1.43 (0.127) | 8.03 (0.058) |
| 2019 | ||||
| Lowest | 80.4 (79.3-81.4) | 71.2 (67.0-75.4) | 86.6 (85.6-87.7) | 72.5 (67.5-77.5) |
| Highest | 84.3 (83.2-85.4) | 78.1 (74.5-81.6) | 87.9 (87.1-88.8) | 80.3 (77.3-83.7) |
| Difference (p) | 3.92 (0.001) | 6.88 (0.084) | 1.30 (0.185) | 7.85 (0.066) |
| 2020 | ||||
| Lowest | 79.0 (78.0-80.1) | 70.2 (66.1-74.2) | 83.5 (82.4-84.7) | 70.1 (65.4-74.8) |
| Highest | 83.0 (82.1-84.0) | 77.2 (73.8-80.6) | 86.6 (85.8-87.5) | 79.6 (76.5-82.7) |
| Difference (p) | 3.97 (0.001) | 6.99 (0.001) | 3.11 (0.002) | 9.51 (0.001) |
| 2021 | ||||
| Lowest | 79.2 (78.1-80.2) | 70.2 (66.1-74.3) | 84.7 (83.6-85.8) | 71.1 (66.3-75.9) |
| Highest | 84.0 (83.0-85.0) | 77.9 (74.4-81.4) | 88.3 (87.3-89.3) | 80.4 (76.9-83.9) |
| Difference (p) | 4.86 (0.001) | 7.70 (0.001) | 3.60 (0.001) | 9.31 (0.004) |
95%CI: 95% confidence interval; HLE: healthy life expectancy; LE: life expectancy.
All HLE computed with EuroQol 5D-5L for 2016
As a measure of inequality, we have reported the gap between the lowest and highest quantiles. Although the Slope Index of Inequality is generally a preferred method for reporting inequality, it was not adequate for women due to the non-linearity in the relation between LE/HLE and income quantiles while for men both measures gave analogous results (comparisons not shown). All RSE were around 25%, which is considered a reliable LE estimate.
DiscussionDuring the first year of the COVID-19 pandemic, LE decreased among men and women, HLE decreased among men, and inequalities by neighbourhoods in LE and HLE widened, especially among women.
The reduction in LE of 1.98 years for men and 2.44 years for women during the first year of the pandemic in 2020 was in the high range compared with other countries or European regions but was below other Spanish regions (such as in Madrid and Castille-La-Mancha). Unlike other international studies2 and in particular to a study in Madrid,14 we found a larger reduction in LE among women than among men. While there was evidence of excess COVID-19 mortality rates for men compared with women in Barcelona, as in most European regional areas,15 our subsequent computations confirm the excess years lost for women outweighing the excess death rates among men. The lower reduction in HLE than in LE was probably due to the deaths among the older population with lower quality of life.
Our results also show widening inequalities due to the larger drop in LE among women in the lowest income neighbourhoods compared the highest, but this finding was less marked in men. This result is akin to the most deprived areas being hit hardest by the pandemic, taking the first 5 waves together. However, the drop and inequalities by income areas in Barcelona appear to be lower than those reported among the districts in Madrid (4.72 years for men and 3.91 for women).14
In this study, applying the EuroQol of 2016 to all years allowed us to isolate the effect of changes in mortality rates by age on HLE across the years. Indeed, the sensitivity analysis, which applied the EuroQol for BHS-2021 to the year 2021, yielded similar conclusions (results not shown). Our study differs from a previous study that found no variation in HLE inequalities during COVID-19 using perceived health and functional limitations7. We believe this is due, at least partially, to our use of the EuroQol which may have captured greater heterogeneity of health status. Because the pandemic has reduced women's LE more in low-income areas than in the highest-income areas, it is more probable that the deaths of younger women with higher quality of life in these areas contributed to the widening inequality gap in HLE observed during the pandemic years. For men the same mechanism seemed to apply but to a lesser extent.
In summary, the pandemic substantially decreased LE and HLE with larger effects among low-income neighbourhoods, especially among women.
Availability of databases and material for replicationData available to persons on request to X. Bartoll-Roca (xbartoll@aspb.cat) from the Institut d’Investigació Biomèdica Sant Pau, Barcelona (Spain), in accordance with the data policy applicable to the municipal register of inhabitants and the Barcelona health survey.
Prior research has found reductions in life expectancy during the COVID-19 outbreak in 2020 and inequalities in incidence rates depending on COVID-19 waves.
What does this study add to the literature?We also report reductions in healthy life expectancy, especially among low-income neighborhoods, but, in addition, we identified a partial recovery in 2021 driven by a faster recovery in high-income neighborhoods, both in life expectancy and in healthy life expectancy.
What are the implications of the results?There is a need to incorporate a view of inequalities in prevention policies to mitigate the unequal socioeconomic effects of the pandemic.
Carlos Álvarez Dardet.
Transparency declarationThe corresponding author on behalf of the other authors guarantee the accuracy, transparency and honesty of the data and information contained in the study, that no relevant information has been omitted and that all discrepancies between authors have been adequately resolved and described.
Authorship contributionsX. Bartoll-Roca, L. Palència, M.J. Calvo and K. Pérez contributed to the planning and conception. X. Bartoll-Roca contributed to the design and implementation of the study and drafted the manuscript. L. Palència, M.J. Calvo and K. Pérez contributed to critical discussion.
FundingNone.
Conflicts of interestNone.


