


To describe the use of nutrition and health claims in products directed at children via television in Spain and to analyse their nutrient profile.
MethodsA cross-sectional study of television food advertisements over 7 days in five Spanish television channels popular among children. The products were classified as core, non-core or miscellaneous, and as either healthy or less healthy, according to the United Kingdom Nutrient Profile Model. We registered all claims contained on the product (packaging and labelling) and its advertisement. We calculated the frequency distributions of health and nutrition claims.
ResultsDuring the 420hours of broadcasting, 169 food products were identified, 28.5% in the dairy group and 60.9% in the non-core category. A total of 53.3% of products contained nutrition claims and 26.6% contained health claims; 62.2% of the products with claims were less healthy. Low-fat dairy products were the food category containing the highest percentage of health and nutrition claims.
ConclusionOver half of all food products marketed to children via television in Spain made some type of nutrition or health claim. Most of these products were less healthy, which could mislead Spanish consumers.
Describir la frecuencia de uso de alegaciones nutricionales y de salud en productos dirigidos a niños por televisión en España y analizar su perfil nutricional.
MétodosEstudio descriptivo transversal de publicidad alimentaria en cinco canales de televisión españoles populares entre los niños durante 7 días. Los productos se clasificaron como esenciales, no esenciales y misceláneos, y como saludables o menos saludables, según el perfil nutricional del Reino Unido. Se registraron las alegaciones nutricionales o de salud presentes en el producto o el anuncio correspondiente, y se calculó su distribución de frecuencias.
ResultadosDurante las 420 horas de emisión se identificaron 169 productos alimentarios, el 28,5% del grupo lácteos y el 60,9% no esenciales. El 53,3% de los productos presentaban alegaciones nutricionales y el 26,6% alegaciones de salud. El 62,2% de los productos con alegaciones fueron menos saludables. Los productos lácteos bajos en grasa fueron la categoría alimentaria que contenía el porcentaje más alto de alegaciones nutricionales y de salud.
ConclusiónMás de la mitad de los productos alimentarios anunciados para niños por televisión en España presentaban alegaciones nutricionales o de salud. La mayoría de esos productos eran menos saludables, pudiendo inducir a confusión a los consumidores españoles.
Through its influence on children's food preferences, purchases and consumption, intensive advertising of energy-dense, nutrient-poor (EDNP) food and beverages is one of the factors lying at the core of the current childhood obesity epidemic.1 Although advertising makes use of an integrated multi-channel approach, television continues to be the principal avenue for promotion of food and drinks for children.2 In Spain, television registered the highest turnover in 2012, accounting for 39.2% of all investment in conventional media.3 The leading non-conventional media are personalised mailing and point-of-sale advertising, through information contained on product presentation (labels, packaging and display stands) which is designed to stimulate impulse buying. It has been estimated that children in Spain receive an average of 4000 hits per year of television advertisements of EDNP food and beverages.4 Two studies on samples of products with nutrition and health claims detected that most of the statements made were ambiguous and in up to 40% of cases were in breach of some law.5,6 Another study, conducted in 2008 on a sample of foods and drinks advertised on television, found that half of the advertisements of EDNP products made use of such claims.7
Nutritional marketing, through the use of nutrition and health claims that draw attention to the nutritional qualities or alleged health benefits of certain products, has appealed to many consumers, and shown itself capable of influencing their perceptions about such products’ nutritional quality and healthiness.8,9 There are experimental studies that show how the presence of nutrition claims induced a group of parents -and particularly the majority who did not read the information contained in the nutrition labelling- to choose EDNP products for their children.10,11 Similarly, two experimental studies both found that pre-adolescents perceived products with nutrient claims as being healthier and tastier, and were more likely to choose EDNP products carrying such claims.12,13
To respond to citizens’ interest in the relationship between diet and health, and prevent the use of fraudulent or misleading nutrition marketing, in 2006 the European Commission promulgated the Regulation on nutrition and health claims made on foods.14 This Regulation envisages the future establishment of nutrient profiles: these would evaluate the overall nutritional value of a given product, through analysis of its ingredients and nutritional composition, and so prevent consumers from being misled by nutrition and/or health claims in food and drinks containing high levels of some nutrient whose excessive consumption might be harmful to health. To date, however, no such nutrient profiles have been established at European level. In addition to adopting European legislation, Spain has seen a number of laws passed and voluntary agreements concluded with the food industry, which govern advertising and nutrition and, to a greater or lesser degree, affect advertising containing health claims.15 The aim has been to reinforce the public's right to truthful information in this field. Even so, despite this profusion of statutory rules and regulations, no nutrient profile has yet been drawn up at a national level. Consequently, here in Spain, there is the possibility of nutrition and/or health claims being authorised in products which are high in fat, salt and/or sugar (HFSS), provided that they meet the criterion stipulated in the regulation pertaining to the claim made.
The United Kingdom nutrient profiling model (UKNPM),16 which was drawn up by the Food Standards Agency to regulate food advertising targeted at children and has shown good concordance with alternative nutrient profiles,17 is one of the models that could be considered for identifying products which are or are not likely, according to their nutrient profiles, to display nutrition or health claims. Accordingly, this study had a twofold aim: firstly, to describe the frequency of use of nutrition and health claims in products directed at children via television in Spain; and secondly, to analyse the nutrient profile of such products by applying the UKNPM, in line with the recommendations of the international network for food and obesity/non-communicable disease research, monitoring and action support.18
MethodsStudy designWe conducted a cross-sectional study of television food advertising directed at children in Spain, by recording 7 days’ broadcasting (Monday to Sunday) by nation-wide channels targeting the child-youth population (Boing, Disney Channel and Neox) and two generalist channels with the highest child-audience viewing indices (Channels 3 and 5).19 The broadcasts were recorded from January to April 2012, excluding Easter holidays, during a child-audience time slot (8 pm-12 midnight) that had been modified by replacing the 6 pm-8 pm time slot, which had hardly any audience, with the 10 pm-12 midnight time slot, which registered the last daily child-audience viewing peak in Spain.20 Trained researchers watched the recordings and listed all the products advertised in commercial food and drink communications. Food product placement was not registered due to its variable nature. The information regarding health claims and nutritional profile of the listed products was registered by the same researcher.
Data-collection and study variables1)International food-based coding systemAdvertised products were purchased and classified into the following three categories according to an international food-based coding system: core (nutrient-rich/calorie-low products); non-core (high in saturated fats, trans-fatty acids, free sugars or salt, and/or energy-dense); and miscellaneous.21 In the case of products with different varieties or flavours, we coded the brand that was most representative or most easily identifiable in the advertisement. When all or none of the varieties were shown, we chose the one known to have the highest consumption in the general population, e.g., the semi-skimmed variety for dairy products, the most popular in Spain.22 Finally, when only the brand's name or logo was shown, the company's most representative product was registered.
2)Nutrition and health claimsPursuant to the European Regulation on nutrition and health claims made on foods, a “nutrition claim” is defined as any claim which states, suggests or implies that a food has particular beneficial nutritional properties due to its energy contribution or nutrient content, and a “health claim” as any claim that states, suggests or implies that a relationship exists between a food category, a food or one of its constituents and health.14 Due to their low frequency, claims of reduction of risk of disease were pooled with the remaining health claims. As the Regulation is not applicable to alcoholic beverages with an alcoholic strength by volume of over 1.2%, the latter were excluded from the study. To detect the presence of nutrition and health claims in the products advertised, both the presentation of each food product (packaging and labelling) and the content of the pertinent television advertisement (graphic, spoken or written, etc.) were thoroughly analysed.
3)United Kingdom Nutrient Profiling ModelEach food product was examined using the UKNPM, a model that evaluates the nutritional composition of the food/drink advertised by analysing its healthy (fibre, protein, and vegetables, fruit and nuts) and less healthy components (calories, sugars, saturated fats and salt) per 100g. If the model's algorithm assigns a score of less than 4 for food or less than 1 for drinks, the product is classified as healthy; in all other cases it is classified as less healthy (i.e., EDNP).16
We collected nutritional composition information from the product labels themselves. When the product could not be located, we obtained the information from the company's website or by requesting it from the manufacturer. For 24 of the 169 products, we referred to Spanish and international food-composition databases either to complete the data for one or more components, usually grams of saturated fat, sugars, fibre or salt, or alternatively in the case of already reconstituted products, such as pasta.23,24
The model was not applicable to food-chain menus (e.g., McDonald's, Happy Meal) because these include food and drinks that are scored differently. In such cases, we chose to include the hamburger as the menu's most representative item. Products from some food chains, such as KFC and Pan's & Company, and some products, such as all-natural tuna fish pâté, were not examined due to a lack of sufficient nutritional information for analysis. Wherever possible, however, we found products comparable to the ones advertised, e.g., for Telepizza we used the information from a ham and cheese pizza made by the Casa Tarradellas brand.
4)AnalysisDescriptive analyses were performed to determine: the proportion of products carrying claims, both overall and for each food category; and the proportion of EDNP products, according to the UKNPM, among those carrying claims. For health claims and each of the nutrient claims, we also calculated the food categories that most frequently carried such claims. All analyses were performed using the Microsoft Excel spreadsheet and Stata v.13 computer software package.25
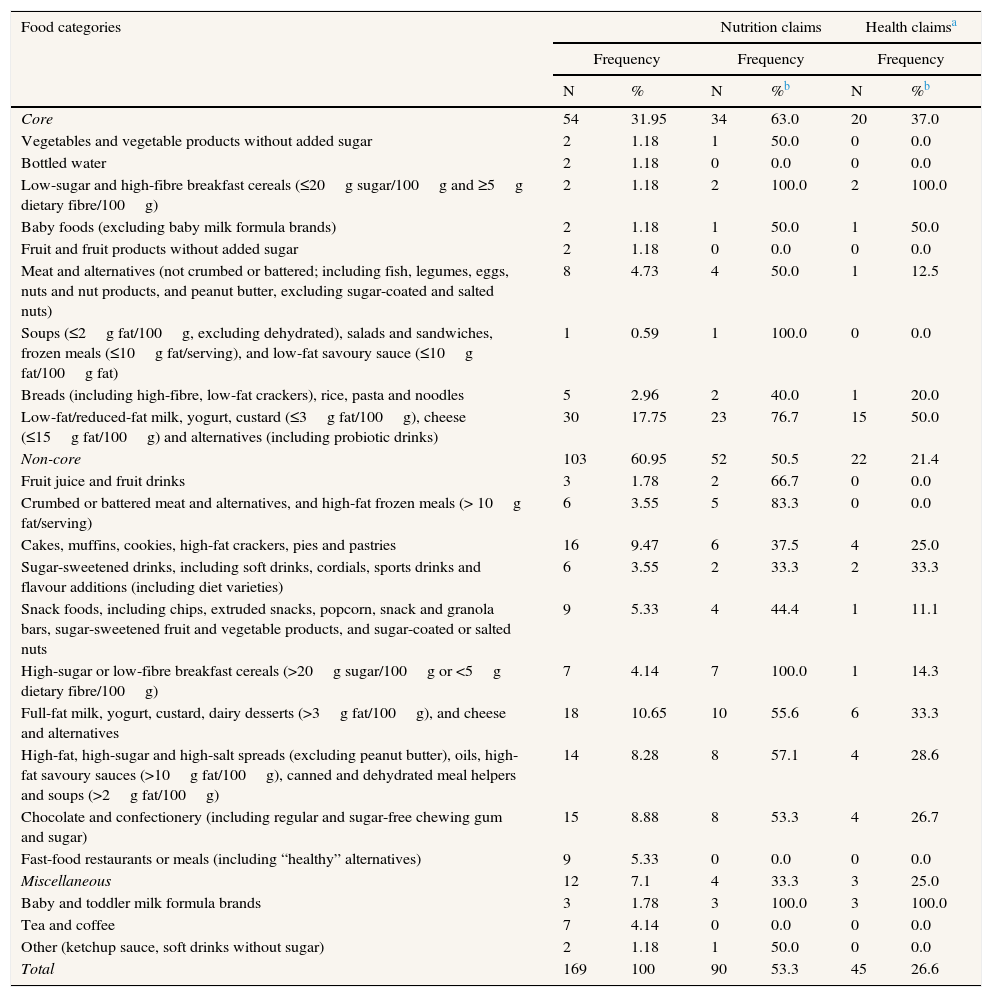
ResultsIn the food and drink advertisements aired during the course of the 420hours of broadcasting recorded, 169 different products were identified, 60.9% in the non-core, 32% in the core and 7.1% in the miscellaneous category. Dairy products, with 48 items (28.5% of the total), were the most frequent food item in the sample, with 62.5% of these corresponding to the core category by virtue of being low-fat. The next most frequent food items were: 1) cakes, muffins, cookies, high-fat crackers, pies and pastries; 2) chocolate and confectionery; and 3) high-fat, high-sugar and high-salt spreads, oils, high-fat savoury sauces, canned and dehydrated meal helpers and soups, accounting for 9.5%, 8.9% and 8.3% of products respectively, all in the non-core category (Table 1).
Nutrition and health claims by food category, in products advertised on television for children in Spain, 2012.
| Food categories | Nutrition claims | Health claimsa | ||||
|---|---|---|---|---|---|---|
| Frequency | Frequency | Frequency | ||||
| N | % | N | %b | N | %b | |
| Core | 54 | 31.95 | 34 | 63.0 | 20 | 37.0 |
| Vegetables and vegetable products without added sugar | 2 | 1.18 | 1 | 50.0 | 0 | 0.0 |
| Bottled water | 2 | 1.18 | 0 | 0.0 | 0 | 0.0 |
| Low-sugar and high-fibre breakfast cereals (≤20g sugar/100g and ≥5g dietary fibre/100g) | 2 | 1.18 | 2 | 100.0 | 2 | 100.0 |
| Baby foods (excluding baby milk formula brands) | 2 | 1.18 | 1 | 50.0 | 1 | 50.0 |
| Fruit and fruit products without added sugar | 2 | 1.18 | 0 | 0.0 | 0 | 0.0 |
| Meat and alternatives (not crumbed or battered; including fish, legumes, eggs, nuts and nut products, and peanut butter, excluding sugar-coated and salted nuts) | 8 | 4.73 | 4 | 50.0 | 1 | 12.5 |
| Soups (≤2g fat/100g, excluding dehydrated), salads and sandwiches, frozen meals (≤10g fat/serving), and low-fat savoury sauce (≤10g fat/100g fat) | 1 | 0.59 | 1 | 100.0 | 0 | 0.0 |
| Breads (including high-fibre, low-fat crackers), rice, pasta and noodles | 5 | 2.96 | 2 | 40.0 | 1 | 20.0 |
| Low-fat/reduced-fat milk, yogurt, custard (≤3g fat/100g), cheese (≤15g fat/100g) and alternatives (including probiotic drinks) | 30 | 17.75 | 23 | 76.7 | 15 | 50.0 |
| Non-core | 103 | 60.95 | 52 | 50.5 | 22 | 21.4 |
| Fruit juice and fruit drinks | 3 | 1.78 | 2 | 66.7 | 0 | 0.0 |
| Crumbed or battered meat and alternatives, and high-fat frozen meals (> 10g fat/serving) | 6 | 3.55 | 5 | 83.3 | 0 | 0.0 |
| Cakes, muffins, cookies, high-fat crackers, pies and pastries | 16 | 9.47 | 6 | 37.5 | 4 | 25.0 |
| Sugar-sweetened drinks, including soft drinks, cordials, sports drinks and flavour additions (including diet varieties) | 6 | 3.55 | 2 | 33.3 | 2 | 33.3 |
| Snack foods, including chips, extruded snacks, popcorn, snack and granola bars, sugar-sweetened fruit and vegetable products, and sugar-coated or salted nuts | 9 | 5.33 | 4 | 44.4 | 1 | 11.1 |
| High-sugar or low-fibre breakfast cereals (>20g sugar/100g or <5g dietary fibre/100g) | 7 | 4.14 | 7 | 100.0 | 1 | 14.3 |
| Full-fat milk, yogurt, custard, dairy desserts (>3g fat/100g), and cheese and alternatives | 18 | 10.65 | 10 | 55.6 | 6 | 33.3 |
| High-fat, high-sugar and high-salt spreads (excluding peanut butter), oils, high-fat savoury sauces (>10g fat/100g), canned and dehydrated meal helpers and soups (>2g fat/100g) | 14 | 8.28 | 8 | 57.1 | 4 | 28.6 |
| Chocolate and confectionery (including regular and sugar-free chewing gum and sugar) | 15 | 8.88 | 8 | 53.3 | 4 | 26.7 |
| Fast-food restaurants or meals (including “healthy” alternatives) | 9 | 5.33 | 0 | 0.0 | 0 | 0.0 |
| Miscellaneous | 12 | 7.1 | 4 | 33.3 | 3 | 25.0 |
| Baby and toddler milk formula brands | 3 | 1.78 | 3 | 100.0 | 3 | 100.0 |
| Tea and coffee | 7 | 4.14 | 0 | 0.0 | 0 | 0.0 |
| Other (ketchup sauce, soft drinks without sugar) | 2 | 1.18 | 1 | 50.0 | 0 | 0.0 |
| Total | 169 | 100 | 90 | 53.3 | 45 | 26.6 |
In all, 53.3% of products (n=90) carried nutrition claims and 26.6% (n=45) carried health claims, with the figures being 63% and 37% respectively for core products, 50.5% and 21.4% respectively for non-core products and 33.3% and 25% respectively for miscellaneous products. With the single exception of the sports drink, Powerade ION 4, all the products that contained health claims also contained some type of nutrition claim, with the result that a total of 91 products overall made nutrition and/or health claims. The products registering the highest frequencies of nutrition or health claims were cereals and baby and toddler milk formula brands (100%), crumbed or battered meat and alternatives and high-fat frozen meals (83.3%), low-fat dairy products (76.7%), and fruit juices and fruit drinks (66.7%) (Table 1).
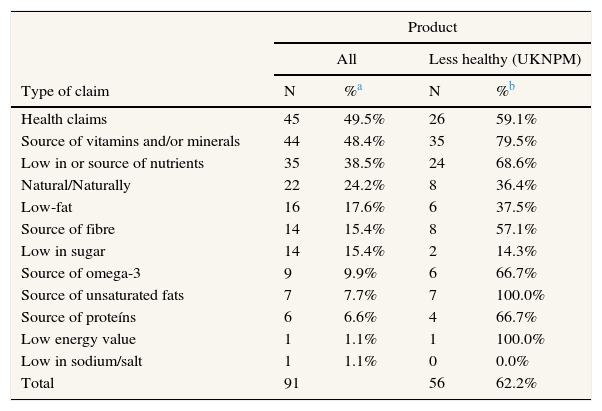
Among the 91 products (53.8% of the 169 products identified) containing some type of claim, most featured health claims, 49%, followed by claims relating to vitamins and minerals, nutrients, natural product and low-fat product, 48%, 38%, 24% and 18% respectively (Table 2). A total of 62.2% of products with claims were EDNP, with this figure being 100% for claims relating to high unsaturated-fat content, 79.5% for claims relating to source of vitamins and minerals, 37.5% for claims relating to low-fat, and 14.3% for claims relating to low-sugar.
Frequency and nutrient profile of products with each type of claim in Spain, 2012.
| Product | ||||
|---|---|---|---|---|
| All | Less healthy (UKNPM) | |||
| Type of claim | N | %a | N | %b |
| Health claims | 45 | 49.5% | 26 | 59.1% |
| Source of vitamins and/or minerals | 44 | 48.4% | 35 | 79.5% |
| Low in or source of nutrients | 35 | 38.5% | 24 | 68.6% |
| Natural/Naturally | 22 | 24.2% | 8 | 36.4% |
| Low-fat | 16 | 17.6% | 6 | 37.5% |
| Source of fibre | 14 | 15.4% | 8 | 57.1% |
| Low in sugar | 14 | 15.4% | 2 | 14.3% |
| Source of omega-3 | 9 | 9.9% | 6 | 66.7% |
| Source of unsaturated fats | 7 | 7.7% | 7 | 100.0% |
| Source of proteíns | 6 | 6.6% | 4 | 66.7% |
| Low energy value | 1 | 1.1% | 1 | 100.0% |
| Low in sodium/salt | 1 | 1.1% | 0 | 0.0% |
| Total | 91 | 56 | 62.2% | |
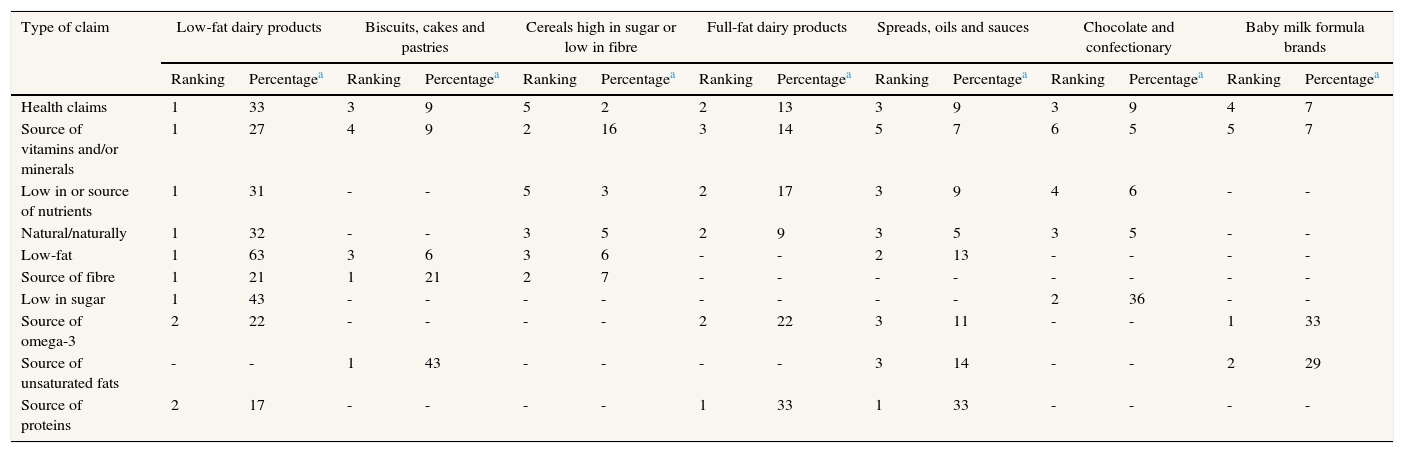
Table 3 shows the food categories with the highest percentages of each type of claim. Low-fat dairy products ranked first in terms of health claims, with a figure of 33%, and accounted for most of the nutrition claims, with the exception of those relating to proteins, omega-3 fatty acids and unsaturated fats. Biscuits, cakes and pastries registered the highest percentage of claims about the product being a source of unsaturated fats, 43%. In terms of being a source of fibre, however, biscuits, cakes and pastries registered the same percentage of claims as did low-fat products, 21%. A total of 33% of claims about the food being a source of proteins corresponded to dairy products, with an equivalent figure being registered by spreads, oils and sauces. Lastly, 33% of claims of the product being a source of omega-3 corresponded to baby milk formula brands.
Main food categories showing each type of claim by order of frequency in Spain, 2012a
| Type of claim | Low-fat dairy products | Biscuits, cakes and pastries | Cereals high in sugar or low in fibre | Full-fat dairy products | Spreads, oils and sauces | Chocolate and confectionary | Baby milk formula brands | |||||||
|---|---|---|---|---|---|---|---|---|---|---|---|---|---|---|
| Ranking | Percentagea | Ranking | Percentagea | Ranking | Percentagea | Ranking | Percentagea | Ranking | Percentagea | Ranking | Percentagea | Ranking | Percentagea | |
| Health claims | 1 | 33 | 3 | 9 | 5 | 2 | 2 | 13 | 3 | 9 | 3 | 9 | 4 | 7 |
| Source of vitamins and/or minerals | 1 | 27 | 4 | 9 | 2 | 16 | 3 | 14 | 5 | 7 | 6 | 5 | 5 | 7 |
| Low in or source of nutrients | 1 | 31 | - | - | 5 | 3 | 2 | 17 | 3 | 9 | 4 | 6 | - | - |
| Natural/naturally | 1 | 32 | - | - | 3 | 5 | 2 | 9 | 3 | 5 | 3 | 5 | - | - |
| Low-fat | 1 | 63 | 3 | 6 | 3 | 6 | - | - | 2 | 13 | - | - | - | - |
| Source of fibre | 1 | 21 | 1 | 21 | 2 | 7 | - | - | - | - | - | - | - | - |
| Low in sugar | 1 | 43 | - | - | - | - | - | - | - | - | 2 | 36 | - | - |
| Source of omega-3 | 2 | 22 | - | - | - | - | 2 | 22 | 3 | 11 | - | - | 1 | 33 |
| Source of unsaturated fats | - | - | 1 | 43 | - | - | - | - | 3 | 14 | - | - | 2 | 29 |
| Source of proteins | 2 | 17 | - | - | - | - | 1 | 33 | 1 | 33 | - | - | - | - |
Our results show that over half of all food products marketed to children via television in Spain made some type of nutrition or health claim, and nearly two-thirds of those making claims were EDNP, according to the UKNPM. The products having the highest percentage of claims were cereals. Nonetheless, in absolute terms most of the claims were contained in dairy products, given that these were the most numerous, accounting for almost one third of all products in the sample. The most frequent nutrition claims, present in half of the products, were those relating to vitamin and mineral content, and 80% of the products which contained these were EDNP.
In a study undertaken from 2008 to 2009, Spain ranked as one of the European Union countries having the highest penetration of nutrition claims; and this was with figures of less than one third of products,26 i.e., very much lower than those seen in our study. The restriction of the product sample in the above European study to only 5 food categories, as opposed to the 22 covered by us, might partly account for the differences observed, since a study conducted in Ireland with a product sample of 17 food categories, reported figures very similar to ours, i.e., 47.3% of products contained nutrition claims and 17.8% contained health claims27 versus 53.3% and 26.6% in our study. Another possible explanation for the differences lies in the fact that the sample used in our study consisted of products directed at children, since our figures are very like those of a similar study undertaken in Spain in 2008, with products advertised on television during time slots designated as protected for child viewing and/or having a large child audience.7 Indeed, a study undertaken in the USA showed that the presence of nutrition claims and other types of nutrition marketing techniques is up to 40% more frequent in products advertised for children,28 with absolute figures similar to those of our study; and according to two studies conducted in Canada and Australia on products targeted at children, the percentages that contained nutrition claims, 62.7%29 and 63.7%30 respectively, were even higher than that of our study.
Although half non-core products included nutrition claims, a finding similar to what was seen in the above-mentioned Australian study,30 ideally speaking only core products should contain nutrition or health claims. At least, this was the intention behind the European Regulation14 when it envisaged the future establishment of nutrient profiles to authorise the use of claims, something that today, almost a decade later, is still pending implementation. The consequence of this regulatory vacuum is that almost two thirds of products with nutrition claims marketed to children in Spain failed to meet the UKNPM criteria, thus surpassing the figures of 52% observed in the previous study conducted in Spain,7 55% observed in a study on dairy products conducted in Germany, France and the UK,17 and 1% observed in an Australian study which used a nutrient profile model based on that of the UK,31 though in the latter two studies the products covered were not specifically directed at children. In the above Canadian study,29 62% of products directed at children and containing claims were of poor nutritional quality, owing to their high fat, salt and/or sugar content, a figure very similar to that of 62.9% reported by us, which suggests that the nutrient profile of products with claims is worse when they are targeted at children.
The most frequently used nutrition claims were those relating to vitamin and mineral content, a finding similar to that of the previous Spanish study7 and the Canadian study on products directed at children;29 in contrast, in another Canadian study on pre-packaged foods marketed by leading grocery chains, claims relating to low-fat content ranked first.32 The predominance of claims relating to vitamin and mineral content in products directed at children is worrying, since 4 out of every 5 products that contained these claims were EDNP. These claims are typical in fortified products for children, such as breakfast cereals, which are usually EDNP, with figures equal or close to that of 100% of cases observed in Spain33 and other comparable countries, such as the USA34 and Germany.35 In the German product sample, the likelihood of products not complying with the requirements of the nutrient profile was observed to be higher in cereals marketed to children and in those that contained some type of claim. Although 100% of the breakfast cereals in our study bore some type of nutrition claim, the principal source of claims relating to vitamins and minerals was dairy products, with 41% of these, exceeding the figure of 30% seen in the Canadian study32 due to the fact that these were most numerous products in our sample.
The habitual presence of nutrition and/or health claims in products directed at children, in tandem with the poor nutrient profile of these, largely EDNP, can be assumed to be misleading Spanish consumers, since the main reason reported by the latter for reading food labelling was to choose healthier products.36 Indeed, the presence of claims has been observed to lead children and parents alike to perceive these products as being more nutritional and healthier, show a greater willingness to buy them, and be induced to choose EDNP products.11–13,37 Compulsory nutrition information on nutrition labelling could go some way to mitigate the misleading nature of these claims, though the health “halo” associated with products bearing claims might nonetheless inhibit consumers from consulting the nutrition information contained on the labelling.38 A recent study undertaken in Spain showed that most consumers did not usually read the nutrition labelling, with almost half of them reporting that they did not fully understand the nutrition information.36 Furthermore, an experimental study showed that the presence of nutrition claims induced the majority of parents who had not read the nutrition-labelling information to choose EDNP products for their children.10 A consumer's friendly front-of-pack nutrition label, like the keyhole labelling scheme in Nordic countries and the traffic-light nutrition system in UK,39 could serve to prevent this confusion. In Spain, however, only the Eroski supermarket co-operative, acting at the instance of its consumers’ association, uses the traffic light on its house brands.
This study's main limitation resides in the fact that it was restricted to products advertised on television, so that it might not be representative of all products directed at children. In addition, limiting the recording period to the months of January to April meant that seasonal products, such as ice-cream or typical Christmas items, were not represented. Even so, our sample included products drawn from the vast majority of food categories in the international food-based coding system.21 Moreover, the size and diversity of the product sample were similar or greater than those of like studies conducted in Australia and Canada, which used a major supermarket chain to select products directed at children.29,30
In conclusion, most of these products marketed to children via television in Spain making some type of nutrition or health claim were less healthy, which could be misleading Spanish consumers. As the European Commission Regulation envisages, to prevent the potential pernicious effect of nutrition and health claims on children's eating habits, use should be made of nutrient profiles that enable products which meet minimal nutrition criteria to be identified, such as the UKNPM, the tables used by Food Standards Australia New Zealand,31 or the model recently developed by the WHO Regional Office for Europe.40
Editor in chargeCarlos Álvarez-Dardet.
Transparency declarationThe corresponding author on behalf of the other authors guarantee the accuracy, transparency and honesty of the data and information contained in the study, that no relevant information has been omitted and that all discrepancies between authors have been adequately resolved and described.
Nutrition and health claims that draw attention to the nutritional qualities or alleged health benefits of certain products, have shown capable of influencing consumers perceptions about such products’ nutritional quality and healthiness.
What does this study add to the literature?Over half of all food products marketed to children via television in Spain made some type of nutrition or health claim, and nearly two-thirds of those were energy-dense and nutrient poor, which could be misleading Spanish consumers.
M.A. Royo conceived the study and wrote the first draft of the manuscript. J. Damian and M.J. Bosqued participated in the management and analysis of the data. M.A. Moya y L. López participated in the study desing and data collection. All authors contributed to the revision and approval of the final manuscript.
FundingThis project has been supported by the Spanish Health Research Fund of the Institute of Health Carlos III (Project ENPY 1015/13) and the Spanish Consumers Organization.
Conflicts of interestNone.
The authors thank Zoila Violeta Boza for her help in data collection.


